Attached files
| file | filename |
|---|---|
| 8-K - FORM 8-K - OUTERWALL INC | d479845d8k.htm |
| EX-99.1 - EARNINGS RELEASE - OUTERWALL INC | d479845dex991.htm |
Exhibit 99.2
Coinstar, Inc. 2012 Fourth Quarter Earnings
February 7, 2013
Prepared Remarks from CEO Paul Davis and CFO J. Scott Di Valerio
Coinstar, Inc. issued a press release today, February 7, 2013, announcing financial results for the 2012 fourth quarter and full year ended December 31, 2012. These prepared remarks provide additional information related to the company’s 2012 fourth quarter and full year operating and financial performance and 2013 first quarter and full year guidance.
Coinstar management will host a conference call today at 2 p.m. PST to answer questions related to the company’s business performance, financial results and guidance.
The press release, prepared remarks, and the webcast of the call are available on the Investor Relations section of Coinstar’s website at www.coinstarinc.com.
Safe Harbor for Forward-Looking Statements
Certain statements in these prepared remarks are “forward-looking statements” within the meaning of the Private Securities Litigation Reform Act of 1995. The words “believe,” “estimate,” “expect,” “intend,” “anticipate,” “goals,” variations of such words, and similar expressions identify forward-looking statements, but their absence does not mean that the statement is not forward-looking. The forward-looking statements in this release include statements regarding Coinstar, Inc.’s anticipated growth and future operating results, including 2013 first quarter and 2013 full year results. Forward-looking statements are not guarantees of future performance and actual results may vary materially from the results expressed or implied in such statements. Differences may result from actions taken by Coinstar, Inc. and Redbox, as well as from risks and uncertainties beyond Coinstar, Inc.‘s control. Such risks and uncertainties include, but are not limited to,
| • | competition from other digital entertainment providers, |
| • | the ability to achieve the strategic and financial objectives for our entry into a new business, |
| • | our limited ability to direct the management or policies of the new joint venture with Verizon Communications, |
| • | failure to receive the expected benefits of the NCR relationship, |
| • | the termination, non-renewal or renegotiation on materially adverse terms of our contracts with our significant retailers and suppliers, |
| • | payment of increased fees to retailers, suppliers and other third-party providers, including financial service providers, |
| • | the inability to receive delivery of DVDs on the date of their initial release to the general public, or shortly thereafter, or in sufficient quantity, for home entertainment viewing, |
| • | noteholders electing to convert our convertible notes, |
| • | the effective management of our content library, |
| • | the ability to attract new retailers, penetrate new markets and distribution channels and react to changing consumer demands, |
| • | the ability to achieve the strategic and financial objectives for our entry into or expansion of new businesses, |
| • | the ability to adequately protect our intellectual property, and |
| • | the application of substantial federal, state, local and foreign laws and regulations specific to our business. |
The foregoing list of risks and uncertainties is illustrative, but by no means exhaustive. For more information on factors that may affect future performance, please review “Risk Factors” described in our most recent Annual Report on Form 10-K and any subsequent Quarterly Reports on Form 10-Q filed with the Securities and Exchange Commission. These forward-looking statements reflect Coinstar, Inc.’s expectations as of the date of these prepared remarks. Coinstar, Inc. undertakes no obligation to update the information provided herein.
©2013 Coinstar, Inc. All Rights Reserved. These materials may not be reproduced, altered or distributed without the express written consent of Coinstar, Inc.
Coinstar, Inc. 2012 Fourth Quarter Earnings
February 7, 2013
Prepared Remarks from CEO Paul Davis and CFO J. Scott Di Valerio
Use of Non-GAAP Financial Measures
Non-GAAP measures may be provided as a complement to results provided in accordance with United States generally accepted accounting principles (“GAAP”).
We use the following non-GAAP financial measures to evaluate our financial results:
| • | Core adjusted EBITDA from continuing operations; |
| • | Core diluted earnings per share (“EPS”) from continuing operations; and |
| • | Free cash flow from continuing operations. |
These measures, the definitions of which are presented in Appendix A, are non-GAAP because they exclude certain amounts which are included in the most directly comparable measure calculated and presented in accordance with GAAP. Our non-GAAP financial measures are not meant to be considered in isolation or as a substitute for our GAAP financial measures and may not be comparable with similarly titled measures of other companies.
Core and Non-Core Results
We distinguish our core activities, those associated with our primary operations, from non-core activities. Non-core activities are primarily nonrecurring events or events we do not control. Our non-core adjustments include i) deal fees primarily related to the NCR asset acquisition, ii) income or loss from equity method investments, which represents our share of income or loss from entities we do not consolidate or control, and iii) a gain on the grant of a license to use certain Redbox trademarks to Redbox Instant™ by Verizon (“Non-Core Adjustments”). We believe investors should consider our core results because they are more indicative of our ongoing performance and trends and are more consistent with how management evaluates our operational results and trends.
Additional information and reconciliations of the non-GAAP financial measures are included in Appendix A.
©2013 Coinstar, Inc. All Rights Reserved. These materials may not be reproduced, altered or distributed without the express written consent of Coinstar, Inc.
Page 2
Coinstar, Inc. 2012 Fourth Quarter Earnings
February 7, 2013
Prepared Remarks from CEO Paul Davis and CFO J. Scott Di Valerio
2012: Driving Profitable Growth, Investing in the Future, Creating Value
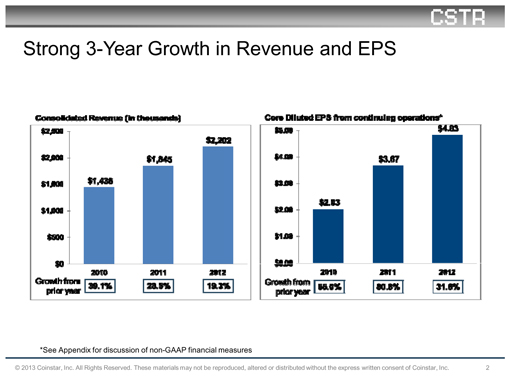
A summary of Coinstar, Inc.’s consolidated results1 for the year ended December 31, 2012, follows:
| Consolidated revenue |
$ | 2.202 billion | ||
| Net income |
$ | 150.2 million | ||
| Income from continuing operations |
$ | 150.2 million | ||
| Core adjusted EBITDA from continuing operations |
$ | 469.7 million | ||
| Diluted earnings per share from continuing operations |
$ | 4.67 | ||
| Core diluted EPS from continuing operations |
$ | 4.83 | ||
| Net cash flows from operating activities from continuing operations |
$ | 463.9 million | ||
| Free cash flow from continuing operations |
$ | 255.9 million |
2012 marked another year of solid financial performance as Coinstar, Inc.:
| • | Grew annual revenue over 19%, surpassing $2.0 billion in annual revenue for the first time; |
| • | Generated growth in core diluted earnings per share from continuing operations of 32% to $4.83, including the negative pretax impact from the NCR acquisition of $14.5 million or $0.28 per fully diluted share; |
| • | Drove $255.9 million in free cash flow from continuing operations while continuing to invest in our growth; and |
| • | Repurchased $139.7 million of our common stock reflecting our long-term belief in the company. |
Our deliberate execution on strategic initiatives, coupled with smart investments in our business, has strengthened our foundation while paving the way for future growth.
2012 Highlights
| • | In February, we announced our digital partnership with Verizon and in the fourth quarter Redbox Instant™ by Verizon launched its public beta; |
| • | We closed the NCR kiosk acquisition at the end of the second quarter and, by the end of the year, completed the replacement of the Blockbuster Express branded kiosks with Redbox kiosks in two premier retailers, Publix and Safeway; |
| • | Redbox signed studio agreements with Universal, Sony and Warner Bros. that provide great content for our Redbox consumers; |
| 1 | In discussing financial results, the comparisons we make will be 2012 versus 2011 and Q4 of 2012 versus Q4 of 2011, unless we state otherwise. |
©2013 Coinstar, Inc. All Rights Reserved. These materials may not be reproduced, altered or distributed without the express written consent of Coinstar, Inc.
Page 3
Coinstar, Inc. 2012 Fourth Quarter Earnings
February 7, 2013
Prepared Remarks from CEO Paul Davis and CFO J. Scott Di Valerio
| • | In August, Anne Saunders joined Redbox as president, focused on driving the next phase of growth; |
| • | We launched Redbox Tickets™ in Philadelphia in October, a unique offering enabling consumers to buy tickets to live events with only a $1.00 fee per ticket; |
| • | Our Coin business announced a successful test with PayPal giving consumers the opportunity to load coin and currency into their PayPal accounts or withdraw funds in the form of a cash voucher; |
| • | We announced an exclusive five-year agreement to roll out our Rubi™ coffee kiosks in the grocery, drug and mass merchant retail channels featuring Seattle’s Best Coffee® beverages; |
| • | We repurchased 2.8 million shares for a total of $139.7 million, demonstrating our confidence in the future of the company; |
| • | We ended 2012 with a strong balance sheet including over $282.9 million of cash and cash equivalents, of which $91.8 million relates to settling our accrued payable to retail partners for our Coin line of business; and |
| • | Coinstar was ranked 15th overall on Fortune Magazine’s “100 Fastest-Growing Companies” marking the third consecutive year that we have ranked in the top 100. |
Additional consolidated metrics for the full year include:
| • | Total CAPEX on a cash paid basis was $208.1 million; |
| • | Total net interest expense was $15.6 million, including $6.5 million of non-cash interest expense; and |
| • | The effective tax rate for continuing operations for the year was 37.9%. |
©2013 Coinstar, Inc. All Rights Reserved. These materials may not be reproduced, altered or distributed without the express written consent of Coinstar, Inc.
Page 4
Coinstar, Inc. 2012 Fourth Quarter Earnings
February 7, 2013
Prepared Remarks from CEO Paul Davis and CFO J. Scott Di Valerio
Q4 Consolidated Results
A summary of Coinstar, Inc.’s consolidated results for the fourth quarter ended December 31, 2012, follows:
| Consolidated revenue |
$ | 564.1 million | ||
| Net income |
$ | 22.9 million | ||
| Income from continuing operations |
$ | 22.9 million | ||
| Core adjusted EBITDA from continuing operations |
$ | 101.5 million | ||
| Diluted earnings per share from continuing operations |
$ | 0.75 | ||
| Core diluted EPS from continuing operations |
$ | 0.93 | ||
| Net cash flows from operating activities from continuing operations |
$ | 152.2 million | ||
| Free cash flow from continuing operations |
$ | 77.3 million |
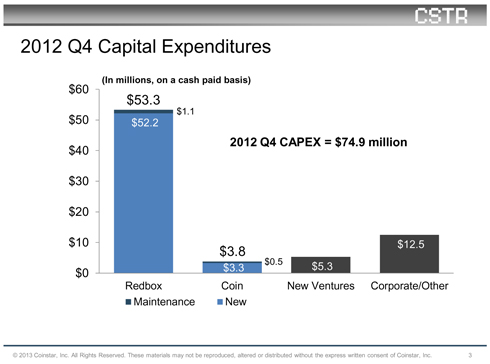
Total capital expenditures (CAPEX), on a cash paid basis, were $74.9 million and included the following components:
Total net interest expense for Q4 was $4.6 million including $1.9 million of non-cash interest expense.
©2013 Coinstar, Inc. All Rights Reserved. These materials may not be reproduced, altered or distributed without the express written consent of Coinstar, Inc.
Page 5
Coinstar, Inc. 2012 Fourth Quarter Earnings
February 7, 2013
Prepared Remarks from CEO Paul Davis and CFO J. Scott Di Valerio
Share Repurchase
In Q4 we repurchased $76.7 million of Coinstar common stock representing approximately 1.57 million shares at an average price of $48.71. The Q4 repurchase included $75 million through an accelerated stock repurchase agreement that took effect in December as well as other open market purchases. As of December 31, 2012, there was $133.6 million remaining under the Board’s stock repurchase authorization. On January 31, 2013, the Board approved an additional authorization of $250 million.
We consider stock buybacks an important component of our capital allocation strategy and repurchased an additional $45 million in 2013 under a 10b5-1 plan due to an attractive valuation. We intend to continue to be opportunistic in purchasing our shares at the appropriate price levels going forward.
During Q4 we also repurchased $15.0 million in face value of our outstanding convertible notes for $20.7 million, including accrued interest, in cash. Our reduced share price during the quarter provided an attractive opportunity to retire a portion of the notes, reducing both our total debt and the corresponding dilution from the convertible notes repurchased.
Redbox
Confidence in the U-shaped recovery
One of our priorities for the fourth quarter was ensuring the newest content was available for our consumers to increase the frequency of rentals and/or basket size of each transaction. As expected, the rebound from the poor content in Q3 built as we moved through the fourth quarter in a “U” shaped recovery. In Q4 Redbox kiosk rentals increased approximately 6% year over year and 7% sequentially from Q3. The corresponding average check was $2.57, an increase from $2.52 in Q3, but slightly lower than expected, driven by a slightly higher percentage of single night rentals that was the primary reason revenue came in below the midpoint of guidance. Our guidance for the first quarter and full year 2013 reflects the shape of the recovery in the fourth quarter, with the frequent renters trending back to their normal rental patterns and our expectations for continued progress with occasional renters through the year. This recovery and our strategic plans for the year gives us confidence that we will continue to grow rents by over 10% in 2013.
©2013 Coinstar, Inc. All Rights Reserved. These materials may not be reproduced, altered or distributed without the express written consent of Coinstar, Inc.
Page 6
Coinstar, Inc. 2012 Fourth Quarter Earnings
February 7, 2013
Prepared Remarks from CEO Paul Davis and CFO J. Scott Di Valerio
Redbox regained momentum in Q4
After facing unique and very challenging market conditions in Q3, Redbox improved performance on the DVD business compared with the prior year, posted impressive growth in Blu-ray, and improved profitability in video games.
In Q4 2012, Redbox revenue, including the NCR kiosks, grew 9.6% to $488.3 million despite lapping the price increase in October 2011.
For the same period, Redbox revenue, excluding the NCR kiosks, grew 8.3% to $482.8 million, reflecting:
| • | 187.9 million total rentals, up 7.5% from 174.8 million rentals in Q4 2011; and |
| • | Net revenue per rental of $2.57, a year over year increase of 2.0%. |
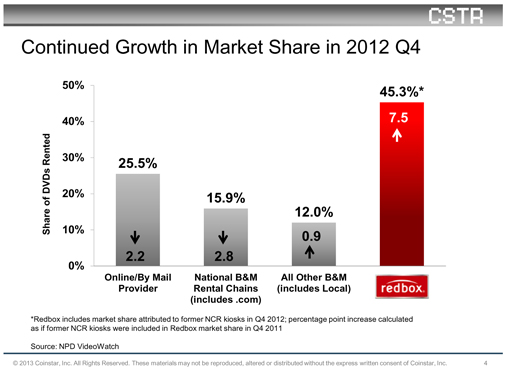
Redbox continued to gain share of the physical rental market in units, reaching 45.3% in Q4, up 7.5 share points compared with Q4 2011.
Redbox Q4 operating results include activity related to the NCR kiosks. Segment operating income was $80.0 million and operating margin was 16.4%, compared with 17.2% last year. Gross margin was 53.9%, down 1.0 percentage point year over year and 9.6 percentage points sequentially. As we discussed in October, we expected margins to be under pressure in Q4 and they were impacted by several factors:
| • | First, lower product margins for both NCR and Canadian kiosks were the primary drivers of year over year declines in gross margin; |
©2013 Coinstar, Inc. All Rights Reserved. These materials may not be reproduced, altered or distributed without the express written consent of Coinstar, Inc.
Page 7
Coinstar, Inc. 2012 Fourth Quarter Earnings
February 7, 2013
Prepared Remarks from CEO Paul Davis and CFO J. Scott Di Valerio
| • | Second, our intentional increase in copy depth to improve availability and rental conversion, as well as attract high frequency customers back to their normal rental pattern, had a negative impact on margins sequentially; |
| • | Third, the new content agreement with Warner Bros. included higher volumes of Warner Bros. product, which generates higher gross margin dollars, but at a lower overall gross margin percentage; and |
| • | Finally, the increase in Blu-ray content, which is also a positive for margin dollars has a negative impact on margin percentage. |
Impressive growth in Blu-ray
Our strategies to grow the Blu-ray mix have been successful, with continued customer demand across a broad slate of Blu-ray titles in Q4. Blu-ray represented 12.5% of Redbox revenue, an all-time high, and nearly twice the percentage in Q4 2011.
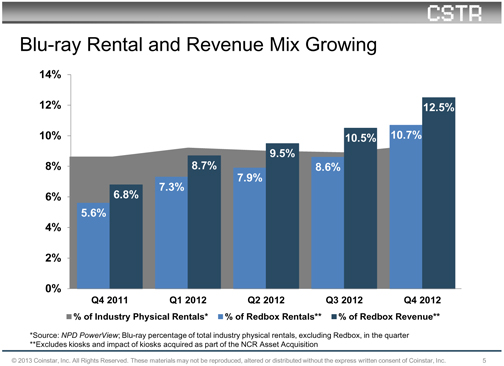
Blu-ray rentals as a percent of total Redbox rentals trended up throughout the year, peaking at 12.0% in December 2012 and accounting for 10.7% of total rentals in Q4, up from 8.6% in Q3 2012. For the first time, Redbox Blu-ray mix surpassed the Blu-ray physical rental industry average in the quarter. The Avengers and The Amazing Spider-Man provided strong evidence of Redbox customer demand for Blu-ray, with over 20% of the titles’ rents occurring on Blu-ray. Demand for Blu-ray extended beyond action films, with the format representing more than 18% of rentals among titles such as Dark Shadows and Brave.
©2013 Coinstar, Inc. All Rights Reserved. These materials may not be reproduced, altered or distributed without the express written consent of Coinstar, Inc.
Page 8
Coinstar, Inc. 2012 Fourth Quarter Earnings
February 7, 2013
Prepared Remarks from CEO Paul Davis and CFO J. Scott Di Valerio
Blu-ray is a key focus for future growth as we continue to increase the rental mix of Blu-ray in 2013, shifting rentals to this higher revenue and higher margin dollar format. Not only does Blu-ray provide a strong benefit to our business, but it also offers a better consumer experience due to superior picture and sound quality compared to other options such as VOD. A key to the expected increase in Blu-ray demand stems from higher Blu-ray player penetration. NPD reported a 20% increase in Blu-ray player sales during the 2012 Black Friday retail week compared with the prior-year period. New Media Measures reports that Blu-ray player penetration was higher among Redbox customers than the national population as of Q3 2012. We are uniquely positioned to take advantage of the increased acceptance of Blu-ray given our value price point and marketing assets, which we plan to further leverage to help consumers discover and explore the format.
Improved profitability in video games
The video game category capitalized on the strong title slate and reached its highest rental levels of the year in Q4. Video games represented 3.0% of rentals and 6.8% of revenue, above our expectations.
In 2012, we implemented a new video games merchandizing strategy to better align purchases with Redbox customer demand. Consequently, we were able to reduce product costs with minimal impact to revenue. The result was a significant improvement in product margin, which reached nearly 50% in the second half of the year.
Rebound in frequency of visits
One of the most positive trends in Q4 was a rebound in the frequency of visits, particularly among our highest frequency renters. As we have discussed, the difficult market environment in Q3 drove a decline in customer frequency, which led to customers falling out of their typical rental cycles. By the end of Q4, we recovered from the losses sustained in Q3 and the number of customers renting in cycle was trending at or above the number of customers renting in cycle leading into Q3. Among the customers renting in cycle in Q4, we saw the greatest customer volume increase in our highest frequency group. Additionally, among our in-cycle renters, spending per customer was up in Q4 compared with Q3. For our highest frequency renters, we grew spending per customer by approximately 5%. We are also pleased with the strong year over year growth of 9.8% in unique credit cards renting throughout the quarter.
©2013 Coinstar, Inc. All Rights Reserved. These materials may not be reproduced, altered or distributed without the express written consent of Coinstar, Inc.
Page 9
Coinstar, Inc. 2012 Fourth Quarter Earnings
February 7, 2013
Prepared Remarks from CEO Paul Davis and CFO J. Scott Di Valerio
We started to see a rebound in rentals beginning in October, with a very strong Redbox box office, including the release of The Avengers, driving rental performance during the month. A weaker November box office with fewer theatrical titles compared with Q4 2011 contributed to softer-than-expected rentals early in the month. Rentals rebounded again in late November as seasonality helped drive rentals during the Thanksgiving holiday period. December had a weaker box office compared with last year. However, in a strategy to grow total volume, we chose to increase copy depth on higher-demand titles, knowing it would pressure margins. The additional copies increased the number of units per kiosk and translated into a 7.6% increase in Redbox rentals in December compared with last year, enabling Redbox to finish the quarter strong.
Our continued investment in enhancing the customer experience in Web & Mobile resulted in a 28% increase in online visits in Q4 compared with a year ago. For 2012, we increased online visits by 37% and grew rentals through those channels by 15%.
Same store sales were down by 4% in Q4, reflecting lapping of the price increase implemented in Q4 2011 as well as the high level of net new installations. Redbox had approximately 8,300 net installs in 2012, with over 60%, or approximately 5,200 concentrated in the second half of 2012, including a record number of 3,900 in Q3. The ramping of these installs, particularly the swapped NCR kiosks, drove some short-term softening of rentals in the installed kiosk base in Q4, which we expect to continue into early 2013. However, these kiosks will help the business continue to grow through the approximately 1.3 million additional unique customers derived from these kiosks.
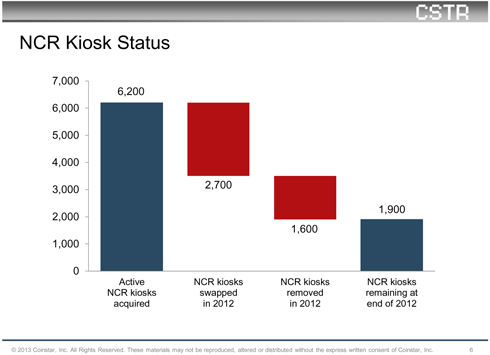
NCR kiosks
We continued executing our plans for the replacement and removal of former NCR kiosks and in Q4 replaced 500 NCR kiosks with Redbox kiosks and removed an additional 800 NCR kiosks, bringing total replacements to 2,700 and total removals to 1,600 in 2012. We ended the year with approximately 1,900 NCR kiosks in the market.
The acquired NCR kiosks active and operating during Q4 generated $5.6 million in revenue and an operating loss of $6.4 million, or $0.13 per diluted share, which was less than we previously guided to due to lower removal costs. The replacement Redbox kiosks are performing in line with other new installs.
©2013 Coinstar, Inc. All Rights Reserved. These materials may not be reproduced, altered or distributed without the express written consent of Coinstar, Inc.
Page 10
Coinstar, Inc. 2012 Fourth Quarter Earnings
February 7, 2013
Prepared Remarks from CEO Paul Davis and CFO J. Scott Di Valerio
Physical rentals remain strong
From an industry perspective, consumer spending on home entertainment rose for the first time in five years during 2012, totaling an estimated $18 billion according to the Digital Entertainment Group. While brick and mortar and subscription rentals continued to decline, kiosk rentals provided a bright spot with double digit growth. Looking forward, the Entertainment Merchants Association (EMA), which draws data from several sources, foresees a strong future for physical media, noting physical rental spending bottoming out in 2012 at $5.5 billion and then moderately growing from 2013 – 2016.
We believe that physical rentals are recognized as an important entertainment option for consumers and as a key source of revenue for the content providers.
Redbox 2012 operating results
Looking at the full year 2012, Redbox generated $1.9 billion in total revenue and hit nearly 2.6 billion cumulative lifetime rentals. The year over year revenue growth of 22.2% reflects:
| • | 2012 Redbox rentals, excluding NCR, of approximately 740 million, an increase of 7.8%; |
| • | According to NPD, Redbox’s rental increase was slightly above the year over year increase in movie rentals in both the digital streaming segment (SVOD & iVOD) and the TV VOD segment; and |
©2013 Coinstar, Inc. All Rights Reserved. These materials may not be reproduced, altered or distributed without the express written consent of Coinstar, Inc.
Page 11
Coinstar, Inc. 2012 Fourth Quarter Earnings
February 7, 2013
Prepared Remarks from CEO Paul Davis and CFO J. Scott Di Valerio
| • | Same store sales growth of 10.2% for the year, primarily driven by the price increase and strong Q1 2012 performance. |
Several key drivers contributed to Redbox growth in 2012:
| • | 11.3% more credit cards renting in 2012 compared with 2011; |
| • | 8.5% increase in spending per card; |
| • | Addition of approximately 8,300 kiosks in 2012, representing a 23% increase in kiosks with a large portion coming from NCR kiosk swaps; |
| • | Increased revenue per rental to $2.55 driven by a full year of the price increase on standard definition discs and a significant increase in Blu-ray mix, with Blu-ray share of total Redbox rentals up 4.4 points to 8.6% in 2012; and |
| • | Higher revenue per rental and increased product margin dollars for video games. |
Redbox 2012 accomplishments
Several major 2012 accomplishments position Redbox for further growth in 2013.
NCR Acquisition: We acquired certain assets of NCR’s self-service entertainment DVD kiosk business and quickly converted key strategic retailers Publix and Safeway to Redbox, expanding our ability to bring the value and convenience of Redbox to new retail partners and customers.
Redbox Instant™ by Verizon: In February 2012, Redbox and Verizon entered into a joint venture creating Redbox Instant by Verizon. Redbox Instant offers consumers a compelling subscription package that combines four DVD (or Blu-ray) rental nights of new release content at Redbox kiosks with a library of Hollywood hit movies available for unlimited streaming, including titles from Epix, Warner Bros. and Avail TVN.
Redbox Instant began an invitation-only beta in mid-December 2012, and plans to go fully live in Q1 2013. We now have tens of thousands of consumers using Redbox Instant in beta with hundreds of thousands more requesting access to beta. We continue to regulate invites to ensure our support infrastructure scales appropriately. We are getting good feedback on the product, experience and offering and will continue to add devices, content and more site features and functionalities.
The service is now available on web, tablet and mobile devices, including iOS®, Android™, Xbox 360, and Samsung® Blu-ray Players and TVs with SmartHub™. We have several other 10ft device clients, those that allow you to stream content on your TV, in various stages of development and certification.
©2013 Coinstar, Inc. All Rights Reserved. These materials may not be reproduced, altered or distributed without the express written consent of Coinstar, Inc.
Page 12
Coinstar, Inc. 2012 Fourth Quarter Earnings
February 7, 2013
Prepared Remarks from CEO Paul Davis and CFO J. Scott Di Valerio
Canada: Redbox expanded to Canada in 2012 and has established agreements with leading Canadian retailers, including Walmart, Safeway, Loblaw’s, and Shoppers Drug Mart. We finished the year with approximately 350 installs in Canada. Building brand awareness and establishing a critical kiosk mass are key objectives for 2013.
Redbox Tickets: Redbox Tickets, which sells tickets for live events and performances at face value plus a $1 service fee, launched a pilot program in Philadelphia in Q4 2012 and expanded to Los Angeles in late January. The business has shown encouraging signs as we prove out the model and consumer interest in the service.
Studio Agreements: Redbox signed a multi-year content-licensing agreement with Warner Bros. during Q4 to provide Blu-ray discs and DVD titles to kiosks 28 days after their retail release dates. Earlier in the year, we extended studio agreements with Sony and Universal allowing us to provide a wide selection of content to our consumers.
Redbox 2013 initiatives
We have confidence in the growth opportunity ahead of us and the following new growth initiatives in place for 2013:
Customer Focus: As we expect new kiosk installs to slow beginning in Q1 2013, with 500 to 1,000 U.S. installations planned for the year, we are building the foundation to drive growth by improving the experience for our existing customer base through personalization and a deeper customer relationship. While we expect this to help improve same store sales over the long term, the increased focus will be on driving average revenue per user through increased frequency and capturing a larger percentage of their entertainment spending. This will be accomplished through continued investments in CRM (customer relationship management) that will enable us to offer a more personalized customer experience creating better engagement and ultimately increasing per customer value. These enhancements are expected to be fully in place in the second half of 2013.
Network Optimization: We also plan to further optimize our installed network by redeploying underperforming kiosks to lower density or stronger performing areas. This will allow us to maximize rentals and kiosk productivity.
©2013 Coinstar, Inc. All Rights Reserved. These materials may not be reproduced, altered or distributed without the express written consent of Coinstar, Inc.
Page 13
Coinstar, Inc. 2012 Fourth Quarter Earnings
February 7, 2013
Prepared Remarks from CEO Paul Davis and CFO J. Scott Di Valerio
Kiosk Enhancement: We have developed a kiosk enhancement that will allow us to increase our capacity by more than 80 discs per kiosk, enabling us to provide a greater selection of titles to consumers and drive additional rents per kiosk. This improvement allows us to provide additional content at a lower cost since we are not installing a brand new kiosk nor purchasing additional content. From an inventory management perspective, we often remove discs from the kiosks that are still renting to make room for newer movies. This change will allow us to extend the life of content in the kiosk, increase in-stock levels and generate additional marginal revenue. We also believe this will allow us to generate a higher return on investment for shareholders. New kiosks in the second half of 2012 were manufactured with this enhancement and we will convert a significant percentage of the existing network throughout 2013.
Coin
In Q4, Coin revenue was $74.5 million, flat compared with Q4 2011, primarily due to flat worldwide same store sales growth and net negative installs in the U.S. Removals result from store closures and banner consolidation by non-Coinstar retailers and are typically older machines. Coin machine volumes grow over time so our new installs perform at lower volumes than our older units.
Q4 revenue reflects an average transaction size of $41.40, an increase of $1.08, which was offset by a lower number of transactions, which were down 1.9% to approximately 18.8 million.
Coin segment operating income was $26.3 million, compared with $25.7 million a year ago, and segment operating margin was 35.3%, up 80 basis points from Q4 2011, primarily due to effective cost control throughout the business. Direct operating expenses increased less than 1% reflecting higher revenue share expense and higher coin processing and transportation expense. The slight increase was offset by decreases in marketing expense due to lower advertising spend, and research and development due to higher capitalization of certain expenses related to software development.
We are pleased with the traction made in Coin’s gift card / eCert product in 2012, driven by strong partners such as Amazon, Lowe’s, iTunes, and Starbucks. We added five new, well-known partners in 2012: Dell, Marriott, Nike, Sears, and Xbox, increasing the average transaction size and providing a broader product assortment for consumers.
In Q4 our Coin business ran a “Pour 40 Get 50” promotion with iTunes, Dell and Old Navy. Through leveraging social media and relationships with branded partners and retailers, we drove twice the expected consumer participation and qualifying transactions. In January, we initiated a promotion at our Kroger locations that links Coinstar to Redbox. Consumers that cash in at least $5 for a no fee product at a Coinstar machine will receive a free one-day Redbox DVD rental and we are pleased with early results.
©2013 Coinstar, Inc. All Rights Reserved. These materials may not be reproduced, altered or distributed without the express written consent of Coinstar, Inc.
Page 14
Coinstar, Inc. 2012 Fourth Quarter Earnings
February 7, 2013
Prepared Remarks from CEO Paul Davis and CFO J. Scott Di Valerio
New Ventures
For Q4, our New Ventures segment generated $1.3 million in revenue and reported a segment operating loss of $7.2 million.
We continued to invest in R&D, direct operating expenses and marketing to support the launch of our Rubi coffee kiosks, the design and software development of new kiosks for our other concepts, and increased headcount and shared services expenses to support growth.
The rollout process for the Rubi coffee kiosks did not meet our forecast in Q4 as the finalization of the production kiosk shifted out several months. Our Rubi business continues to be a major area of focus and investment for the company and given the growth potential for the business, we are committed to getting it right. We continue to be pleased with the performance of the Rubi coffee kiosks we have in market. It is clearly a win with consumers and with our retail partners. Over the last quarter, we’ve seen increasing momentum with retailers leading to signed pilot and rollout agreements. We plan to accelerate the Rubi rollout in Q2, and believe there are thousands of locations to secure over the coming years to build a large and profitable business.
Beginning with 2013 we are moving our gift card exchange business, Alula, into our Coin business. We made this strategic shift given the overlap in technology and retailer footprint of these two businesses. While this will impact Coin margins in the coming year, we believe this has the potential to accelerate growth of the gift card exchange business, and as it becomes a natural extension of our Coin line of business, will provide attractive growth over the long term. Going forward, our investment in the gift card exchange business will be accounted for in our Coin segment.
Non-Core Results
For the full year 2012, our net investment in Redbox Instant by Verizon, our joint venture, was $25.8 million and our share of the start-up losses was $20.2 million.
©2013 Coinstar, Inc. All Rights Reserved. These materials may not be reproduced, altered or distributed without the express written consent of Coinstar, Inc.
Page 15
Coinstar, Inc. 2012 Fourth Quarter Earnings
February 7, 2013
Prepared Remarks from CEO Paul Davis and CFO J. Scott Di Valerio
2013 Q1 Guidance
Q1 2012 was an extraordinary quarter for Redbox in rentals and revenue, which makes year over year comparisons more challenging. Specifically we saw a 6.8% increase in unique credit cards in Q1 2012 over Q4 2011, which accounted for more than 2/3 of the growth in unique credit cards in 2012.
As previously discussed, we saw encouraging signs in the business in Q4 as our high frequency renters came back into cycle during the quarter. Despite this return to pre-Q3 levels, we did not reach Q1 2012 levels and expect improvement during the first half of the year as we build out many of the innovations to deepen our relationships with customers.
As new kiosk installs are reduced substantially in 2013 and beyond, our results will be driven by the content being released, our ability to attract consumers to that content and our effectiveness in capturing a higher percentage of their entertainment spending.
The release schedule in Q1 2013 begins slower than 2012 with fewer releases in January. Q1 2013 has an estimated total box office of $2.6 billion, including 40 titles with a box office greater than or equal to $5 million. Though the total box office for the quarter is in line with Q1 2012, a much larger share of the total box office last year came from titles released in January. January 2012 had 23 theatrical releases with a total box office of $1.4 billion, accounting for 50% of the Q1 box office. In contrast, January 2013 had just 12 theatrical releases with a total box office of $922 million, accounting for only 36% of Q1 box office.
The breakdown for Redbox kiosks by month is:
| • | 12 theatrical titles in January with total box office of approximately $900 million, including a good mix of strong titles spanning several genres such as Ted, a comedy, The Bourne Legacy, an action title, and Ice Age: Continental Drift and Hotel Transylvania, both family films. |
| • | 13 theatrical titles in February with total box office of approximately $500 million with Taken 2 the only title over $100 million. Flight and Here Comes the Boom should also be strong rental titles in February. |
| • | 15 theatrical titles in March with total box office of approximately $1.2 billion, with five titles exceeding $100 million box office and two titles, Twilight Breaking Dawn Part 2 and Skyfall, with box office greater than $250 million. We also expect Zero Dark Thirty to be a strong rental title. |
While winter months bring strong seasonality and we have a steady flow of product throughout Q1, January product depth was not as robust as last year and there was one week with no new titles. We do expect to maintain the strong Blu-ray rental activity we achieved in Q4 as we continue to ensure we have sufficient Blu-ray product to meet the increasing demand. We expect Blu-ray rentals to represent approximately 13% to 15% of Redbox revenue in Q1.
©2013 Coinstar, Inc. All Rights Reserved. These materials may not be reproduced, altered or distributed without the express written consent of Coinstar, Inc.
Page 16
Coinstar, Inc. 2012 Fourth Quarter Earnings
February 7, 2013
Prepared Remarks from CEO Paul Davis and CFO J. Scott Di Valerio
In Q1 we expect 14 new video game titles to be released, including 4 in January, 2 in February and 8 in March, compared with 15 new releases in Q1 2012. We expect video game rentals to represent approximately 4.0% to 5.0% of Redbox revenue in Q1, similar to 5% in Q1 2012, down from Q4 levels due to seasonally fewer new releases. The lower level of video game revenue sequentially reflects typical seasonality compared with the strong holiday slate of 21 new releases in Q4.
Profitability in Q1 and the first half will be impacted by several items as compared with 2012:
| • | In Q1 2012, we benefitted from special rates from debit card brands which lowered our interchange costs. Single billing introduced last year helps mitigate this impact but not fully. |
| • | We are increasing our core investments in Redbox Instant, Canada and Tickets which impact first half results but should help benefit the business in the second half of 2013. |
| • | We expect the impact of the operating results of the NCR kiosks in Q1 2013 on core diluted EPS from continuing operations to be approximately $6 million or $0.13 per diluted share compared with no impact in 2012. |
Depreciation will continue to increase this year based on the significant number of installs this past year at Redbox, the beta launch of Redbox Instant by Verizon, and continued investment in company infrastructure for ERP and investments in technology to support new initiatives.
©2013 Coinstar, Inc. All Rights Reserved. These materials may not be reproduced, altered or distributed without the express written consent of Coinstar, Inc.
Page 17
Coinstar, Inc. 2012 Fourth Quarter Earnings
February 7, 2013
Prepared Remarks from CEO Paul Davis and CFO J. Scott Di Valerio
We expect to complete the NCR kiosk replacement and removal process by the end of April. We are currently testing with a number of retailers to determine the best replacement locations. Our current expectation for replacements is included in our guidance for full year 2013 kiosk installations. We expect the transaction to be accretive this year.
We expect negative, low double-digit same store sales in Q1 due to the large number of installs in the second half of 2012, the content schedule relative to last year’s Q1 and the continuation of the U-shaped recovery from Q3 2012. We expect same store sales to improve each quarter throughout the year, reaching low to mid-single digits for the full year.
2013 Q1 Non-core
For Q1, non-core adjustments net of tax, including our share of the start-up losses of Redbox Instant by Verizon, are expected to be in the range of approximately $9 million to $11 million.
In addition, we plan to invest approximately $14 million in Redbox Instant by Verizon in Q1.
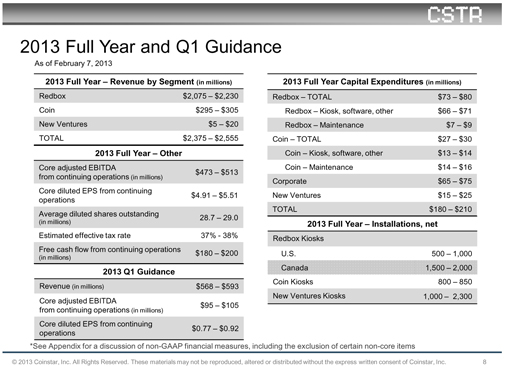
2013 Guidance
On a consolidated basis, we expect revenue and profitability to grow throughout the year. We expect Redbox revenue to grow 9% to 17% for the full year, with most of the growth coming in the second half of the year. We also expect revenue per kiosk to be in line with 2011 levels in the first half of the year. As we move into Q3, we expect revenue per kiosk to exceed 2012 levels. The innovations previously discussed, specifically the growth of Blu-ray, and the ramping of the kiosks installed in 2012 will help us achieve this growth. It is worth noting that Canada kiosks provide a drag on a per kiosk basis for the entire year as we begin to build out the business with additional installs.
In our Coin segment, we expect single digit revenue growth for the year. As previously discussed, Alula, our gift card exchange business, has moved from our New Ventures segment and will now be reported as part of the Coin line of business. We expect Alula will put pressure on margins for the year as we develop and test this concept.
In 2013 we will continue to invest in our New Ventures segment with the primary focus on the Rubi business executing the rollout of its kiosks. Our expectations for Rubi kiosk installations, which we plan to accelerate in Q2, are included in our New Ventures full year capital expenditures and kiosk guidance.
©2013 Coinstar, Inc. All Rights Reserved. These materials may not be reproduced, altered or distributed without the express written consent of Coinstar, Inc.
Page 18
Coinstar, Inc. 2012 Fourth Quarter Earnings
February 7, 2013
Prepared Remarks from CEO Paul Davis and CFO J. Scott Di Valerio
For 2013, we expect capital expenditures of $190 million to $210 million. Redbox capital expenditures have been significantly reduced due to lower kiosk installs with 500 to 1,000 U.S. net installs and 1,500 to 2,000 Canada net installs. In addition to kiosk installs we also plan to invest in software, kiosk enhancements and CRM in the coming year. In our Coin line of business, we expect 800 to 850 net installs and ongoing investment in our Alula business. Our corporate capital expenditures are targeted for continued development of infrastructure to support our lines of businesses as well as expenditures related to our New Ventures line of business.
Despite the lower capital expenditures, we expect free cash flow from continuing operations of $180 million to $200 million, which is lower than 2012. 2013 represents the first year in which we will pay federal cash taxes after exhausting the majority of NOLs that have provided a benefit to free cash flow the past few years. Our current estimate for 2013 cash taxes is in the range of $90 million to $105 million, including federal, state and foreign. We will continue to look for opportunities to reduce our cash taxes.
For the year, we expect average diluted shares in the range of 28.7 million and 29.0 million, which does not include the impact of any additional share repurchases we might execute in 2013.
2013 Non-Core
For 2013, non-core adjustments net of tax, including our share of the start-up losses of Redbox Instant by Verizon, are expected to be in the range of approximately $11 million to $16 million.
©2013 Coinstar, Inc. All Rights Reserved. These materials may not be reproduced, altered or distributed without the express written consent of Coinstar, Inc.
Page 19
Coinstar, Inc. 2012 Fourth Quarter Earnings
February 7, 2013
Prepared Remarks from CEO Paul Davis and CFO J. Scott Di Valerio
Summary
2012 was a year in which we focused on investing in the future of the company – including investing in our core businesses, new innovative kiosk concepts, new products, new partnerships, and expansion in Canada. We made significant progress on growth initiatives while we continued to drive the business and operational excellence that generates free cash flow and profitable growth. We are excited to move forward in 2013 as we continue to focus on delivering value to our customers, partners and shareholders.
©2013 Coinstar, Inc. All Rights Reserved. These materials may not be reproduced, altered or distributed without the express written consent of Coinstar, Inc.
Page 20
Coinstar, Inc. 2012 Fourth Quarter Earnings
February 7, 2013
Prepared Remarks from CEO Paul Davis and CFO J. Scott Di Valerio
APPENDIX A
Use of Non-GAAP Financial Measures
Non-GAAP measures may be provided as a complement to results provided in accordance with United States generally accepted accounting principles (“GAAP”).
We use the following non-GAAP financial measures to evaluate our financial results:
| • | Core adjusted EBITDA from continuing operations; |
| • | Core diluted earnings per share (“EPS”) from continuing operations; and |
| • | Free cash flow from continuing operations. |
These measures, the definitions of which are presented below, are non-GAAP because they exclude certain amounts which are included in the most directly comparable measure calculated and presented in accordance with GAAP. Our non-GAAP financial measures are not meant to be considered in isolation or as a substitute for our GAAP financial measures and may not be comparable with similarly titled measures of other companies.
Core and Non-Core Results
We distinguish our core activities, those associated with our primary operations, from non-core activities. Non-core activities are primarily nonrecurring events or events we do not control. Our non-core adjustments include i) deal fees primarily related to the NCR asset acquisition, ii) income or loss from equity method investments, which represents our share of income or loss from entities we do not consolidate or control, and iii) a gain on the grant of a license to use certain Redbox trademarks to Redbox Instant™ by Verizon (“Non-Core Adjustments”). We believe investors should consider our core results because they are more indicative of our ongoing performance and trends and are more consistent with how management evaluates our operational results and trends.
Core Adjusted EBITDA from Continuing Operations
Our non-GAAP financial measure core adjusted EBITDA from continuing operations is defined as earnings before depreciation, amortization and other; interest expense, net; income taxes; share-based payments expense; and Non-Core Adjustments.
A reconciliation of core adjusted EBITDA from continuing operations to income from continuing operations, the most comparable GAAP financial measure, is presented in the following table:
| Three Months Ended | Twelve Months Ended | |||||||||||||||
| December 31, | December 31, | |||||||||||||||
| Dollars in thousands |
2012 | 2011 | 2012 | 2011 | ||||||||||||
| Income from continuing operations |
$ | 22,885 | $ | 31,522 | $ | 150,230 | $ | 114,951 | ||||||||
| Depreciation, amortization, and other |
47,616 | 39,245 | 184,525 | 148,218 | ||||||||||||
| Interest expense, net |
4,615 | 4,944 | 15,648 | 23,822 | ||||||||||||
| Income taxes |
10,908 | 17,862 | 91,516 | 69,777 | ||||||||||||
| Share-based payments expense(1) |
6,218 | 6,849 | 19,362 | 16,211 | ||||||||||||
|
|
|
|
|
|
|
|
|
|||||||||
| Adjusted EBITDA from continuing operations |
92,242 | 100,422 | 461,281 | 372,979 | ||||||||||||
| Non-core adjustments: |
||||||||||||||||
| Deal fees |
— | 1,122 | 3,235 | 1,603 | ||||||||||||
| Loss from equity method investments |
9,278 | 711 | 24,684 | 1,591 | ||||||||||||
| Gain on formation of Redbox Instant by Verizon |
— | — | (19,500 | ) | — | |||||||||||
|
|
|
|
|
|
|
|
|
|||||||||
| Core Adjusted EBITDA from continuing operations |
$ | 101,520 | $ | 102,255 | $ | 469,700 | $ | 376,173 | ||||||||
|
|
|
|
|
|
|
|
|
|||||||||
| (1) | Includes non-cash share-based compensation for executives, non-employee directors and employees as well as share-based payments for content arrangements. |
©2013 Coinstar, Inc. All Rights Reserved. These materials may not be reproduced, altered or distributed without the express written consent of Coinstar, Inc.
Page 21
Coinstar, Inc. 2012 Fourth Quarter Earnings
February 7, 2013
Prepared Remarks from CEO Paul Davis and CFO J. Scott Di Valerio
Core Diluted EPS from Continuing Operations
Our non-GAAP financial measure core diluted EPS from continuing operations is defined as diluted earnings per share from continuing operations excluding Non-Core Adjustments, net of applicable taxes.
A reconciliation of core diluted EPS from continuing operations to diluted EPS from continuing operations, the most comparable GAAP financial measure, is presented in the following table:
| Three Months Ended | Twelve Months Ended | |||||||||||||||
| December 31, | December 31, | |||||||||||||||
| 2012 | 2011 | 2012 | 2011 | |||||||||||||
| Diluted EPS from continuing operations |
$ | 0.75 | $ | 1.00 | $ | 4.67 | $ | 3.61 | ||||||||
| Non-core adjustments, net of tax:(1) |
||||||||||||||||
| Deal fees |
— | 0.02 | 0.06 | 0.03 | ||||||||||||
| Loss from equity method investments |
0.18 | 0.01 | 0.48 | 0.03 | ||||||||||||
| Gain on formation of Redbox Instant by Verizon |
— | — | (0.38 | ) | — | |||||||||||
|
|
|
|
|
|
|
|
|
|||||||||
| Core diluted EPS from continuing operations |
$ | 0.93 | $ | 1.03 | $ | 4.83 | $ | 3.67 | ||||||||
|
|
|
|
|
|
|
|
|
|||||||||
| (1) | Non-Core Adjustments are presented after-tax using the applicable effective tax rate for the respective periods. |
Free Cash Flow from Continuing Operations
Our non-GAAP financial measure free cash flow from continuing operations is defined as net cash provided by operating activities from continuing operations after capital expenditures. We believe free cash flow from continuing operations is an important non-GAAP measure as it provides additional information to users of the financial statements regarding our ability to service, incur or pay down indebtedness and repurchase our common stock. The table below provides a reconciliation of net cash provided by operating activities from continuing operations, the most comparable GAAP financial measure, to free cash flow from continuing operations:
| Three Months Ended | Twelve Months Ended | |||||||||||||||
| December 31, | December 31, | |||||||||||||||
| Dollars in thousands |
2012 | 2011 | 2012 | 2011 | ||||||||||||
| Net cash provided by operating activities from continuing operations |
$ | 152,212 | $ | 144,877 | $ | 463,906 | $ | 406,516 | ||||||||
| Purchase of property and equipment |
(74,873 | ) | (44,457 | ) | (208,054 | ) | (179,236 | ) | ||||||||
|
|
|
|
|
|
|
|
|
|||||||||
| Free cash flow from continuing operations |
$ | 77,339 | $ | 100,420 | $ | 255,852 | $ | 227,280 | ||||||||
|
|
|
|
|
|
|
|
|
|||||||||
©2013 Coinstar, Inc. All Rights Reserved. These materials may not be reproduced, altered or distributed without the express written consent of Coinstar, Inc.
Page 22