Attached files
| file | filename |
|---|---|
| 8-K - FORM 8-K - Bridge Capital Holdings | v334202_8k.htm |
Daniel P. Myers President Chief Executive Officer Director Thomas A. Sa Executive Vice President Chief Financial Officer Chief Strategy Officer Investor Update 4 th Quarter 2012 B R I D G E C A P I T A L H O L D I N G S NASDAQ: BBNK WWW.BRIDGECAPITALHOLDINGS.COM

Forward Looking Statements Certain matters discussed herein constitute forward - looking statements within the meaning of the Private Securities Litigation Reform Act of 1995, and are subject to the safe harbors created by that Act. Forward - looking statements describe future plans, strategies, and expectations, and are based on currently available information, expectations, assumptions, projections, and management's judgment about the Bank, the banking industry and general economic conditions. These forward looking statements are subject to certain risks and uncertainties that could cause the actual results, performance or achievements to differ materially from those expressed, suggested or implied by the forward looking statements. These risks and uncertainties include, but are not limited to: (1) competitive pressures in the banking industry; (2) changes in interest rate environment; (3) general economic conditions, nationally, regionally, and in operating markets; (4) changes in the regulatory environment; (5) changes in business conditions and inflation; (6) changes in securities markets; (7) future credit loss experience; (8) the ability to satisfy requirements related to the Sarbanes - Oxley Act and other regulation on internal control; (9) civil disturbances or terrorist threats or acts, or apprehension about the possible future occurrences of acts of this type; and (10) the involvement of the United States in war or other hostilities. The reader should refer to the more complete discussion of such risks in Bridge Capital Holdings reports on Forms 10 - K and 10 - Q on file with the SEC. 2

■ Total Assets $ 1.3 billion ■ Total Loans $ 908.6 m illion ■ Total Deposits $ 1.2 billion ■ Total Stockholders' Equity $ 146.1 million ■ Market Cap $ 247.0 million ■ TBV/Share $ 9.32 ■ TCE/TA 10.92% ■ Tier 1 RBC Ratio 13.98% ■ Total RBC Ratio 15.23% ■ Cost of Deposits 11 bps ■ Net Interest Margin 5.27% ■ Efficiency Ratio 62.81% ■ ROAA 1.14% ■ ROAE 9.98% ■ Net Income $ 13.8 million ■ EPS $ 0 .92 Financial Highlights 3 Balance sheet data at FYE 2012; operating data FY 2012

Bridge Bank Franchise ▪ True Business Bank ; 70% C & I Lending ; 63% DDA ▪ Operating in attractive markets ▪ Full range of corporate banking products delivered through experienced advisors ▪ Core funding - driven approach to building the business ▪ 2 regional business centers + 5 business offices ▪ Effective use of banking technology ▪ Experienced management team ▪ Disciplined execution of our business plan 4

Core Market: Silicon Valley* REGIONAL OFFICES • San Jose (HQ) • Palo Alto (branch) BUSINESS OFFICES • East Bay (C&I) • San Francisco (C&I/tech/BCFG) • Dallas, TX (tech/BCFG) • Reston, VA (tech/BCFG) • Boston, MA (tech/BCFG) * Silicon Valley Region = Santa Clara, San Mateo, San Francisco, and Alameda Counties 1 San Jose/Silicon Valley Chamber of Commerce January 2011 2 US Census/HUD CRA/HMDA Report 2010 (most recent available) 3 FDIC data at June 30, 2012 4 National Venture Capital Association/PricewaterhouseCoopers Money Tree Survey as of December 31, 2012 5 CA Employment Development Department Q3 2010 data (most recent available) 5 ▪ San Jose 10th largest US city 1 ▪ 5 million regional population ▪ Among highest median family and per capita incomes in US 2 ▪ $327 billion deposit market 3 ▪ Largest concentration of technology company formation and finance in the world 1 ; Silicon Valley received 41% of US venture capital investment ($10.9b of $26.5b, (FY ‘12) 4 ; 192k HQ businesses 5

Attractive Market Potential 41.98% 18.47% 6.62% 4.86% 4.03% 2.44% 2.12% 1.98% 1.43% 1.02% 0.31% 0.30% 0% 5% 10% 15% 20% 25% 30% 35% 40% 45% BofA Wells Citibank SVB Chase Union Comerica B of West US Bank East West Heritage % Deposits Santa Clara , San Mateo , San Francisco and Alameda Counties * ; San Jose 10 th largest US city 1 ; 5 million regional population ; Among highest median family and per capita incomes in US 2 ; $327 billion deposit market 3 ; Largest concentration of technology company formation and finance in the world 1 ; Silicon Valley received 41% of US venture capital investment ($10.9b of $26.5b, (FY ‘12) 4 6 1 San Jose/Silicon Valley Chamber of Commerce January 2011 2 US Census/HUD CRA/HMDA Report 2010 3 FDIC data at June 30, 2012 4 PricewaterhouseCoopers Money Tree Survey as of December 31, 2012

Strong Value Proposition 7
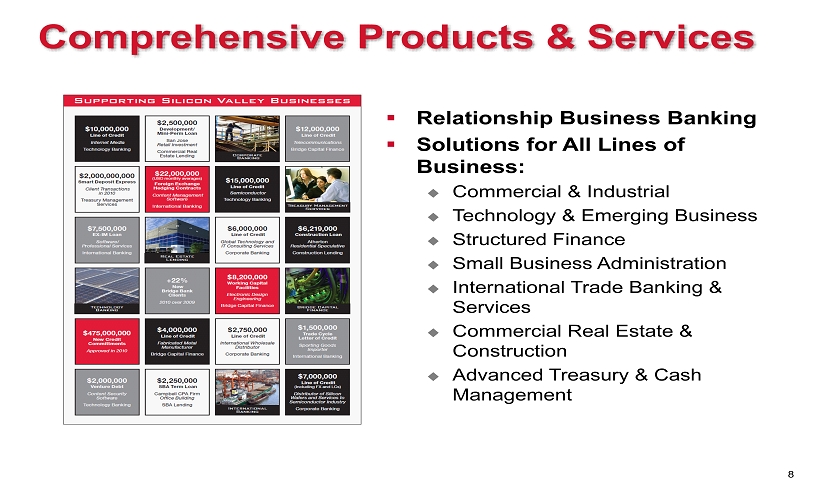
Comprehensive Products & Services ▪ Relationship Business Banking ▪ Solutions for All Lines of Business: ; Commercial & Industrial ; Technology & Emerging Business ; Structured Finance ; Small Business Administration ; I nternational Trade Banking & Services ; Commercial Real Estate & Construction ; Advanced Treasury & Cash Management 8

BBNK 2012 Summary ▪ Robust new client acquisition ▪ Increasing revenue and earnings ; Revenue +26% ; Net Income $13.8 million, +80% ; FY ’12 EPS $0.92, +77% ▪ Improved balance sheet leverage ; +16% deposit growth (YoY, avg ) ; +25% loan growth (YoY, avg ) ▪ Consistent high quality funding base ; 96% core ; 63% DDA ; 11 bps cost of deposits ▪ Strong asset quality ; NPAs reduced to 0.75% of total assets ▪ Exceptionally well capitalized ; TCE of 10.92% 9

Expanding Market Presence $250 $500 $750 $1,000 $1,250 $1,500 2005 2006 2007 2008 2009 2010 2011 2012 $ Millions Average Total Assets ; Purely organic growth ; Core deposit driven $1.34b total assets EOP Q4 ’12 10

Focus on Core Deposits 40% 31% 30% 34% 47% 52% 67% 62% $0 $250 $500 $750 $1,000 $1,250 2005 2006 2007 2008 2009 2010 2011 2012 $ Millions (EOP) Deposit Mix Noninterest-bearing Demand MM / IBD Certificates of Deposit ; 96% core deposits ; Cost of deposits ♦ 11 bps 11

SBA 9% CRE 14% Construction 4% Land 1% Other 2% C&I 26% Tech 22% ABL/F ** 22% Business C&I 70% Loans as of 12 - 31 - 12 True Business Focus BBNK % RE = 30% (70% Business) Peer* % RE = 80% (20% Business) * Peer – SNL Data: US Public Banks $500M - $1.5b Total Assets as of September 30, 2012 ** Asset - based lending / Factoring 12 >3x

Source: SNL Data: US Public Banks $500M - $1.5b Total Assets as of September 30, 2012 13 True C & I Focus Company Name C&I Loans ($000) Total Loans & Leases Rank 2012Q3 2012Q3 1 Bridge Bank, National Association 600,052 877,040 2 Green Bank, National Association 534,061 1,166,723 3 Transportation Alliance Bank, Inc. 483,878 625,057 4 Western National Bank 418,967 677,495 5 Medallion Bank 391,591 666,331 6 Pitney Bowes Bank, Inc. 360,477 369,347 7 Village Bank & Trust 340,476 707,487 8 Preferred Bank 339,686 1,073,085 9 Stearns Bank National Association 324,428 1,069,811 10 Heritage Bank of Commerce 320,640 800,869 11 First Bank of Highland Park 316,101 795,446 12 Pacific Continental Bank 303,443 836,933 13 Libertyville Bank & Trust Company 303,025 918,483 14 Commerce Bank of Washington, NA 290,533 559,518 15 Atlantic Capital Bank 272,975 764,724 16 1st Constitution Bank 271,405 519,740 17 Patriot Bank 268,123 858,549 18 Seaside National Bank & Trust 265,285 575,173 19 Brand Bank 264,777 1,068,539 20 Meridian Bank, National Association 260,991 430,425 21 MidSouth Bank, National Association 258,339 808,833 22 Anchor Bank, National Association 249,904 962,458 23 Mercantile Bank of Michigan 248,704 1,035,288 24 CapStar Bank 247,800 570,377 25 Sovereign Bank 246,805 592,835

2.00% 3.00% 4.00% 5.00% 6.00% 7.00% 8.00% 2005 2006 2007 2008 2009 2010 2011 2012 Net Interest Margin BBNK BAC WFC CMA SIVB HTBK High Value Business Peer* Average 3.87% BBNK: 5.27% 14 *= Peer – SNL Data: US Public Banks $500M - $1.5b Total Assets as of September 30, 2012

$- $10 $20 $30 $40 $50 $60 $70 $80 2005 2006 2007 2008 2009 2010 2011 2012 $MM Improving Operating Leverage REVENUE Non - Interest Expense 15 * (annualized)
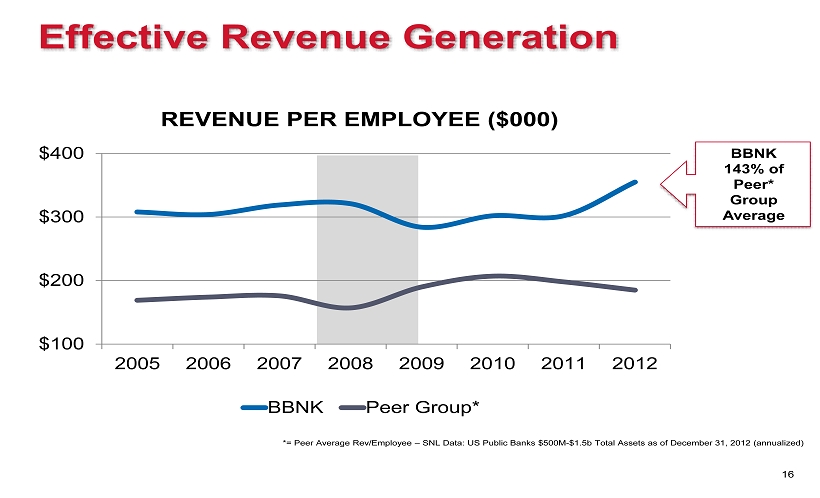
$100 $200 $300 $400 2005 2006 2007 2008 2009 2010 2011 2012 REVENUE PER EMPLOYEE ($000) BBNK Peer Group* Effective Revenue Generation *= Peer Average Rev/Employee – SNL Data: US Public Banks $500M - $1.5b Total Assets as of December 31, 2012 (annualized) BBNK 143% of Peer* Group Average 16

Strong Credit Quality 0% 1% 2% 3% 4% 5% Q3 '08 Q4 '08 Q1 '09 Q2 '09 Q3 '09 Q4 '09 Q1 '10 Q2 '10 Q3 '10 Q4 '10 Q1 '11 Q2 '11 Q3 '11 Q4 '11 Q1 '12 Q2 '12 Q3 '12 Q4 '12 NPL/Total Loans NPA/Total Assets Peer* Average NPA/Assets 3.48% *= Peer – SNL Data: US Public Banks $500M - $1.5b Total Assets as of September 30, 2012 17

$(5) $- $5 $10 $15 $20 $25 $30 $35 -0.5% 0.0% 0.5% 1.0% 1.5% 2.0% 2.5% 3.0% 3.5% Provision NCO/Total Loans (%) ** ALLLR/Loans (%) Provision ($) Holding Robust Reserves as Credit Stress Eases 2.20% * Peer – SNL Data: US Public Banks $500M - $1.5b Total Assets as of September 30, 2012 18 $0 Peer* Average 1.99%

Improved Earnings Potential $(7,341) $1,505 $3,037 $5,725 $8,634 $10,866 $ 1,435 $2,591 $ 7,847 $13,804 2003 2004 2005 2006 2007 2008 2009 2010 2011 2012 19 Preferred Dividends ’09: $4,203 ‘10 :$ 1,955 ’11: $200 ($000) *Operating profit before payment of preferred dividends

Capital for Growth and Opportunity * Peer – SNL Data: US Public Banks $500M - $1.5b Total Assets as of September 30, 2012 TCE Ratio Leverage Total RBC Regulatory Minimum 5.00% 10.00% Peer* 8.75% 10.19% 16.04% BBNK 10.92% 12.50% 15.23% 0% 5% 10% 15% 20% As of December 31, 2012 20

Catalysts for Earnings Growth ▪ Continued organic balance sheet growth ▪ Utilization rates on LOC at low ebb ; Utilization currently in the mid 30% range, well below historical levels ▪ NIM expansion ; Will benefit from asset sensitivity when rates rise ▪ Lower levels of credit stress ; Normalizing of credit costs ▪ Noninterest income opportunities 21

Maintain COMPETITIVE Value Proposition Attract and ACQUIRE NEW CLIENTS Generate CORE DEPOSIT Balances LEND to Creditworthy Borrowers Maintain EXCELLENT ASSET QUALITY Aggressively MANAGE EXPENSES Leverage CAPITAL FOR GROWTH FOCUS ON BU SINESS BANKING Markets and Lines of Business We Know Well Straightforward Growth Strategy 22

Contact Information Investor Relations Contact Thomas A. Sa Bridge Capital Holdings 55 Almaden Blvd., Suite 100 San Jose, CA 95113 (408) 423 - 8500 ir@bridgebank.com 23