Attached files
| file | filename |
|---|---|
| 8-K - FORM 8-K - BioMed Realty Trust Inc | d481682d8k.htm |
| EX-99.1 - PRESS RELEASE ISSUED BY BIOMED REALTY TRUST, INC. - BioMed Realty Trust Inc | d481682dex991.htm |
Exhibit 99.2

SUPPLEMENTAL OPERATING AND FINANCIAL DATA
DECEMBER 31, 2012
| BioMed Realty Trust, Inc. | Corporate Communications Contact | www.biomedrealty.com | ||
| 17190 Bernardo Center Drive | Rick Howe | (858) 485-9840 phone | ||
| San Diego, CA 92128 | Senior Director, Corporate Communications | (858) 485-9843 fax | ||
| richard.howe@biomedrealty.com |

TABLE OF CONTENTS
DECEMBER 31, 2012
| Page |
Page |
|||||||||
| Fourth Quarter Highlights |
3 | Common and Preferred Stock Data | 20 | |||||||
| Investor Information |
4 | Market Summary | 21 | |||||||
| Equity Research Coverage |
5 | Property Listing - Consolidated Portfolio | 22-23 | |||||||
| Financial and Operating Highlights |
6 | Redevelopment, Pre-development and Other | ||||||||
| Capitalization Summary |
7 | Capital Improvements | 24 | |||||||
| Portfolio Summary |
8 | Capital Expenditures | 25 | |||||||
| Consolidated Balance Sheets |
9 | Property Listing - Unconsolidated Partnerships | 26 | |||||||
| Consolidated Statements of Operations |
10 | Lease Expirations | 27 | |||||||
| Balance Sheet / Operations Statement Detail |
11 | Expirations by Market | 28 | |||||||
| FFO, CFFO and AFFO |
12 | 10 Largest Tenants | 29 | |||||||
| FFO, CFFO and AFFO per Share |
13 | Same Property Analysis | 30 | |||||||
| Reconciliation of EBITDA and Adjusted EBITDA |
14 | Acquisitions / Dispositions | 31 | |||||||
| Reconciliation of Net Operating Income |
15 | Leasing Activity | 32 | |||||||
| Interest Expense |
16 | Tenant Improvements, Leasing Commissions | ||||||||
| Coverage Ratios |
17 | and Tenant Concessions | 33 | |||||||
| Debt Summary |
18 | Non-GAAP Financial Measure Definitions | 34 | |||||||
| Debt Maturities |
19 | Definitions | 35 | |||||||
This Supplemental Operating and Financial Data package contains forward-looking statements within the meaning of the Private Securities Litigation Reform Act of 1995 based on current expectations, forecasts and assumptions that involve risks and uncertainties that could cause actual outcomes and results to differ materially. These risks and uncertainties include, without limitation: general risks affecting the real estate industry (including, without limitation, the inability to enter into or renew leases, dependence on tenants’ financial condition, and competition from other developers, owners and operators of real estate); adverse economic or real estate developments in the life science industry or the company’s target markets; risks associated with the availability and terms of financing, the use of debt to fund acquisitions, developments and other investments, and the ability to refinance indebtedness as it comes due; failure to maintain the company’s investment grade credit ratings with the ratings agencies; failure to manage effectively the company’s growth and expansion into new markets, or to complete or integrate acquisitions and developments successfully; reductions in asset valuations and related impairment charges; risks and uncertainties affecting property development and construction; risks associated with downturns in foreign, domestic and local economies, changes in interest rates and foreign currency exchange rates, and volatility in the securities markets; ownership of properties outside of the United States that subject the company to different and potentially greater risks than those associated with the company’s domestic operations; risks associated with the company’s investments in loans, including borrower defaults and potential principal losses; potential liability for uninsured losses and environmental contamination; risks associated with the company’s potential failure to qualify as a REIT under the Internal Revenue Code of 1986, as amended, and possible adverse changes in tax and environmental laws; and risks associated with the company’s dependence on key personnel whose continued service is not guaranteed. For a further list and description of such risks and uncertainties, see the reports filed by the company with the Securities and Exchange Commission, including the company’s most recent annual report on Form 10-K and quarterly reports on Form 10-Q. The company disclaims any intention or obligation to update or revise any forward-looking statements, whether as a result of new information, future events or otherwise.
All amounts shown in this report are unaudited.
This Supplemental Operating and Financial Data package is not an offer to sell or solicitation to buy securities of BioMed Realty Trust, Inc. Any offers to sell or solicitations to buy securities of BioMed Realty Trust, Inc. shall be made only by means of a prospectus approved for that purpose.
2
FOURTH QUARTER HIGHLIGHTS
DECEMBER 31, 2012
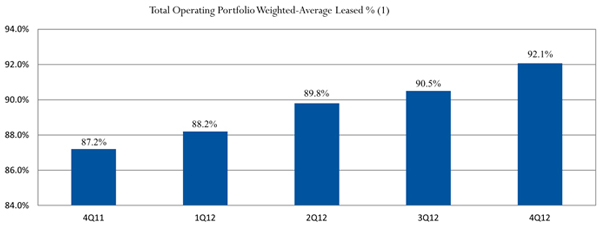
| • | Executed 30 leasing transactions during the quarter representing approximately 624,900 square feet, driving the total operating portfolio leased percentage on a weighted-average basis to approximately 92.1% at quarter end, comprised of: |
| • | 13 new leases totaling approximately 256,600 square feet, highlighted by: |
| • | a lease expansion with Ironwood Pharmaceuticals, Inc. for 93,000 square feet at the company’s 301 Binney Street property in Cambridge, Massachusetts; and |
| • | a lease expansion with Regeneron Pharmaceuticals, Inc. for an additional approximately 80,500 square feet at The Landmark at Eastview campus in Tarrytown, New York. |
| • | 17 lease renewals totaling approximately 368,300 square feet, highlighted by: |
| • | a lease extension with Ironwood Pharmaceuticals, Inc. for the balance of the approximately 210,300 square feet currently leased at the 301 Binney Street property through January 31, 2018; and |
| • | a lease extension with NuGen Technologies, Inc. for approximately 47,900 square feet at the company’s Industrial Road property in San Carlos, California. |
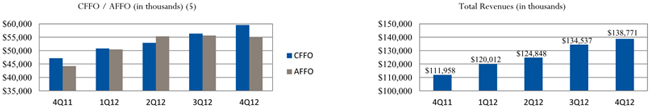
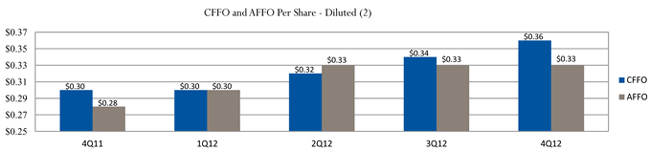
| • | Increased funds from operations (FFO) for the quarter by 20.0% to $0.36 per diluted share, as compared to $0.30 per diluted share in the fourth quarter of 2011. |
| • | Increased adjusted funds from operations (AFFO) for the quarter by 17.9% to $0.33 per diluted share, as compared to $0.28 per diluted share in the fourth quarter of 2011. |
| • | Increased same property net operating income on a cash basis for the period by 6.1% and the same property leased percentage increased by 5.7% as compared to the same period in 2011. |
| • | Generated total revenues for the quarter of $138.8 million, up 23.9% from $112.0 million in the same period in 2011 and the highest in the company’s history. Rental revenues for the quarter increased by 22.5% to $104.0 million from $84.9 million in the same period in 2011, the highest in the company’s history. |
| • | Reported net income available to common stockholders for the quarter of $4.5 million, or $0.03 per diluted share. |
About Biomed Realty Trust
BioMed Realty delivers optimal real estate solutions for biotechnology and pharmaceutical companies, scientific research institutions, government agencies and other entities involved in the life science industry. BioMed Realty owns or has interests in properties comprising approximately 13.1 million rentable square feet. The company’s properties are located predominantly in the major U.S. life science markets of Boston, San Francisco, Maryland, San Diego, New York/New Jersey, Pennsylvania and Seattle, which have well-established reputations as centers for scientific research. Additional information is available at www.biomedrealty.com.
3
INVESTOR INFORMATION
DECEMBER 31, 2012
| Company Information | ||||||
| Corporate Headquarters | Trading Symbols | Transfer Agent | Stock Exchange Listing | |||
| 17190 Bernardo Center Drive | BMR | Computershare Shareowner Services LLC | New York Stock Exchange | |||
| San Diego, CA 92128 | BMR PrA | 480 Washington Boulevard | ||||
| (858) 485-9840 | Jersey City, NJ 07310-1900 | |||||
| (858) 485-9843 (fax) | (877) 296-3711 | |||||
| Please visit our corporate website at: | www.biomedrealty.com | |||||
| Board of Directors |
Senior Management |
|
| |||
| Alan D. Gold | Alan D. Gold | Karen A. Sztraicher | Bruce D. Steel | |||
| Chairman | Chairman and | Executive Vice President, | Managing Director, | |||
| Daniel M. Bradbury | Chief Executive Officer | Asset Management | BioMed Ventures | |||
| Barbara R. Cambon | R. Kent Griffin, Jr. | Jonathan P. Klassen | Stephen A. Willey | |||
| Edward A. Dennis, Ph.D. | President and | Senior Vice President, | Vice President, | |||
| Richard I. Gilchrist | Chief Operating Officer | General Counsel and Secretary | Chief Accounting Officer | |||
| Gary A. Kreitzer | Gary A. Kreitzer | John P. Bonanno | Janice L. Kameir | |||
| Theodore D. Roth | Executive Vice President, | Senior Vice President, | Vice President, Human Resources | |||
| M. Faye Wilson | Director | Leasing & Development | Robert M. Sistek | |||
| Matthew G. McDevitt | Kevin M. Simonsen | Vice President, Finance | ||||
| Executive Vice President, | Vice President, | William F. X. Kane | ||||
| Real Estate | Real Estate Counsel | Vice President, | ||||
| Greg N. Lubushkin | Leasing & Development | |||||
| Chief Financial Officer | ||||||
| Tentative Schedule for Quarterly Results | ||||||
| First Quarter 2013 | May 2, 2013 | |||||
| Second Quarter 2013 | August 1, 2013 | |||||
| Third Quarter 2013 | October 31, 2013 | |||||
| Fourth Quarter 2013 | February 6, 2014 | |||||
4
EQUITY RESEARCH COVERAGE
DECEMBER 31, 2012
| BMO Capital Markets |
Richard C. Anderson Joshua Patinkin |
(212) 885-4180 (212) 883-5102 |
richard.anderson@bmo.com joshua.patinkin@bmo.com | |||
| Cantor Fitzgerald |
David Toti Evan Smith |
(212) 915-1219 (212) 915-1220 |
dtoti@cantor.com evan.smith@cantor.com | |||
| Cowen and Company |
James Sullivan Michael Gorman |
(646) 562-1380 (646) 562-1381 |
james.sullivan@cowen.com michael.gorman@cowen.com | |||
| Goldman Sachs |
Matthew Rand Andrew Rosivach |
(212) 902-4227 (212) 902-2796 |
matthew.rand@gs.com andrew.rosivach@gs.com | |||
| Green Street Advisors |
Jeff Theiler John Hornbeak |
(949) 640-8780 |
jtheiler@greenst.com jhornbeak@greenst.com | |||
| Jefferies & Co. |
Omotayo Okusanya David Shamis |
(212) 336-7076 (212) 284-1796 |
tokusanya@jefferies.com dshamis@jefferies.com | |||
| KeyBanc Capital Markets |
Jordan Sadler Craig Mailman |
(917) 368-2280 (917) 368-2316 |
jsadler@keybanccm.com cmailman@keybanccm.com | |||
| Macquarie Capital (USA) |
Robert Stevenson Nicholas Yulico |
(212) 231-8068 (212) 231-8028 |
rob.stevenson@macquarie.com nicholas.yulico@macquarie.com | |||
| Morgan Stanley |
Paul Morgan Vance H. Edelson |
(415) 576-2627 (212) 761-0078 |
paul.b.morgan@morganstanley.com vance.edelson@morganstanley.com | |||
| Raymond James |
Paul D. Puryear William A. Crow |
(727) 567-2253 (727) 567-5294 |
paul.puryear@raymondjames.com bill.crow@raymondjames.com | |||
| Robert W. Baird & Co. |
Mathew R. Spencer |
(414) 298-5053 |
mspencer@rwbaird.com | |||
| Stifel, Nicolaus & Company, Inc. |
Daniel Bernstein Seth P. Cohn |
(443) 224-1351 (443) 224-1354 |
bernsted@stifel.com cohns@stifel.com | |||
| UBS Securities |
Ross T. Nussbaum |
(212) 713-4760 |
ross.nussbaum@ubs.com | |||
| Wells Fargo Securities |
Brendan Maiorana Young Ku |
(443) 263-6516 (443) 263-6564 |
brendan.maiorana@wachovia.com young.ku@wachovia.com | |||
5
FINANCIAL AND OPERATING HIGHLIGHTS
DECEMBER 31, 2012
(In thousands, except per share and ratio amounts)
| Three Months Ended | ||||||||||||||||||||
| 12/31/12 | 9/30/12 | 6/30/12 | 3/31/12 | 12/31/11 | ||||||||||||||||
| Selected Operating Data |
||||||||||||||||||||
| Total revenues |
$ | 138,771 | $ | 134,537 | $ | 124,848 | $ | 120,012 | $ | 111,958 | ||||||||||
| EBITDA (1) |
85,018 | 81,773 | 63,302 | 66,485 | 71,980 | |||||||||||||||
| Adjusted EBITDA (1) |
88,784 | 85,646 | 79,571 | 75,291 | 72,011 | |||||||||||||||
| Net operating income - cash basis (2) |
92,728 | 92,032 | 86,800 | 83,432 | 75,140 | |||||||||||||||
| General and administrative expense |
10,608 | 10,226 | 8,576 | 8,614 | 9,169 | |||||||||||||||
| Acquisition-related expenses |
22 | 176 | 12,245 | 633 | 309 | |||||||||||||||
| Capitalized interest |
2,268 | 1,926 | 2,090 | 2,360 | 2,260 | |||||||||||||||
| Interest expense, net |
26,745 | 26,817 | 23,825 | 22,219 | 21,725 | |||||||||||||||
| Operating margin (3) |
70.9 | % | 70.8 | % | 70.3 | % | 69.4 | % | 71.2 | % | ||||||||||
| General and administrative expense / Total revenues |
7.6 | % | 7.6 | % | 6.9 | % | 7.2 | % | 8.2 | % | ||||||||||
| Change in same property net operating income - cash basis (4) |
6.1 | % | 7.7 | % | 6.4 | % | 4.3 | % | 2.2 | % | ||||||||||
| Net income/(loss) available to common stockholders |
4,516 | 2,758 | (8,713 | ) | (1,339 | ) | 12,058 | |||||||||||||
| Net income/(loss) per share - diluted |
$ | 0.03 | $ | 0.02 | $ | (0.06 | ) | $ | (0.01 | ) | $ | 0.08 | ||||||||
| FFO - diluted (5) |
59,546 | 56,166 | 40,680 | 50,197 | 46,880 | |||||||||||||||
| FFO per share - diluted (5) |
$ | 0.36 | $ | 0.34 | $ | 0.24 | $ | 0.30 | $ | 0.30 | ||||||||||
| CFFO - diluted (5) |
59,568 | 56,342 | 52,925 | 50,830 | 47,189 | |||||||||||||||
| CFFO per share - diluted (5) |
$ | 0.36 | $ | 0.34 | $ | 0.32 | $ | 0.30 | $ | 0.30 | ||||||||||
| AFFO - diluted (5) |
55,004 | 55,641 | 55,334 | 50,472 | 44,247 | |||||||||||||||
| AFFO per share - diluted (5) |
$ | 0.33 | $ | 0.33 | $ | 0.33 | $ | 0.30 | $ | 0.28 | ||||||||||
| Dividend per share - common stock |
$ | 0.235 | $ | 0.215 | $ | 0.215 | $ | 0.215 | $ | 0.20 | ||||||||||
| CFFO payout ratio (6) |
65.3 | % | 63.2 | % | 67.2 | % | 71.7 | % | 66.7 | % | ||||||||||
| AFFO payout ratio (6) |
71.2 | % | 65.2 | % | 65.2 | % | 71.7 | % | 71.4 | % | ||||||||||
| (1) | For definitions and discussion of EBITDA and adjusted EBITDA, see page 34. For a quantitative reconciliation of the differences between adjusted EBITDA, EBITDA and net income available to common stockholders, see page 14. |
| (2) | For definitions and discussion of net operating income - cash basis, see page 15. |
| (3) | See page 15 for detail. |
| (4) | Compared to the same period in the prior year. See page 30 for detail. |
| (5) | For definitions and discussion of FFO, CFFO and AFFO, see page 34. For a quantitative reconciliation of the differences between FFO, CFFO, AFFO and net income available to common stockholders, see pages 12 and 13. |
| (6) | See page 13 for detail of the CFFO and AFFO payout ratios. |
6
CAPITALIZATION SUMMARY
DECEMBER 31, 2012
(In thousands, except per share and ratio amounts)
| 12/31/12 | 9/30/12 | 6/30/12 | 3/31/12 | 12/31/11 | ||||||||||||||||||
| Capitalization |
||||||||||||||||||||||
| Total common shares outstanding |
154,328 | 154,335 | 154,184 | 154,163 | 154,101 | |||||||||||||||||
| Total units outstanding (1) |
2,933 | 2,943 | 2,943 | 2,957 | 2,980 | |||||||||||||||||
|
|
|
|
|
|
|
|
|
|
|
|||||||||||||
| Total common shares and units outstanding |
157,261 | 157,278 | 157,127 | 157,120 | 157,081 | |||||||||||||||||
| Common share price at quarter end |
$ | 19.33 | $ | 18.72 | $ | 18.68 | $ | 18.98 | $ | 18.08 | ||||||||||||
|
|
|
|
|
|
|
|
|
|
|
|||||||||||||
| Equity value at quarter end |
$ | 3,039,847 | $ | 2,944,240 | $ | 2,935,122 | $ | 2,982,134 | $ | 2,840,033 | ||||||||||||
| Preferred stock at liquidation value |
198,000 | 198,000 | 198,000 | 198,000 | 198,000 | |||||||||||||||||
| Consolidated debt |
2,170,983 | 2,142,405 | 2,106,021 | 1,812,258 | 1,682,578 | |||||||||||||||||
|
|
|
|
|
|
|
|
|
|
|
|||||||||||||
| Total capitalization |
$ | 5,408,830 | $ | 5,284,645 | $ | 5,239,143 | $ | 4,992,392 | $ | 4,720,611 | ||||||||||||
|
|
|
|
|
|
|
|
|
|
|
|||||||||||||
| Debt / Total assets |
44.9 | % | 44.3 | % | 43.9 | % | 39.9 | % | 38.0 | % | ||||||||||||
| Debt / Total gross assets |
39.9 | % | 39.7 | % | 39.6 | % | 36.0 | % | 34.5 | % | ||||||||||||
| Debt / Total capitalization |
40.1 | % | 40.5 | % | 40.2 | % | 36.3 | % | 35.6 | % | ||||||||||||
| Coverage Ratios (2) |
||||||||||||||||||||||
| Debt / Adjusted EBITDA |
6.1 | 6.2 | 6.6 | 6.0 | 5.8 | |||||||||||||||||
| Interest coverage |
3.7 | 3.6 | 3.8 | 3.8 | 3.7 | |||||||||||||||||
| Fixed charge coverage |
3.0 | 2.9 | 3.0 | 3.0 | 2.8 | |||||||||||||||||
| Total Consolidated Debt |
||||||||||||||||||||||
| Secured debt / Total gross assets |
10.5 | % | 10.7 | % | 10.3 | % | 11.1 | % | 12.0 | % | ||||||||||||
| Floating rate debt / Total debt |
24.1 | % | 23.0 | % | 22.7 | % | 23.5 | % | 15.9 | % | ||||||||||||
| Adjusted floating rate debt / Total debt (3) |
7.4 | % | 6.1 | % | 13.2 | % | 12.5 | % | — | |||||||||||||
| Unencumbered real estate / Total real estate |
77.0 | % | 76.8 | % | 77.0 | % | 75.2 | % | 73.7 | % | ||||||||||||
| Unencumbered CABR / Total CABR (4) |
79.3 | % | 79.1 | % | 79.3 | % | 77.9 | % | 73.0 | % | ||||||||||||
| Unsecured line of credit capacity |
$ | 632,000 | $ | 650,500 | $ | 658,590 | $ | 723,090 | $ | 481,090 | ||||||||||||
| Bond Covenants (5) | Requirements | |||||||||||||||||||||
| Total outstanding debt / Total assets |
Must be £ 60% | 41.1 | % | 41.3 | % | 41.2 | % | 37.2 | % | 35.7 | % | |||||||||||
| Secured debt / Total assets |
Must be £ 40% | 10.8 | % | 11.0 | % | 10.7 | % | 11.5 | % | 12.5 | % | |||||||||||
| Consolidated income available for debt service / Annual debt service charge |
Must be ³ 1.5X | 3.0 | 2.9 | 2.9 | 3.2 | 3.1 | ||||||||||||||||
| Unencumbered assets / Unsecured debt - Notes due 2020 |
Must be ³ 150% | 260 | % | 259 | % | 258 | % | 299 | % | 323 | % | |||||||||||
| Unencumbered assets / Unsecured debt - Notes due 2016, Notes due 2022 |
Must be ³ 150% | 257 | % | 257 | % | 255 | % | 296 | % | 320 | % | |||||||||||
| (1) | Includes both operating partnership (OP) and long term incentive plan (LTIP) units outstanding. |
| (2) | For discussion of coverage ratios, see page 34. See page 17 for the calculation of interest and fixed charge coverage ratios. See page 14 for calculation of Adjusted EBITDA. |
| (3) | Includes effect of interest rate swaps on the Company’s unsecured senior term loan facility. See page 18 for more information. |
| (4) | For current annualized base rent (CABR) by market, see page 21. |
| (5) | Calculated in accordance with the covenants contained in the indenture that governs the terms of the Company’s unsecured senior notes due 2020 and supplemental and base indentures that govern the terms of the Company’s unsecured senior notes due 2016 and unsecured senior notes due 2022, which are included as exhibits to the Company’s Forms 8-K filed with the SEC on April 30, 2010, March 30, 2011, and June 28, 2012, respectively. The covenants for the unsecured senior notes due 2020, unsecured senior notes due 2016, and unsecured senior notes due 2022 are identical, except that the unencumbered total asset value definition for the unsecured senior notes due 2020 includes investments in unconsolidated partnerships accounted for under the equity method of accounting, whereas the unencumbered total asset value definition for the unsecured senior notes due 2016 and unsecured senior notes due 2022 excludes such investments in unconsolidated partnerships. |
7
PORTFOLIO SUMMARY
DECEMBER 31, 2012
| Gross Book Value |
Buildings | Rentable Square Feet |
Weighted Average Leased % (1) |
|||||||||||||
| (In thousands) | ||||||||||||||||
| Stabilized (2) |
$ | 3,569,603 | 111 | 8,482,603 | 99.4 | % | ||||||||||
| Lease up (2) |
1,084,068 | 47 | 4,040,095 | 68.1 | % | |||||||||||
|
|
|
|
|
|
|
|||||||||||
| Total operating portfolio |
$ | 4,653,671 | 158 | 12,522,698 | 92.1 | % | ||||||||||
|
|
|
|
|
|
|
|||||||||||
| Redevelopment (3) |
$ | 47,508 | 4 | 196,867 | 42.5 | % | ||||||||||
| Pre-Development (3) |
74,015 | — | 696,000 | — | ||||||||||||
| Unconsolidated partnership portfolio (4) |
32,367 | 3 | 352,863 | 56.4 | % | |||||||||||
| Development potential (3) |
147,972 | — | 3,315,000 | — | ||||||||||||
|
|
|
|
|
|
|
|||||||||||
| Total portfolio |
$ | 4,955,533 | 165 | 17,083,428 | ||||||||||||
|
|
|
|
|
|
|
|||||||||||
| (1) | Calculated based on gross book value for each asset multiplied by the percentage leased. |
| (2) | See pages 22-23 for detail of consolidated portfolio and page 35 for definitions of terms. |
| (3) | See page 24 for detail of the consolidated portfolio and page 35 for definitions of terms. |
| (4) | See page 26 for detail of the unconsolidated partnership portfolio. |
8
CONSOLIDATED BALANCE SHEETS
DECEMBER 31, 2012
(In thousands)
| 12/31/12 | 9/30/12 | 6/30/12 | 3/31/12 | 12/31/11 | ||||||||||||||||
| Assets | ||||||||||||||||||||
| Investments in real estate, net |
$ | 4,319,716 | $ | 4,327,426 | $ | 4,309,421 | $ | 4,037,928 | $ | 3,950,246 | ||||||||||
| Investments in unconsolidated partnerships |
32,367 | 31,955 | 32,562 | 32,901 | 33,389 | |||||||||||||||
| Cash and cash equivalents |
19,976 | 20,646 | 17,385 | 13,336 | 16,411 | |||||||||||||||
| Accounts receivable, net |
4,507 | 7,128 | 4,241 | 4,426 | 5,141 | |||||||||||||||
| Accrued straight-line rents, net |
152,096 | 144,975 | 139,346 | 134,371 | 130,582 | |||||||||||||||
| Deferred leasing costs, net |
172,363 | 180,925 | 185,354 | 164,002 | 157,255 | |||||||||||||||
| Other assets |
133,454 | 118,052 | 111,383 | 158,285 | 135,521 | |||||||||||||||
|
|
|
|
|
|
|
|
|
|
|
|||||||||||
| Total assets |
$ | 4,834,479 | $ | 4,831,107 | $ | 4,799,692 | $ | 4,545,249 | $ | 4,428,545 | ||||||||||
|
|
|
|
|
|
|
|
|
|
|
|||||||||||
| Liabilities and Equity | ||||||||||||||||||||
| Liabilities: |
||||||||||||||||||||
| Mortgage notes payable, net |
$ | 571,652 | $ | 574,497 | $ | 550,704 | $ | 559,111 | $ | 587,844 | ||||||||||
| Exchangeable senior notes |
180,000 | 180,000 | 180,000 | 180,000 | 180,000 | |||||||||||||||
| Unsecured senior notes, net |
894,177 | 893,955 | 893,737 | 645,749 | 645,581 | |||||||||||||||
| Unsecured senior term loan |
405,456 | 405,216 | 400,000 | 400,000 | — | |||||||||||||||
| Unsecured line of credit |
118,000 | 87,000 | 78,000 | 26,000 | 268,000 | |||||||||||||||
| Accounts payable, accrued expenses and other liabilities |
180,653 | 178,706 | 157,829 | 156,669 | 134,924 | |||||||||||||||
|
|
|
|
|
|
|
|
|
|
|
|||||||||||
| Total liabilities |
2,349,938 | 2,319,374 | 2,260,270 | 1,967,529 | 1,816,349 | |||||||||||||||
| Equity: |
||||||||||||||||||||
| Stockholders’ equity: |
||||||||||||||||||||
| Preferred stock |
191,469 | 191,469 | 191,469 | 191,469 | 191,469 | |||||||||||||||
| Common stock |
1,543 | 1,543 | 1,542 | 1,541 | 1,541 | |||||||||||||||
| Additional paid-in capital |
2,781,849 | 2,779,035 | 2,776,046 | 2,773,248 | 2,773,994 | |||||||||||||||
| Accumulated other comprehensive loss, net |
(54,725 | ) | (56,988 | ) | (57,326 | ) | (58,882 | ) | (60,138 | ) | ||||||||||
| Dividends in excess of earnings |
(443,280 | ) | (411,529 | ) | (381,105 | ) | (339,243 | ) | (304,759 | ) | ||||||||||
|
|
|
|
|
|
|
|
|
|
|
|||||||||||
| Total stockholders’ equity |
2,476,856 | 2,503,530 | 2,530,626 | 2,568,133 | 2,602,107 | |||||||||||||||
| Noncontrolling interests |
7,685 | 8,203 | 8,796 | 9,587 | 10,089 | |||||||||||||||
|
|
|
|
|
|
|
|
|
|
|
|||||||||||
| Total equity |
2,484,541 | 2,511,733 | 2,539,422 | 2,577,720 | 2,612,196 | |||||||||||||||
|
|
|
|
|
|
|
|
|
|
|
|||||||||||
| Total liabilities and equity |
$ | 4,834,479 | $ | 4,831,107 | $ | 4,799,692 | $ | 4,545,249 | $ | 4,428,545 | ||||||||||
|
|
|
|
|
|
|
|
|
|
|
|||||||||||
9
CONSOLIDATED STATEMENTS OF OPERATIONS
DECEMBER 31, 2012
(In thousands, except share and per share data)
| Three Months Ended | ||||||||||||||||||||
| 12/31/12 | 9/30/12 | 6/30/12 | 3/31/12 | 12/31/11 | ||||||||||||||||
| Revenues: |
||||||||||||||||||||
| Rental |
$ | 103,978 | $ | 101,467 | $ | 95,708 | $ | 91,475 | $ | 84,854 | ||||||||||
| Tenant recoveries |
31,638 | 31,765 | 28,939 | 28,453 | 26,098 | |||||||||||||||
| Other revenue |
3,155 | 1,305 | 201 | 84 | 1,006 | |||||||||||||||
|
|
|
|
|
|
|
|
|
|
|
|||||||||||
| Total revenues |
138,771 | 134,537 | 124,848 | 120,012 | 111,958 | |||||||||||||||
|
|
|
|
|
|
|
|
|
|
|
|||||||||||
| Expenses: |
||||||||||||||||||||
| Rental operations |
39,502 | 38,944 | 37,044 | 36,729 | 31,899 | |||||||||||||||
| Depreciation and amortization |
52,963 | 51,372 | 47,575 | 44,934 | 36,670 | |||||||||||||||
| General and administrative |
10,608 | 10,226 | 8,576 | 8,614 | 9,169 | |||||||||||||||
| Acquisition-related expenses |
22 | 176 | 12,245 | 633 | 309 | |||||||||||||||
|
|
|
|
|
|
|
|
|
|
|
|||||||||||
| Total expenses |
103,095 | 100,718 | 105,440 | 90,910 | 78,047 | |||||||||||||||
|
|
|
|
|
|
|
|
|
|
|
|||||||||||
| Income from operations |
35,676 | 33,819 | 19,408 | 29,102 | 33,911 | |||||||||||||||
| Equity in net loss of unconsolidated partnerships |
(379 | ) | (339 | ) | (317 | ) | (355 | ) | (640 | ) | ||||||||||
| Interest expense, net |
(26,745 | ) | (26,817 | ) | (23,825 | ) | (22,219 | ) | (21,725 | ) | ||||||||||
| Other (expense)/income |
(292 | ) | (208 | ) | (549 | ) | 174 | 4,244 | ||||||||||||
|
|
|
|
|
|
|
|
|
|
|
|||||||||||
| Income/(loss) from continuing operations |
8,260 | 6,455 | (5,283 | ) | 6,702 | 15,790 | ||||||||||||||
| Income/(loss) from discontinued operations |
— | — | 49 | (4,420 | ) | 163 | ||||||||||||||
|
|
|
|
|
|
|
|
|
|
|
|||||||||||
| Net income/(loss) |
8,260 | 6,455 | (5,234 | ) | 2,282 | 15,953 | ||||||||||||||
| Net (income)/loss attributable to noncontrolling interests |
(93 | ) | (46 | ) | 172 | 30 | (244 | ) | ||||||||||||
|
|
|
|
|
|
|
|
|
|
|
|||||||||||
| Net income/(loss) attributable to the Company |
8,167 | 6,409 | (5,062 | ) | 2,312 | 15,709 | ||||||||||||||
| Preferred stock dividends |
(3,651 | ) | (3,651 | ) | (3,651 | ) | (3,651 | ) | (3,651 | ) | ||||||||||
|
|
|
|
|
|
|
|
|
|
|
|||||||||||
| Net income/(loss) available to common stockholders |
$ | 4,516 | $ | 2,758 | $ | (8,713 | ) | $ | (1,339 | ) | $ | 12,058 | ||||||||
|
|
|
|
|
|
|
|
|
|
|
|||||||||||
| Income/(loss) from continuing operations per share available to common stockholders: |
||||||||||||||||||||
| Basic and diluted earnings per share |
$ | 0.03 | $ | 0.02 | $ | (0.06 | ) | $ | 0.02 | $ | 0.08 | |||||||||
|
|
|
|
|
|
|
|
|
|
|
|||||||||||
| Income/(loss) from discontinued operations per share available to common stockholders: |
||||||||||||||||||||
| Basic and diluted earnings per share |
$ | — | $ | — | $ | — | $ | (0.03 | ) | $ | — | |||||||||
|
|
|
|
|
|
|
|
|
|
|
|||||||||||
| Net income/(loss) per share available to common stockholders: |
||||||||||||||||||||
| Basic and diluted earnings per share |
$ | 0.03 | $ | 0.02 | $ | (0.06 | ) | $ | (0.01 | ) | $ | 0.08 | ||||||||
|
|
|
|
|
|
|
|
|
|
|
|||||||||||
| Weighted-average common shares outstanding: |
||||||||||||||||||||
| Basic |
152,790,669 | 152,785,451 | 152,775,422 | 152,659,258 | 140,909,345 | |||||||||||||||
|
|
|
|
|
|
|
|
|
|
|
|||||||||||
| Diluted |
155,728,210 | 155,728,209 | 152,775,422 | 155,625,204 | 143,889,324 | |||||||||||||||
|
|
|
|
|
|
|
|
|
|
|
|||||||||||
10
BALANCE SHEET / OPERATIONS STATEMENT DETAIL
DECEMBER 31, 2012
(In thousands)
| 12/31/12 | 9/30/12 | 6/30/12 | 3/31/12 | 12/31/11 | ||||||||||||||||
| Restricted cash |
$ | 3,554 | $ | 3,443 | $ | 2,485 | $ | 4,830 | $ | 5,662 | ||||||||||
| Real estate held for sale |
— | — | — | 28,000 | — | |||||||||||||||
| Acquired above-market leases, net |
18,099 | 20,234 | 22,292 | 23,670 | 26,318 | |||||||||||||||
| Acquired below-market ground lease, net |
11,368 | 11,426 | 11,484 | 11,542 | 11,600 | |||||||||||||||
| Deferred loan costs, net |
17,512 | 18,878 | 19,476 | 18,445 | 16,253 | |||||||||||||||
| Lease incentives, net |
21,741 | 21,990 | 21,925 | 24,778 | 22,951 | |||||||||||||||
| Construction loan receivable, net (1) |
21,695 | 1,275 | 1,275 | — | — | |||||||||||||||
| Other |
39,485 | 40,806 | 32,446 | 47,020 | 52,737 | |||||||||||||||
|
|
|
|
|
|
|
|
|
|
|
|||||||||||
| Other assets |
$ | 133,454 | $ | 118,052 | $ | 111,383 | $ | 158,285 | $ | 135,521 | ||||||||||
|
|
|
|
|
|
|
|
|
|
|
|||||||||||
| Security deposits |
$ | 12,417 | $ | 12,296 | $ | 12,501 | $ | 11,941 | $ | 11,907 | ||||||||||
| Dividends and distributions payable |
40,607 | 37,465 | 37,433 | 37,431 | 35,067 | |||||||||||||||
| Accounts payable, accrued expenses and other liabilities |
114,124 | 114,533 | 95,123 | 100,689 | 81,441 | |||||||||||||||
| Derivative instruments |
5,284 | 5,702 | 3,701 | 289 | — | |||||||||||||||
| Acquired below-market leases, net |
8,221 | 8,710 | 9,071 | 6,319 | 6,509 | |||||||||||||||
|
|
|
|
|
|
|
|
|
|
|
|||||||||||
| Accounts payable, accrued expenses and other liabilities |
$ | 180,653 | $ | 178,706 | $ | 157,829 | $ | 156,669 | $ | 134,924 | ||||||||||
|
|
|
|
|
|
|
|
|
|
|
|||||||||||
|
Three Months Ended |
||||||||||||||||||||
| 12/31/12 | 9/30/12 | 6/30/12 | 3/31/12 | 12/31/11 | ||||||||||||||||
| Lease termination revenue |
$ | 2,483 | $ | 935 | $ | 81 | $ | 32 | $ | 890 | ||||||||||
| Construction loan revenue |
387 | 326 | 149 | — | — | |||||||||||||||
| Other revenue |
285 | 44 | (29 | ) | 52 | 116 | ||||||||||||||
|
|
|
|
|
|
|
|
|
|
|
|||||||||||
| Other revenue |
$ | 3,155 | $ | 1,305 | $ | 201 | $ | 84 | $ | 1,006 | ||||||||||
|
|
|
|
|
|
|
|
|
|
|
|||||||||||
| Rental operations expenses |
$ | 26,753 | $ | 26,480 | $ | 24,583 | $ | 24,673 | $ | 20,888 | ||||||||||
| Real estate taxes |
12,749 | 12,464 | 12,461 | 12,056 | 11,011 | |||||||||||||||
|
|
|
|
|
|
|
|
|
|
|
|||||||||||
| Rental operations |
$ | 39,502 | $ | 38,944 | $ | 37,044 | $ | 36,729 | $ | 31,899 | ||||||||||
|
|
|
|
|
|
|
|
|
|
|
|||||||||||
| (Loss)/gain on extinguishment of debt |
$ | (99 | ) | $ | — | $ | 34 | $ | 182 | $ | 51 | |||||||||
| Gain on revaluation of acquired unconsolidated partnerships |
— | — | — | — | 4,679 | |||||||||||||||
| Non-cash adjustment for marketable securities |
— | — | (545 | ) | — | (506 | ) | |||||||||||||
| (Loss)/gain on derivative instruments |
(1 | ) | (1 | ) | — | (8 | ) | 20 | ||||||||||||
| Realized gain on foreign currency transactions |
16 | 40 | — | — | — | |||||||||||||||
| Income tax expense |
(208 | ) | (247 | ) | (38 | ) | — | — | ||||||||||||
|
|
|
|
|
|
|
|
|
|
|
|||||||||||
| Other (expense)/income |
$ | (292 | ) | $ | (208 | ) | $ | (549 | ) | $ | 174 | $ | 4,244 | |||||||
|
|
|
|
|
|
|
|
|
|
|
|||||||||||
| (1) | Represents funding of draws on a $355 million construction loan secured by first priority mortgages on a 1.1 million square foot laboratory, office and retail development project located in Boston, Massachusetts, of which the Company’s funding obligation is $255 million. |
11
FFO, CFFO AND AFFO (1)
DECEMBER 31, 2012
(In thousands)
| Three Months Ended | ||||||||||||||||||||
| 12/31/12 | 9/30/12 | 6/30/12 | 3/31/12 | 12/31/11 | ||||||||||||||||
| Reconciliation of net income/(loss) available to common stockholders to funds from operations excluding acquisition-related expenses (CFFO): |
||||||||||||||||||||
| Net income/(loss) available to common stockholders |
$ | 4,516 | $ | 2,758 | $ | (8,713 | ) | $ | (1,339 | ) | $ | 12,058 | ||||||||
| Adjustments: |
||||||||||||||||||||
| Impairment loss |
— | — | — | 4,552 | — | |||||||||||||||
| Gain on revaluation of acquired unconsolidated partnerships |
— | — | — | — | (4,679 | ) | ||||||||||||||
| Noncontrolling interests in operating partnership |
86 | 53 | (166 | ) | (26 | ) | 252 | |||||||||||||
| Depreciation & amortization - unconsolidated partnerships |
323 | 323 | 323 | 323 | 826 | |||||||||||||||
| Depreciation & amortization - consolidated entities |
52,963 | 51,372 | 47,575 | 44,934 | 36,670 | |||||||||||||||
| Depreciation & amortization - consolidated entities - discontinued operations |
— | — | — | 92 | 92 | |||||||||||||||
| Depreciation & amortization - allocable to noncontrolling interests of consolidated joint ventures |
(30 | ) | (28 | ) | (27 | ) | (27 | ) | (27 | ) | ||||||||||
|
|
|
|
|
|
|
|
|
|
|
|||||||||||
| Funds from operations (FFO) - basic |
$ | 57,858 | $ | 54,478 | $ | 38,992 | $ | 48,509 | $ | 45,192 | ||||||||||
| Interest expense - exchangeable senior notes due 2030 (2) |
1,688 | 1,688 | 1,688 | 1,688 | 1,688 | |||||||||||||||
|
|
|
|
|
|
|
|
|
|
|
|||||||||||
| FFO - diluted |
$ | 59,546 | $ | 56,166 | $ | 40,680 | $ | 50,197 | $ | 46,880 | ||||||||||
|
|
|
|
|
|
|
|
|
|
|
|||||||||||
| Acquisition-related expenses |
22 | 176 | 12,245 | 633 | 309 | |||||||||||||||
|
|
|
|
|
|
|
|
|
|
|
|||||||||||
| FFO excluding acquisition-related expenses (CFFO) - diluted |
$ | 59,568 | $ | 56,342 | $ | 52,925 | $ | 50,830 | $ | 47,189 | ||||||||||
|
|
|
|
|
|
|
|
|
|
|
|||||||||||
| Reconciliation of CFFO to adjusted funds from operations (AFFO): |
||||||||||||||||||||
| Adjustments: |
||||||||||||||||||||
| Recurring capital expenditures and second generation tenant improvements (3) |
(5,738 | ) | (2,739 | ) | (1,716 | ) | (4,629 | ) | (3,201 | ) | ||||||||||
| Leasing commissions |
(1,476 | ) | (2,001 | ) | (1,335 | ) | (1,419 | ) | (1,192 | ) | ||||||||||
| Gain on extinguishment of debt |
(20 | ) | — | (34 | ) | (182 | ) | (51 | ) | |||||||||||
| Loss/(gain) on derivative instruments |
1 | 1 | — | 8 | (20 | ) | ||||||||||||||
| Non-cash adjustment for marketable securities |
— | — | 545 | — | 506 | |||||||||||||||
| Amortization of deferred interest costs |
1,724 | 1,730 | 1,736 | 1,742 | 1,748 | |||||||||||||||
| Amortization of deferred loan costs |
1,354 | 1,255 | 1,225 | 1,035 | 1,019 | |||||||||||||||
| Amortization of fair-value of debt acquired |
(159 | ) | (178 | ) | (130 | ) | (231 | ) | (327 | ) | ||||||||||
| Amortization of debt discounts |
222 | 218 | 172 | 168 | 170 | |||||||||||||||
| Amortization of lease incentives |
576 | 561 | 659 | 1,173 | 599 | |||||||||||||||
| Depreciation included in general and administrative expense |
510 | 483 | 455 | 442 | 387 | |||||||||||||||
| Non-cash equity compensation |
2,860 | 3,094 | 2,887 | 2,689 | 2,029 | |||||||||||||||
| Straight line rents |
(6,330 | ) | (5,288 | ) | (4,300 | ) | (3,454 | ) | (6,701 | ) | ||||||||||
| Share of unconsolidated partnership adjustments (4) |
34 | 26 | 26 | 1 | (10 | ) | ||||||||||||||
| Fair-value lease revenue |
1,878 | 2,137 | 2,219 | 2,299 | 2,102 | |||||||||||||||
|
|
|
|
|
|
|
|
|
|
|
|||||||||||
| AFFO - diluted |
$ | 55,004 | $ | 55,641 | $ | 55,334 | $ | 50,472 | $ | 44,247 | ||||||||||
|
|
|
|
|
|
|
|
|
|
|
|||||||||||
| (1) | For definitions and discussion of FFO, CFFO and AFFO, see page 34. |
| (2) | The calculations of FFO, CFFO and AFFO per share diluted include the assumed issuance of common stock pursuant to the exchange provision of the exchangeable senior notes due 2030, which is dilutive based on the “if converted” method for all periods presented since the original issuance in January 2010. Under the if converted method, if the add back of interest charges relating to the exchangeable senior notes due 2030 divided by the corresponding number of common shares issuable upon exchange is dilutive, the potentially issuable shares are included in the calculations of FFO, CFFO and AFFO per diluted share. |
| (3) | Includes revenue enhancing and non-revenue enhancing recurring capital expenditures. Excludes first generation tenant improvements. For definitions of recurring capital expenditures and first and second generation leases, see page 35. |
| (4) | Share of unconsolidated partnership adjustments includes the Company’s share of amortization of deferred loan costs, lease incentives, straight line rents and fair-value lease revenue. |
12
FFO, CFFO AND AFFO PER SHARE (1)
DECEMBER 31, 2012
(In thousands, except share, per share and ratio amounts)
| Three Months Ended | ||||||||||||||||||||
| 12/31/12 | 9/30/12 | 6/30/12 | 3/31/12 | 12/31/11 | ||||||||||||||||
| FFO - basic |
$ | 57,858 | $ | 54,478 | $ | 38,992 | $ | 48,509 | $ | 45,192 | ||||||||||
| FFO - diluted |
59,546 | 56,166 | 40,680 | 50,197 | 46,880 | |||||||||||||||
| CFFO - diluted |
59,568 | 56,342 | 52,925 | 50,830 | 47,189 | |||||||||||||||
| AFFO - diluted |
55,004 | 55,641 | 55,334 | 50,472 | 44,247 | |||||||||||||||
| FFO per share - basic |
$ | 0.37 | $ | 0.35 | $ | 0.25 | $ | 0.31 | $ | 0.31 | ||||||||||
| FFO per share - diluted (2) |
0.36 | 0.34 | 0.24 | 0.30 | 0.30 | |||||||||||||||
| CFFO per share - diluted (2) |
0.36 | 0.34 | 0.32 | 0.30 | 0.30 | |||||||||||||||
| AFFO per share - diluted (2) |
0.33 | 0.33 | 0.33 | 0.30 | 0.28 | |||||||||||||||
| Dividends and distributions declared per common share |
$ | 0.235 | $ | 0.215 | $ | 0.215 | $ | 0.215 | $ | 0.20 | ||||||||||
|
|
|
|
|
|
|
|
|
|
|
|||||||||||
| CFFO payout ratio |
65.3 | % | 63.2 | % | 67.2 | % | 71.7 | % | 66.7 | % | ||||||||||
| AFFO payout ratio |
71.2 | % | 65.2 | % | 65.2 | % | 71.7 | % | 71.4 | % | ||||||||||
| Weighted-average common shares and units outstanding diluted (3) |
157,265,242 | 157,223,682 | 157,111,463 | 157,108,910 | 145,350,296 | |||||||||||||||
| Dilutive effect of exchangeable senior notes due 2030 (2) |
10,259,496 | 10,127,232 | 10,127,232 | 10,127,232 | 10,017,858 | |||||||||||||||
|
|
|
|
|
|
|
|
|
|
|
|||||||||||
| Weighted-average common shares and units outstanding diluted - FFO, CFFO and AFFO |
167,524,738 | 167,350,914 | 167,238,695 | 167,236,142 | 155,368,154 | |||||||||||||||
|
|
|
|
|
|
|
|
|
|
|
|||||||||||
| (1) | For definitions and discussion of FFO, CFFO and AFFO, see page 34. |
| (2) | The calculations of FFO, CFFO and AFFO per share diluted include the assumed issuance of common stock pursuant to the exchange provision of the exchangeable senior notes due 2030, which is dilutive based on the “if converted” method for all periods presented since the original issuance in January 2010. Under the if converted method, if the add back of interest charges relating to the exchangeable senior notes due 2030 divided by the corresponding number of common shares issuable upon exchange is dilutive, the potentially issuable shares are included in the calculations of FFO, CFFO and AFFO per diluted share. |
| (3) | The three months ended June 30, 2012 includes 2,947,140 shares of OP and LTIP units, which are considered anti-dilutive for purposes of calculating diluted earnings per share. The three months ended December 31, 2012, September 30, 2012, June 30, 2012, March 31, 2012 and December 31, 2011 include 1,537,032, 1,495,473, 1,388,901, 1,483,706 and 1,460,972 shares of unvested restricted stock, respectively, which are considered anti-dilutive for purposes of calculating diluted earnings per share. |
13
RECONCILIATION OF EBITDA AND ADJUSTED EBITDA (1)
DECEMBER 31, 2012
(In thousands)
| Three Months Ended | ||||||||||||||||||||
| 12/31/12 | 9/30/12 | 6/30/12 | 3/31/12 | 12/31/11 | ||||||||||||||||
| Reconciliation of net income/(loss) available to common stockholders to earnings before interest, taxes, depreciation and amortization (EBITDA) and Adjusted EBITDA: |
||||||||||||||||||||
| Net income/(loss) available to common stockholders |
$ | 4,516 | $ | 2,758 | $ | (8,713 | ) | $ | (1,339 | ) | $ | 12,058 | ||||||||
| Interest expense, net |
26,745 | 26,817 | 23,825 | 22,219 | 21,725 | |||||||||||||||
| Interest expense - unconsolidated partnerships |
263 | 256 | 254 | 256 | 609 | |||||||||||||||
| Income tax expense |
208 | 247 | 38 | — | — | |||||||||||||||
| Depreciation & amortization - consolidated entities |
52,963 | 51,372 | 47,575 | 44,934 | 36,670 | |||||||||||||||
| Depreciation & amortization - discontinued operations |
— | — | — | 92 | 92 | |||||||||||||||
| Depreciation & amortization - unconsolidated partnerships |
323 | 323 | 323 | 323 | 826 | |||||||||||||||
|
|
|
|
|
|
|
|
|
|
|
|||||||||||
| EBITDA |
85,018 | 81,773 | 63,302 | 66,485 | 71,980 | |||||||||||||||
| Noncontrolling interests |
93 | 46 | (172 | ) | (30 | ) | 244 | |||||||||||||
| Impairment loss |
— | — | — | 4,552 | — | |||||||||||||||
| Preferred dividends |
3,651 | 3,651 | 3,651 | 3,651 | 3,651 | |||||||||||||||
| Non-cash adjustment for marketable securities |
— | — | 545 | — | 506 | |||||||||||||||
| Gain on revaluation of acquired unconsolidated partnerships |
— | — | — | — | (4,679 | ) | ||||||||||||||
| Acquisition-related expenses |
22 | 176 | 12,245 | 633 | 309 | |||||||||||||||
| Adjusted EBITDA |
$ | 88,784 | $ | 85,646 | $ | 79,571 | $ | 75,291 | $ | 72,011 | ||||||||||
|
|
|
|
|
|
|
|
|
|
|
|||||||||||
| (1) | For definitions and discussion of EBITDA and Adjusted EBITDA, see page 34. |
14
RECONCILIATION OF NET OPERATING INCOME (1)
DECEMBER 31, 2012
(In thousands, except ratio amounts)
| Three Months Ended | ||||||||||||||||||||
| 12/31/12 | 9/30/12 | 6/30/12 | 3/31/12 | 12/31/11 | ||||||||||||||||
| Net income/(loss) |
$ | 8,260 | $ | 6,455 | $ | (5,234 | ) | $ | 2,282 | $ | 15,953 | |||||||||
| (Income)/loss from discontinued operations |
— | — | (49 | ) | 4,420 | (163 | ) | |||||||||||||
| Equity in net loss of unconsolidated partnerships |
379 | 339 | 317 | 355 | 640 | |||||||||||||||
| Interest expense, net |
26,745 | 26,817 | 23,825 | 22,219 | 21,725 | |||||||||||||||
| Other expense/(income) |
292 | 208 | 549 | (174 | ) | (4,244 | ) | |||||||||||||
|
|
|
|
|
|
|
|
|
|
|
|||||||||||
| Income from operations |
35,676 | 33,819 | 19,408 | 29,102 | 33,911 | |||||||||||||||
| Depreciation and amortization |
52,963 | 51,372 | 47,575 | 44,934 | 36,670 | |||||||||||||||
| General and administrative |
10,608 | 10,226 | 8,576 | 8,614 | 9,169 | |||||||||||||||
| Acquisition-related expenses |
22 | 176 | 12,245 | 633 | 309 | |||||||||||||||
|
|
|
|
|
|
|
|
|
|
|
|||||||||||
| Consolidated net operating income |
$ | 99,269 | $ | 95,593 | $ | 87,804 | $ | 83,283 | $ | 80,059 | ||||||||||
|
|
|
|
|
|
|
|
|
|
|
|||||||||||
| Revenues: |
||||||||||||||||||||
| Rental |
$ | 103,978 | $ | 101,467 | $ | 95,708 | $ | 91,475 | $ | 84,854 | ||||||||||
| Tenant recoveries |
31,638 | 31,765 | 28,939 | 28,453 | 26,098 | |||||||||||||||
| Other revenue (2) |
3,155 | 1,305 | 201 | 84 | 1,006 | |||||||||||||||
|
|
|
|
|
|
|
|
|
|
|
|||||||||||
| Total revenues |
138,771 | 134,537 | 124,848 | 120,012 | 111,958 | |||||||||||||||
| Expenses: |
||||||||||||||||||||
| Rental operations |
39,502 | 38,944 | 37,044 | 36,729 | 31,899 | |||||||||||||||
|
|
|
|
|
|
|
|
|
|
|
|||||||||||
| Consolidated net operating income |
$ | 99,269 | $ | 95,593 | $ | 87,804 | $ | 83,283 | $ | 80,059 | ||||||||||
|
|
|
|
|
|
|
|
|
|
|
|||||||||||
| Consolidated net operating income - cash basis (3) |
$ | 92,728 | $ | 92,032 | $ | 86,800 | $ | 83,432 | $ | 75,140 | ||||||||||
|
|
|
|
|
|
|
|
|
|
|
|||||||||||
| Operating margin (4) |
70.9 | % | 70.8 | % | 70.3 | % | 69.4 | % | 71.2 | % | ||||||||||
| Operating expense recovery (5) |
80.1 | % | 81.6 | % | 78.1 | % | 77.5 | % | 81.8 | % | ||||||||||
| (1) | For a definition and discussion of net operating income, see page 34. |
| (2) | Includes lease termination income, see page 11 for detail. |
| (3) | Consolidated net operating income - cash basis is calculated as (consolidated net operating income - straight line rents - fair value lease revenue - lease incentive revenue - bad debt expense - other revenue). |
| (4) | Operating margin is calculated as ((rental revenues + tenant recovery revenues - rental operations) / (rental revenues + tenant recovery revenues)). |
| (5) | Operating expense recovery is calculated as (tenant recovery revenues / rental operations). |
15
INTEREST EXPENSE
DECEMBER 31, 2012
(In thousands)
| Three Months Ended | ||||||||||||||||||||
| 12/31/12 | 9/30/12 | 6/30/12 | 3/31/12 | 12/31/11 | ||||||||||||||||
| Mortgage notes payable |
$ | 10,103 | $ | 10,077 | $ | 9,882 | $ | 10,275 | $ | 10,520 | ||||||||||
| Exchangeable senior notes |
1,688 | 1,688 | 1,688 | 1,688 | 1,698 | |||||||||||||||
| Unsecured senior notes |
10,334 | 10,334 | 7,767 | 7,678 | 7,678 | |||||||||||||||
| Unsecured senior term loan |
2,039 | 2,022 | 1,911 | 42 | — | |||||||||||||||
| Unsecured line of credit |
417 | 346 | 533 | 1,508 | 808 | |||||||||||||||
| Line of credit fees |
712 | 729 | 664 | 664 | 671 | |||||||||||||||
| Derivative instruments |
579 | 522 | 467 | 10 | — | |||||||||||||||
|
|
|
|
|
|
|
|
|
|
|
|||||||||||
| Interest expense, net - cash basis |
$ | 25,872 | $ | 25,718 | $ | 22,912 | $ | 21,865 | $ | 21,375 | ||||||||||
|
|
|
|
|
|
|
|
|
|
|
|||||||||||
| Non-cash interest expense: |
||||||||||||||||||||
| Amortization of fair-value of debt acquired |
(159 | ) | (178 | ) | (130 | ) | (231 | ) | (327 | ) | ||||||||||
| Amortization of debt discounts |
222 | 218 | 172 | 168 | 170 | |||||||||||||||
| Amortization of deferred loan costs |
1,354 | 1,255 | 1,225 | 1,035 | 1,019 | |||||||||||||||
| Amortization of deferred interest costs |
1,724 | 1,730 | 1,736 | 1,742 | 1,748 | |||||||||||||||
| Capitalized interest |
(2,268 | ) | (1,926 | ) | (2,090 | ) | (2,360 | ) | (2,260 | ) | ||||||||||
|
|
|
|
|
|
|
|
|
|
|
|||||||||||
| Interest expense, net |
$ | 26,745 | $ | 26,817 | $ | 23,825 | $ | 22,219 | $ | 21,725 | ||||||||||
|
|
|
|
|
|
|
|
|
|
|
|||||||||||
16
COVERAGE RATIOS (1)
DECEMBER 31, 2012
(In thousands, except ratio amounts)
| Three Months Ended | ||||||||||||||||||||
| 12/31/12 | 9/30/12 | 6/30/12 | 3/31/12 | 12/31/11 | ||||||||||||||||
| Interest coverage ratio |
||||||||||||||||||||
| Adjusted EBITDA |
$ | 88,784 | $ | 85,646 | $ | 79,571 | $ | 75,291 | $ | 72,011 | ||||||||||
| Interest expense: |
||||||||||||||||||||
| Interest expense, net |
26,745 | 26,817 | 23,825 | 22,219 | 21,725 | |||||||||||||||
| Interest expense - unconsolidated partnerships |
263 | 256 | 254 | 256 | 609 | |||||||||||||||
| Amortization of deferred interest costs |
(1,724 | ) | (1,730 | ) | (1,736 | ) | (1,742 | ) | (1,748 | ) | ||||||||||
| Amortization of deferred loan costs |
(1,354 | ) | (1,255 | ) | (1,225 | ) | (1,035 | ) | (1,019 | ) | ||||||||||
| Amortization of debt discounts |
(222 | ) | (218 | ) | (172 | ) | (168 | ) | (170 | ) | ||||||||||
| Amortization of fair-value of debt acquired |
159 | 178 | 130 | 231 | 327 | |||||||||||||||
|
|
|
|
|
|
|
|
|
|
|
|||||||||||
| Total interest expense |
$ | 23,867 | $ | 24,048 | $ | 21,076 | $ | 19,761 | $ | 19,724 | ||||||||||
|
|
|
|
|
|
|
|
|
|
|
|||||||||||
| Interest coverage ratio |
3.7 | 3.6 | 3.8 | 3.8 | 3.7 | |||||||||||||||
|
|
|
|
|
|
|
|
|
|
|
|||||||||||
| Fixed charge coverage ratio |
||||||||||||||||||||
| Adjusted EBITDA |
$ | 88,784 | $ | 85,646 | $ | 79,571 | $ | 75,291 | $ | 72,011 | ||||||||||
| Fixed charges: |
||||||||||||||||||||
| Interest expense, net |
26,745 | 26,817 | 23,825 | 22,219 | 21,725 | |||||||||||||||
| Interest expense - unconsolidated partnerships |
263 | 256 | 254 | 256 | 609 | |||||||||||||||
| Amortization of deferred interest costs |
(1,724 | ) | (1,730 | ) | (1,736 | ) | (1,742 | ) | (1,748 | ) | ||||||||||
| Amortization of deferred loan costs |
(1,354 | ) | (1,255 | ) | (1,225 | ) | (1,035 | ) | (1,019 | ) | ||||||||||
| Amortization of debt discounts |
(222 | ) | (218 | ) | (172 | ) | (168 | ) | (170 | ) | ||||||||||
| Amortization of fair-value of debt acquired |
159 | 178 | 130 | 231 | 327 | |||||||||||||||
| Principal payments |
2,063 | 1,975 | 1,918 | 2,092 | 2,141 | |||||||||||||||
| Preferred dividends |
3,651 | 3,651 | 3,651 | 3,651 | 3,651 | |||||||||||||||
|
|
|
|
|
|
|
|
|
|
|
|||||||||||
| Total fixed charges |
$ | 29,581 | $ | 29,674 | $ | 26,645 | $ | 25,504 | $ | 25,516 | ||||||||||
|
|
|
|
|
|
|
|
|
|
|
|||||||||||
| Fixed charge coverage ratio |
3.0 | 2.9 | 3.0 | 3.0 | 2.8 | |||||||||||||||
|
|
|
|
|
|
|
|
|
|
|
|||||||||||
| (1) | For a discussion of coverage ratios, see page 34. |
17
DEBT SUMMARY
DECEMBER 31, 2012
(Dollars in thousands)
| Stated Rate |
Effective Rate |
Principal Balance |
Unamortized Premium / (Discount) |
Carrying Value |
Maturity Date |
|||||||||||||||||||
| Consolidated Debt: |
||||||||||||||||||||||||
| Fixed Rate Mortgages: |
||||||||||||||||||||||||
| 9900 Belward Campus Drive |
5.64 | % | 3.99 | % | $ | 10,767 | $ | 757 | $ | 11,524 | 07/17 | |||||||||||||
| 9901 Belward Campus Drive |
5.64 | % | 3.99 | % | 13,260 | 928 | 14,188 | 07/17 | ||||||||||||||||
| Center for Life Science | Boston |
7.75 | % | 7.75 | % | 338,447 | — | 338,447 | 06/14 | ||||||||||||||||
| 500 Kendall Street (Kendall D) |
6.38 | % | 5.45 | % | 60,164 | 2,440 | 62,604 | 12/18 | ||||||||||||||||
| Shady Grove Road |
5.97 | % | 5.97 | % | 144,889 | — | 144,889 | 09/16 | ||||||||||||||||
|
|
|
|
|
|
|
|
|
|
|
|||||||||||||||
| Total / Weighted-Average on Fixed Rate Mortgages |
7.06 | % | 6.89 | % | 567,527 | 4,125 | 571,652 | |||||||||||||||||
| Fixed Rate Debt: |
||||||||||||||||||||||||
| Unsecured Exchangeable Senior Notes Due 2030 |
3.75 | % | 3.75 | % | 180,000 | — | 180,000 | 01/30 | ||||||||||||||||
| Unsecured Senior Notes Due 2016 |
3.85 | % | 3.99 | % | 400,000 | (1,711 | ) | 398,289 | 04/16 | |||||||||||||||
| Unsecured Senior Notes Due 2020 |
6.13 | % | 6.27 | % | 250,000 | (2,016 | ) | 247,984 | 04/20 | |||||||||||||||
| Unsecured Senior Notes Due 2022 |
4.25 | % | 4.36 | % | 250,000 | (2,096 | ) | 247,904 | 07/22 | |||||||||||||||
|
|
|
|
|
|
|
|
|
|
|
|||||||||||||||
| Subtotal / Weighted-Average on Unsecured Senior Notes |
4.59 | % | 4.73 | % | 900,000 | (5,823 | ) | 894,177 | ||||||||||||||||
|
|
|
|
|
|
|
|
|
|
|
|||||||||||||||
| Total / Weighted-Average on Fixed Rate Debt |
5.35 | % | 5.37 | % | 1,647,527 | (1,698 | ) | 1,645,829 | ||||||||||||||||
| Variable Rate Debt: |
||||||||||||||||||||||||
| Unsecured Senior Term Loan - U.S. Dollar (1) |
1.86 | % | 2.64 | % | 243,596 | — | 243,596 | 03/17 | ||||||||||||||||
| Unsecured Senior Term Loan - GBP (2) |
2.15 | % | 2.39 | % | 161,860 | — | 161,860 | 03/17 | ||||||||||||||||
| Unsecured Line of Credit (3) |
1.76 | % | 1.76 | % | 118,000 | — | 118,000 | 07/15 | ||||||||||||||||
|
|
|
|
|
|
|
|
|
|
|
|||||||||||||||
| Total / Weighted-Average on Variable Rate Debt |
1.93 | % | 2.36 | % | 523,456 | — | 523,456 | |||||||||||||||||
|
|
|
|
|
|
|
|
|
|
|
|||||||||||||||
| Total / Weighted-Average on Unsecured Debt |
3.63 | % | 3.85 | % | 1,603,456 | (5,823 | ) | 1,597,633 | ||||||||||||||||
| Total / Weighted-Average on Consolidated Debt |
4.53 | % | 4.64 | % | $ | 2,170,983 | $ | (1,698 | ) | $ | 2,169,285 | |||||||||||||
|
|
|
|
|
|
|
|
|
|
|
|||||||||||||||
| Share of Unconsolidated Partnership Debt: |
||||||||||||||||||||||||
| PREI Secured Construction Loan (20%) (variable) |
3.22 | % | 3.22 | % | 27,795 | — | 27,795 | 08/13 | ||||||||||||||||
|
|
|
|
|
|
|
|
|
|
|
|||||||||||||||
| Total / Weighted-Average on Share of Unconsolidated Partnership Debt |
3.22 | % | 3.22 | % | 27,795 | — | 27,795 | |||||||||||||||||
| Total / Weighted-Average on Consolidated and Share of Unconsolidated Partnership Debt |
4.51 | % | 4.62 | % | $ | 2,198,778 | $ | (1,698 | ) | $ | 2,197,080 | |||||||||||||
|
|
|
|
|
|
|
|
|
|
|
|||||||||||||||
| (1) | The Company entered into interest rate swap agreements that effectively fix the interest rate on $200 million of the unsecured senior term loan facility at 2.81% for the remaining term of the loan, subject to adjustments based on the Company’s credit ratings. Including the effect of these swaps, the weighted-average effective interest rate for the $243.6 million outstanding under the unsecured senior term loan facility was 2.64% at December 31, 2012. |
| (2) | On August 2, 2012, the Company amended the unsecured senior term loan facility and converted $156.4 million of outstanding borrowings into British pounds sterling equal to £100 million. The principal balance represents the dollar amount based on the exchange rate of $1.62 to £1.00 at the end of the quarter. The Company entered into interest rate swap agreements that effectively fix the interest rate on £100 million at 2.39% for the remaining term of the loan, subject to adjustments based on the Company’s credit ratings. |
| (3) | Effective rate excludes facility fee of 35 bps on the entire capacity of the unsecured line of credit, or $750.0 million, which equals approximately $664,000 per quarter. |
18
DEBT MATURITIES
DECEMBER 31, 2012
(In thousands)
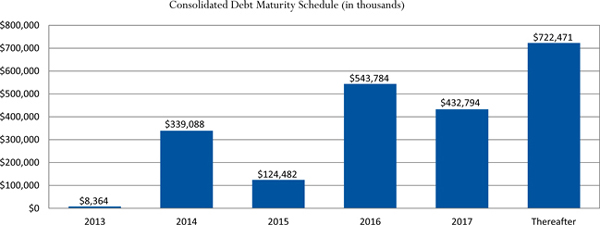
Weighted-average debt maturity is 5.6 years for consolidated debt (excluding extension options).
| 2013 | 2014 | 2015 | 2016 | 2017 | Thereafter | Total | ||||||||||||||||||||||
| Consolidated debt: |
||||||||||||||||||||||||||||
| Fixed rate debt: |
||||||||||||||||||||||||||||
| Fixed rate mortgages |
$ | 8,364 | $ | 339,088 | $ | 6,482 | $ | 143,784 | $ | 27,338 | $ | 42,471 | $ | 567,527 | ||||||||||||||
|
|
|
|
|
|
|
|
|
|
|
|
|
|
|
|||||||||||||||
| Unsecured exchangeable senior notes due 2030 (1) |
— | — | — | — | — | 180,000 | 180,000 | |||||||||||||||||||||
| Unsecured senior notes due 2016 |
— | — | — | 400,000 | — | — | 400,000 | |||||||||||||||||||||
| Unsecured senior notes due 2020 |
— | — | — | — | — | 250,000 | 250,000 | |||||||||||||||||||||
| Unsecured senior notes due 2022 |
— | — | — | — | — | 250,000 | 250,000 | |||||||||||||||||||||
|
|
|
|
|
|
|
|
|
|
|
|
|
|
|
|||||||||||||||
| Total fixed rate debt |
8,364 | 339,088 | 6,482 | 543,784 | 27,338 | 722,471 | 1,647,527 | |||||||||||||||||||||
| Variable rate debt: |
||||||||||||||||||||||||||||
| Unsecured senior term loan - U.S. Dollar |
— | — | — | — | 243,596 | — | 243,596 | |||||||||||||||||||||
| Unsecured senior term loan - GBP |
— | — | — | — | 161,860 | — | 161,860 | |||||||||||||||||||||
| Unsecured line of credit |
— | — | 118,000 | — | — | — | 118,000 | |||||||||||||||||||||
|
|
|
|
|
|
|
|
|
|
|
|
|
|
|
|||||||||||||||
| Total variable rate debt |
— | — | 118,000 | — | 405,456 | — | 523,456 | |||||||||||||||||||||
|
|
|
|
|
|
|
|
|
|
|
|
|
|
|
|||||||||||||||
| Total consolidated debt |
$ | 8,364 | $ | 339,088 | $ | 124,482 | $ | 543,784 | $ | 432,794 | $ | 722,471 | $ | 2,170,983 | ||||||||||||||
|
|
|
|
|
|
|
|
|
|
|
|
|
|
|
|||||||||||||||
| Share of unconsolidated partnership debt: |
||||||||||||||||||||||||||||
| PREI secured construction loan (20%) (variable) |
27,795 | — | — | — | — | — | 27,795 | |||||||||||||||||||||
|
|
|
|
|
|
|
|
|
|
|
|
|
|
|
|||||||||||||||
| Share of total unconsolidated partnership debt |
$ | 27,795 | $ | — | $ | — | $ | — | $ | — | $ | — | $ | 27,795 | ||||||||||||||
|
|
|
|
|
|
|
|
|
|
|
|
|
|
|
|||||||||||||||
| Total consolidated and share of unconsolidated partnership debt |
$ | 36,159 | $ | 339,088 | $ | 124,482 | $ | 543,784 | $ | 432,794 | $ | 722,471 | $ | 2,198,778 | ||||||||||||||
|
|
|
|
|
|
|
|
|
|
|
|
|
|
|
|||||||||||||||
| (1) | The holders of the unsecured exchangeable senior notes due 2030 (the “2030 Notes”) have the right to require the Company to repurchase the 2030 Notes, in whole or in part, for cash on each of January 15, 2015, January 15, 2020 and January 15, 2025, or upon the occurrence of a designated event, in each case for a repurchase price equal to 100% of the principal amount of the 2030 Notes plus accrued and unpaid interest. |
19
COMMON AND PREFERRED STOCK DATA
DECEMBER 31, 2012
(Shares in thousands)
Summary of Common Shares
| Three Months Ended | ||||||||||||||||||||
| 12/31/12 | 09/30/12 | 06/30/12 | 03/31/12 | 12/31/11 | ||||||||||||||||
| Earnings per share |
||||||||||||||||||||
| Weighted-average common shares outstanding |
152,791 | 152,785 | 152,775 | 152,659 | 140,909 | |||||||||||||||
| Weighted-average OP and LTIP units outstanding |
2,937 | 2,943 | — | 2,966 | 2,980 | |||||||||||||||
|
|
|
|
|
|
|
|
|
|
|
|||||||||||
| Diluted common shares - EPS |
155,728 | 155,728 | 152,775 | 155,625 | 143,889 | |||||||||||||||
|
|
|
|
|
|
|
|
|
|
|
|||||||||||
| Funds from operations |
||||||||||||||||||||
| Weighted-average common shares outstanding |
152,791 | 152,785 | 152,775 | 152,659 | 140,909 | |||||||||||||||
| Weighted-average OP and LTIP units outstanding |
2,937 | 2,943 | 2,948 | 2,966 | 2,980 | |||||||||||||||
| Dilutive effect of restricted stock |
1,537 | 1,496 | 1,389 | 1,484 | 1,461 | |||||||||||||||
| Dilutive effect of exchangeable senior notes due 2030 |
10,260 | 10,127 | 10,127 | 10,127 | 10,018 | |||||||||||||||
|
|
|
|
|
|
|
|
|
|
|
|||||||||||
| Diluted common shares - FFO |
167,525 | 167,351 | 167,239 | 167,236 | 155,368 | |||||||||||||||
|
|
|
|
|
|
|
|
|
|
|
|||||||||||
| Closing common shares, OP and LTIP units outstanding |
157,261 | 157,278 | 157,127 | 157,120 | 157,081 | |||||||||||||||
| Preferred shares outstanding |
7,920 | 7,920 | 7,920 | 7,920 | 7,920 | |||||||||||||||
| High price |
$ | 19.68 | $ | 19.94 | $ | 20.30 | $ | 19.65 | $ | 18.95 | ||||||||||
| Low price |
$ | 18.19 | $ | 18.10 | $ | 17.52 | $ | 17.72 | $ | 15.44 | ||||||||||
| Average closing price |
$ | 19.07 | $ | 18.81 | $ | 18.71 | $ | 18.65 | $ | 17.68 | ||||||||||
| Closing price |
$ | 19.33 | $ | 18.72 | $ | 18.68 | $ | 18.98 | $ | 18.08 | ||||||||||
| Dividends per share - annualized |
$ | 0.94 | $ | 0.86 | $ | 0.86 | $ | 0.86 | $ | 0.80 | ||||||||||
| Closing dividend yield - annualized |
4.9 | % | 4.6 | % | 4.6 | % | 4.5 | % | 4.4 | % | ||||||||||
| Dividends per Share |
||||||||||||||||||||
| 12/31/12 | 09/30/12 | 06/30/12 | 03/31/12 | 12/31/11 | ||||||||||||||||
| Common Stock - BMR |
||||||||||||||||||||
| Amount |
$ | 0.235 | $ | 0.215 | $ | 0.215 | $ | 0.215 | $ | 0.20 | ||||||||||
| Declared |
December 12, 2012 | September 14, 2012 | June 15, 2012 | March 15, 2012 | December 14, 2011 | |||||||||||||||
| Record |
December 31, 2012 | September 28, 2012 | June 29, 2012 | March 30, 2012 | December 30, 2011 | |||||||||||||||
| Paid |
January 15, 2013 | October 15, 2012 | July 16, 2012 | April 16, 2012 | January 17, 2012 | |||||||||||||||
| Preferred Stock - BMR PrA |
||||||||||||||||||||
| Amount |
$ | 0.46094 | $ | 0.46094 | $ | 0.46094 | $ | 0.46094 | $ | 0.46094 | ||||||||||
| Declared |
December 12, 2012 | September 14, 2012 | June 15, 2012 | March 15, 2012 | December 14, 2011 | |||||||||||||||
| Record |
December 31, 2012 | September 28, 2012 | June 29, 2012 | March 30, 2012 | December 30, 2011 | |||||||||||||||
| Paid |
January 15, 2013 | October 15, 2012 | July 16, 2012 | April 16, 2012 | January 17, 2012 | |||||||||||||||
20
MARKET SUMMARY
DECEMBER 31, 2012
| Current (1) | Expiration (2) | |||||||||||||||||||||||||||
| Market |
Leased Square Feet |
Annualized Base Rent |
Percent of Annualized Base Rent |
Annualized Base Rent per Leased Sq Ft |
Annualized Base Rent |
Percent of Annualized Base Rent |
Annualized Base Rent per Leased Sq Ft |
|||||||||||||||||||||
| (In thousands) | (In thousands) | |||||||||||||||||||||||||||
| Boston |
2,965,171 | $ | 159,620 | 36.3 | % | $ | 53.83 | $ | 171,425 | 33.8 | % | $ | 57.81 | |||||||||||||||
| San Francisco |
2,237,448 | 64,113 | 14.6 | % | 28.65 | 77,141 | 15.2 | % | 34.48 | |||||||||||||||||||
| Maryland |
1,589,217 | 60,365 | 13.7 | % | 37.98 | 75,450 | 14.9 | % | 47.48 | |||||||||||||||||||
| San Diego |
1,840,037 | 59,552 | 13.6 | % | 32.36 | 74,377 | 14.7 | % | 40.42 | |||||||||||||||||||
| New York / New Jersey |
1,187,886 | 40,185 | 9.2 | % | 33.83 | 49,435 | 9.8 | % | 41.62 | |||||||||||||||||||
| Pennsylvania |
652,009 | 15,210 | 3.5 | % | 23.33 | 16,103 | 3.2 | % | 24.70 | |||||||||||||||||||
| Seattle |
248,263 | 12,038 | 2.7 | % | 48.49 | 14,144 | 2.8 | % | 56.97 | |||||||||||||||||||
| University Related - Other |
829,576 | 28,052 | 6.4 | % | 33.81 | 28,742 | 5.6 | % | 34.65 | |||||||||||||||||||
|
|
|
|
|
|
|
|
|
|
|
|
|
|
|
|||||||||||||||
| Total portfolio / weighted-average |
11,549,607 | $ | 439,135 | 100.0 | % | $ | 38.02 | $ | 506,817 | 100.0 | % | $ | 43.88 | |||||||||||||||
|
|
|
|
|
|
|
|
|
|
|
|
|
|
|
|||||||||||||||
| Percent Leased | ||||||||||||||||||||||||||||
| Market |
Total Operating Portfolio |
Redevelopment (3) | Unconsolidated Partnership Portfolio (4) |
|||||||||||||||||||||||||
| Boston |
97.6 | % | — | 45.0 | % | |||||||||||||||||||||||
| San Francisco |
79.3 | % | — | — | ||||||||||||||||||||||||
| Maryland |
97.0 | % | 61.4 | % | — | |||||||||||||||||||||||
| San Diego |
92.0 | % | — | 100.0 | % | |||||||||||||||||||||||
| New York / New Jersey |
83.3 | % | — | — | ||||||||||||||||||||||||
| Pennsylvania |
89.8 | % | — | — | ||||||||||||||||||||||||
| Seattle |
67.8 | % | — | — | ||||||||||||||||||||||||
| University Related - Other |
98.7 | % | — | — | ||||||||||||||||||||||||
|
|
|
|
|
|
|
|||||||||||||||||||||||
| Total portfolio (5) |
89.7 | % | 61.4 | % | 56.4 | % | ||||||||||||||||||||||
|
|
|
|
|
|
|
|||||||||||||||||||||||
| Total portfolio weighted-average leased % (6) |
92.1 | % | 42.5 | % | 56.4 | % | ||||||||||||||||||||||
|
|
|
|
|
|||||||||||||||||||||||||
| (1) | Current annualized base rent is the monthly contractual rent as of the current quarter ended, or if rent has not yet commenced, the first monthly rent payment due at each rent commencement date, multiplied by 12 months. |
| (2) | Annualized base rent at expiration is the monthly contractual rent as of date of expiration of the applicable lease (not including any extension option(s)), multiplied by 12 months. |
| (3) | See page 24 for detail of the consolidated portfolio and page 34 for definitions of terms. |
| (4) | See page 26 for detail of the unconsolidated partnership portfolio. |
| (5) | Calculated based on leased square feet divided by total square feet. |
| (6) | Calculated based on gross book value for each asset multiplied by the percentage leased. |
21
PROPERTY LISTING - CONSOLIDATED PORTFOLIO
DECEMBER 31, 2012
| Property | Rentable Square |
Percent of Rentable |
Leased Square |
Percent Leased | ||||||||||||||||||||||||||
| Property |
Acquisition Date |
Status (1) | Buildings | Feet | Sq Ft | Feet | 12/31/12 | 9/30/12 | ||||||||||||||||||||||
| Boston | ||||||||||||||||||||||||||||||
| 1 |
Albany Street | May 31, 2005 | Stabilized | 2 | 75,003 | 0.6 | % | 75,003 | 100.0 | % | 100.0 | % | ||||||||||||||||||
| 2 |
320 Bent Street | December 14, 2011 | Stabilized | 1 | 195,198 | 1.5 | % | 191,576 | 98.1 | % | 98.1 | % | ||||||||||||||||||
| 3 |
301 Binney Street | December 14, 2011 | Stabilized | 1 | 417,290 | 3.3 | % | 403,381 | 96.7 | % | 74.4 | % | ||||||||||||||||||
| 4 |
301 Binney Street Garage | December 14, 2011 | Stabilized | 1 | 503 Stalls | n/a | 503 Stalls | 100.0 | % | 100.0 | % | |||||||||||||||||||
| 5 |
210 Broadway | February 9, 2012 | Lease Up | 1 | 64,812 | 0.5 | % | 32,842 | 50.7 | % | 29.7 | % | ||||||||||||||||||
| 6 |
Center for Life Science | Boston | November 17, 2006 | Stabilized | 1 | 704,159 | 5.9 | % | 695,976 | 98.8 | % | 98.9 | % | ||||||||||||||||||
| 7 |
Charles Street | April 7, 2006 | Stabilized | 1 | 47,912 | 0.4 | % | 47,912 | 100.0 | % | 100.0 | % | ||||||||||||||||||
| 8 |
Coolidge Avenue | April 5, 2005 | Lease Up | 1 | 37,684 | 0.3 | % | 29,490 | 78.3 | % | 78.3 | % | ||||||||||||||||||
| 9 |
21 Erie Street | May 31, 2005 | Stabilized | 1 | 48,627 | 0.4 | % | 48,627 | 100.0 | % | 100.0 | % | ||||||||||||||||||
| 10 |
40 Erie Street | May 31, 2005 | Stabilized | 1 | 100,854 | 0.8 | % | 100,854 | 100.0 | % | 100.0 | % | ||||||||||||||||||
| 11 |
47 Erie Street Parking Structure | May 31, 2005 | Stabilized | 1 | 447 Stalls | n/a | 447 Stalls | 100.0 | % | 100.0 | % | |||||||||||||||||||
| 12 |
Fresh Pond Research Park | April 5, 2005 | Stabilized | 6 | 90,702 | 0.7 | % | 89,176 | 98.3 | % | 98.3 | % | ||||||||||||||||||
| 13 |
50 Hampshire Street | February 9, 2012 | Stabilized | 1 | 183,052 | 1.4 | % | 183,052 | 100.0 | % | 100.0 | % | ||||||||||||||||||
| 14 |
60 Hampshire Street | February 9, 2012 | Stabilized | 1 | 39,014 | 0.3 | % | 39,014 | 100.0 | % | 100.0 | % | ||||||||||||||||||
| 15 |
Kendall Crossing Apartments | December 14, 2011 | Stabilized | 1 | 37 Apts. | n/a | 37 Apts. | 94.5 | % | 100.0 | % | |||||||||||||||||||
| 16 |
500 Kendall Street (Kendall D) | May 31, 2005 | Stabilized | 1 | 349,325 | 2.7 | % | 346,535 | 99.2 | % | 99.2 | % | ||||||||||||||||||
| 17 |
675 W. Kendall Street (Kendall A) | May 31, 2005 | Stabilized | 1 | 302,919 | 2.4 | % | 302,919 | 100.0 | % | 100.0 | % | ||||||||||||||||||
| 18 |
Sidney Street | May 31, 2005 | Stabilized | 1 | 191,904 | 1.5 | % | 191,904 | 100.0 | % | 100.0 | % | ||||||||||||||||||
| 19 |
Vassar Street | May 31, 2005 | Stabilized | 1 | 60,845 | 0.5 | % | 60,845 | 100.0 | % | 100.0 | % | ||||||||||||||||||
|
|
|
|
|
|
|
|
|
|
|
|
|
|||||||||||||||||||
| Total Boston | 25 | 2,909,300 | 23.2 | % | 2,839,106 | 97.6 | % | 93.9 | % | |||||||||||||||||||||
|
|
|
|
|
|
|
|
|
|
|
|
|
|||||||||||||||||||
| San Francisco | ||||||||||||||||||||||||||||||
| 20 |
Ardentech Court | November 18, 2004 | Stabilized | 1 | 55,588 | 0.4 | % | 55,588 | 100.0 | % | 100.0 | % | ||||||||||||||||||
| 21 |
Ardenwood Venture (2) | June 14, 2006 | Lease Up | 1 | 72,500 | 0.6 | % | 60,339 | 83.2 | % | 77.6 | % | ||||||||||||||||||
| 22 |
Bayshore Boulevard | August 17, 2004 | Stabilized | 3 | 183,344 | 1.4 | % | 183,344 | 100.0 | % | 100.0 | % | ||||||||||||||||||
| 23 |
Bridgeview Technology Park I | September 10, 2004 | Lease Up | 2 | 201,567 | 1.6 | % | 176,616 | 87.6 | % | 87.6 | % | ||||||||||||||||||
| 24 |
Bridgeview Technology Park II | March 16, 2005 | Lease Up | 1 | 50,400 | 0.4 | % | 28,714 | 57.0 | % | 57.0 | % | ||||||||||||||||||
| 25 |
550 Broadway Street | April 27, 2012 | Stabilized | 1 | 71,239 | 0.6 | % | 71,239 | 100.0 | % | 100.0 | % | ||||||||||||||||||
| 26 |
Dumbarton Circle | May 27, 2005 | Stabilized | 1 | 44,000 | 0.3 | % | 44,000 | 100.0 | % | 100.0 | % | ||||||||||||||||||
| 27 |
Gateway Business Park | October 26, 2010 | Stabilized | 6 | 284,013 | 2.2 | % | 268,048 | 94.4 | % | 99.7 | % | ||||||||||||||||||
| 28 |
Industrial Road | August 17, 2004 | Stabilized | 1 | 175,144 | 1.4 | % | 175,144 | 100.0 | % | 100.0 | % | ||||||||||||||||||
| 29 |
Kaiser Drive | August 25, 2005 | Lease Up | 1 | 87,953 | 0.7 | % | 49,915 | 56.8 | % | 56.8 | % | ||||||||||||||||||
| 30 |
Pacific Industrial Center | July 11, 2006 | Lease Up | 1 | 305,026 | 2.4 | % | 219,255 | 71.9 | % | 71.9 | % | ||||||||||||||||||
| 31 |
Pacific Research Center North | July 11, 2006 | Lease Up | 6 | 661,245 | 5.2 | % | 436,816 | 66.1 | % | 66.0 | % | ||||||||||||||||||
| 32 |
Pacific Research Center South | July 11, 2006 | Lease Up | 3 | 423,246 | 3.3 | % | 263,543 | 62.3 | % | 62.3 | % | ||||||||||||||||||
| 33 |
Science Center at Oyster Point | October 26, 2010 | Stabilized | 2 | 204,887 | 1.6 | % | 204,887 | 100.0 | % | 100.0 | % | ||||||||||||||||||
|
|
|
|
|
|
|
|
|
|
|
|
|
|||||||||||||||||||
| Total San Francisco | 30 | 2,820,152 | 22.1 | % | 2,237,448 | 79.3 | % | 79.7 | % | |||||||||||||||||||||
|
|
|
|
|
|
|
|
|
|
|
|
|
|||||||||||||||||||
| Maryland | ||||||||||||||||||||||||||||||
| 34 |
Beckley Street | December 17, 2004 | Stabilized | 1 | 77,225 | 0.6 | % | 77,225 | 100.0 | % | 100.0 | % | ||||||||||||||||||
| 35 |
9900 Belward Campus Drive | July 18, 2012 | Lease Up | 1 | 49,317 | 0.4 | % | 41,324 | 83.8 | % | 83.8 | % | ||||||||||||||||||
| 36 |
9901 Belward Campus Drive | July 18, 2012 | Stabilized | 1 | 57,152 | 0.4 | % | 57,110 | 99.9 | % | 99.9 | % | ||||||||||||||||||
| 37 |
9911 Belward Campus Drive | May 24, 2006 | Stabilized | 1 | 289,912 | 2.3 | % | 289,912 | 100.0 | % | 100.0 | % | ||||||||||||||||||
| 38 |
9920 Belward Campus Drive | May 8, 2007 | Stabilized | 1 | 51,181 | 0.4 | % | 51,181 | 100.0 | % | 100.0 | % | ||||||||||||||||||
| 39 |
9704 Medical Center Drive | May 3, 2010 | Stabilized | 1 | 122,600 | 1.0 | % | 122,600 | 100.0 | % | 100.0 | % | ||||||||||||||||||
| 40 |
9708-9714 Medical Center Drive | May 3, 2010 | Redevelopment | 3 | 92,124 | 0.7 | % | 16,067 | 17.4 | % | 5.9 | % | ||||||||||||||||||
| 41 |
1701 / 1711 Research Boulevard | May 9, 2011 | Redevelopment | 1 | 104,743 | 0.8 | % | 104,743 | 100.0 | % | 100.0 | % | ||||||||||||||||||
| 42 |
Shady Grove Road | May 24, 2006 | Stabilized | 4 | 635,058 | 5.0 | % | 635,058 | 100.0 | % | 100.0 | % | ||||||||||||||||||
| 43 |
Tributary Street | December 17, 2004 | Stabilized | 1 | 91,592 | 0.7 | % | 91,592 | 100.0 | % | 100.0 | % | ||||||||||||||||||
| 44 |
50 West Watkins Mill Road | May 7, 2010 | Lease Up | 1 | 57,410 | 0.5 | % | 20,000 | 34.8 | % | 34.8 | % | ||||||||||||||||||
| 45 |
55 / 65 West Watkins Mill Road | February 23, 2010 | Stabilized | 2 | 82,405 | 0.6 | % | 82,405 | 100.0 | % | 100.0 | % | ||||||||||||||||||
|
|
|
|
|
|
|
|
|
|
|
|
|
|||||||||||||||||||
| Total Maryland | 18 | 1,710,719 | 13.4 | % | 1,589,217 | 92.9 | % | 92.3 | % | |||||||||||||||||||||
|
|
|
|
|
|
|
|
|
|
|
|
|
|||||||||||||||||||
| San Diego | ||||||||||||||||||||||||||||||
| 46 |
Balboa Avenue | August 13, 2004 | Stabilized | 1 | 35,344 | 0.3 | % | 35,344 | 100.0 | % | 100.0 | % | ||||||||||||||||||
| 47 |
Bernardo Center Drive | August 13, 2004 | Stabilized | 1 | 61,286 | 0.5 | % | 61,286 | 100.0 | % | 100.0 | % | ||||||||||||||||||
| 48 |
Coast 9 | October 15, 2010 | Lease Up | 8 | 164,074 | 1.3 | % | 123,528 | 75.3 | % | 82.9 | % | ||||||||||||||||||
| 49 |
4570 Executive Drive | September 17, 2010 | Lease Up | 1 | 125,219 | 1.0 | % | 106,757 | 85.3 | % | 85.3 | % | ||||||||||||||||||
| 50 |
Faraday Avenue | September 19, 2005 | Stabilized | 1 | 28,704 | 0.2 | % | 28,704 | 100.0 | % | 100.0 | % | ||||||||||||||||||
| 51 |
Gazelle Court | March 30, 2010 | Stabilized | 1 | 176,000 | 1.4 | % | 176,000 | 100.0 | % | 100.0 | % | ||||||||||||||||||
22
PROPERTY LISTING - CONSOLIDATED PORTFOLIO
DECEMBER 31, 2012
| Property | Rentable Square |
Percent of Rentable |
Leased Square |
Percent Leased | ||||||||||||||||||||||||||
| Property |
Acquisition Date |
Status (1) | Buildings | Feet | Sq Ft | Feet | 12/31/12 | 9/30/12 | ||||||||||||||||||||||
| San Diego (Continued) | ||||||||||||||||||||||||||||||
| 52 | 3525 John Hopkins Court | December 28, 2010 | Stabilized | 1 | 48,306 | 0.4 | % | 48,306 | 100.0 | % | 100.0 | % | ||||||||||||||||||
| 53 | 3545-3575 John Hopkins Court | August 16, 2006 | Lease Up | 1 | 72,192 | 0.6 | % | 61,106 | 84.6 | % | 75.0 | % | ||||||||||||||||||
| 54 | 6114-6154 Nancy Ridge Drive | May 2, 2007 | Stabilized | 3 | 196,557 | 1.5 | % | 196,557 | 100.0 | % | 100.0 | % | ||||||||||||||||||
| 55 | 6122-6126 Nancy Ridge Drive | April 25, 2012 | Stabilized | 1 | 68,000 | 0.5 | % | 68,000 | 100.0 | % | 100.0 | % | ||||||||||||||||||
| 56 | 6828 Nancy Ridge Drive | April 21, 2005 | Stabilized | 1 | 42,138 | 0.3 | % | 42,138 | 100.0 | % | 100.0 | % | ||||||||||||||||||
| 57 | Pacific Center Boulevard | August 24, 2007 | Stabilized | 2 | 66,745 | 0.5 | % | 66,745 | 100.0 | % | 100.0 | % | ||||||||||||||||||
| 58 | Road to the Cure | December 14, 2006 | Lease Up | 1 | 67,998 | 0.5 | % | 37,219 | 54.7 | % | 54.7 | % | ||||||||||||||||||
| 59 | San Diego Science Center | October 21, 2004 | Lease Up | 1 | 105,364 | 0.8 | % | 76,818 | 72.9 | % | 63.6 | % | ||||||||||||||||||
| 60 | 10240 Science Center Drive | September 23, 2010 | Stabilized | 1 | 49,347 | 0.4 | % | 49,347 | 100.0 | % | 100.0 | % | ||||||||||||||||||
| 61 | 10255 Science Center Drive | September 24, 2004 | Stabilized | 1 | 53,740 | 0.4 | % | 53,740 | 100.0 | % | 100.0 | % | ||||||||||||||||||
| 62 | Sorrento Plaza | December 18, 2010 | Stabilized | 2 | 31,184 | 0.2 | % | 31,184 | 100.0 | % | 100.0 | % | ||||||||||||||||||
| 63 | Sorrento Valley Boulevard | December 7, 2006 | Stabilized | 1 | 54,924 | 0.4 | % | 54,924 | 100.0 | % | 100.0 | % | ||||||||||||||||||
| 64 | 11388 Sorrento Valley Road | September 10, 2010 | Stabilized | 1 | 35,940 | 0.3 | % | 35,940 | 100.0 | % | 100.0 | % | ||||||||||||||||||
| 65 | Summers Ridge | June 8, 2012 | Stabilized | — | — | n/a | — | 100.0 | % | 100.0 | % | |||||||||||||||||||
| 66 | Torreyana Road | March 22, 2007 | Stabilized | 1 | 81,204 | 0.6 | % | 81,204 | 100.0 | % | 100.0 | % | ||||||||||||||||||
| 67 | 9865 Towne Centre Drive | August 12, 2004 | Stabilized | 2 | 94,866 | 0.7 | % | 94,866 | 100.0 | % | 100.0 | % | ||||||||||||||||||
| 68 | 9885 Towne Centre Drive | August 12, 2004 | Stabilized | 2 | 104,870 | 0.8 | % | 104,870 | 100.0 | % | 100.0 | % | ||||||||||||||||||
| 69 | Waples Street | March 1, 2005 | Stabilized | 1 | 50,055 | 0.4 | % | 50,055 | 100.0 | % | 100.0 | % | ||||||||||||||||||
| 70 | Wateridge Circle | November 1, 2011 | Lease Up | 3 | 106,490 | 0.8 | % | 82,536 | 77.5 | % | 77.5 | % | ||||||||||||||||||
|
|
|
|
|
|
|
|
|
|
|
|
|
|||||||||||||||||||
| Total San Diego | 39 | 1,920,547 | 14.8 | % | 1,767,174 | 92.0 | % | 91.8 | % | |||||||||||||||||||||
|
|
|
|
|
|
|
|
|
|
|
|
|
|||||||||||||||||||
| New York / New Jersey | ||||||||||||||||||||||||||||||
| 71 | Ardsley Park | June 23, 2011 | Stabilized | 5 | 160,500 | 1.3 | % | 160,500 | 100.0 | % | 100.0 | % | ||||||||||||||||||
| 72 | Graphics Drive | March 17, 2005 | Lease Up | 1 | 72,300 | 0.6 | % | 46,386 | 64.2 | % | 64.2 | % | ||||||||||||||||||
| 73 | Landmark at Eastview | August 12, 2004 | Lease Up | 5 | 783,269 | 6.2 | % | 620,480 | 79.2 | % | 77.3 | % | ||||||||||||||||||
| 74 | Landmark at Eastview II | August 12, 2004 | Stabilized | 3 | 360,520 | 2.8 | % | 360,520 | 100.0 | % | 100.0 | % | ||||||||||||||||||
| 75 | One Research Way | May 31, 2006 | Lease Up | 1 | 49,421 | 0.4 | % | — | — | — | ||||||||||||||||||||
|
|
|
|
|
|
|
|
|
|
|
|
|
|||||||||||||||||||
| Total New York / New Jersey | 15 | 1,426,010 | 11.3 | % | 1,187,886 | 83.3 | % | 82.3 | % | |||||||||||||||||||||
|
|
|
|
|
|
|
|
|
|
|
|
|
|||||||||||||||||||
| Pennsylvania | ||||||||||||||||||||||||||||||
| 76 | Eisenhower Road | August 13, 2004 | Stabilized | 1 | 27,750 | 0.2 | % | 27,750 | 100.0 | % | 100.0 | % | ||||||||||||||||||
| 77 | George Patterson Boulevard | October 28, 2005 | Stabilized | 1 | 71,500 | 0.6 | % | 71,500 | 100.0 | % | 100.0 | % | ||||||||||||||||||
| 78 | King of Prussia | August 11, 2004 | Stabilized | 5 | 374,387 | 2.9 | % | 374,387 | 100.0 | % | 100.0 | % | ||||||||||||||||||
| 79 | Phoenixville Pike | May 5, 2005 | Lease Up | 1 | 104,400 | 0.8 | % | 90,518 | 86.7 | % | 86.7 | % | ||||||||||||||||||
| 80 | Spring Mill Drive | July 20, 2006 | Stabilized | 1 | 76,561 | 0.6 | % | 76,561 | 100.0 | % | 100.0 | % | ||||||||||||||||||
| 81 | 900 Uniqema Boulevard | January 13, 2006 | Stabilized | 1 | 11,293 | 0.1 | % | 11,293 | 100.0 | % | 100.0 | % | ||||||||||||||||||
| 82 | 1000 Uniqema Boulevard | September 30, 2005 | Lease Up | 1 | 59,821 | 0.5 | % | — | — | — | ||||||||||||||||||||
|
|
|
|
|
|
|
|
|
|
|
|
|
|||||||||||||||||||
| Total Pennsylvania | 11 | 725,712 | 5.7 | % | 652,009 | 89.8 | % | 89.8 | % | |||||||||||||||||||||
|
|
|
|
|
|
|
|
|
|
|
|
|
|||||||||||||||||||
| Seattle | ||||||||||||||||||||||||||||||
| 83 | Elliott Avenue | August 24, 2004 | Lease Up | 1 | 151,194 | 1.2 | % | 90,222 | 59.7 | % | 42.6 | % | ||||||||||||||||||
| 84 | 530 Fairview Avenue | January 12, 2006 | Stabilized | 1 | 96,305 | 0.8 | % | 96,305 | 100.0 | % | 100.0 | % | ||||||||||||||||||
| 85 | Monte Villa Parkway | August 17, 2004 | Lease Up | 1 | 51,000 | 0.4 | % | 19,108 | 37.5 | % | 37.5 | % | ||||||||||||||||||
| 86 | 217th Place | November 21, 2006 | Lease Up | 1 | 67,799 | 0.5 | % | 42,628 | 62.9 | % | 62.9 | % | ||||||||||||||||||
|
|
|
|
|
|
|
|
|
|
|
|
|
|||||||||||||||||||
| Total Seattle | 4 | 366,298 | 2.9 | % | 248,263 | 67.8 | % | 60.7 | % | |||||||||||||||||||||
|
|
|
|
|
|
|
|
|
|
|
|
|
|||||||||||||||||||
| University Related - Other | ||||||||||||||||||||||||||||||
| 87 | Granta Park | June 12, 2012 | Stabilized | 11 | 472,234 | 3.7 | % | 469,686 | 99.5 | % | 99.5 | % | ||||||||||||||||||
| 88 | Paramount Parkway | July 20, 2010 | Stabilized | 1 | 61,603 | 0.5 | % | 61,603 | 100.0 | % | 100.0 | % | ||||||||||||||||||
| 89 | Patriot Drive | December 17, 2010 | Lease Up | 1 | 48,394 | 0.4 | % | 39,691 | 82.0 | % | 82.0 | % | ||||||||||||||||||
| 90 | Trade Centre Avenue | August 9, 2006 | Stabilized | 2 | 78,023 | 0.6 | % | 78,023 | 100.0 | % | 100.0 | % | ||||||||||||||||||
| 91 | Walnut Street | July 7, 2006 | Stabilized | 4 | 149,984 | 1.2 | % | 149,984 | 100.0 | % | 100.0 | % | ||||||||||||||||||
| 92 | Weston Parkway | December 17, 2010 | Stabilized | 1 | 30,589 | 0.2 | % | 30,589 | 100.0 | % | 100.0 | % | ||||||||||||||||||
|
|
|
|
|
|
|
|
|
|
|
|
|
|||||||||||||||||||
| Total University Related - Other | 20 | 840,827 | 6.6 | % | 829,576 | 98.7 | % | 98.7 | % | |||||||||||||||||||||
|
|
|
|
|
|
|
|
|
|
|
|
|
|||||||||||||||||||
| Total | 162 | 12,719,565 | 100.0 | % | 11,350,679 | 89.2 | % | 88.1 | % | |||||||||||||||||||||
|
|
|
|
|
|
|
|
|
|
|
|
|
|||||||||||||||||||
| (1) | For a definition of Property Status, see page 35. |
| (2) | The Company owns 87.5% of the limited liability company that owns the Ardenwood Venture property. |
23
REDEVELOPMENT, PRE-DEVELOPMENT AND OTHER CAPITAL IMPROVEMENTS
DECEMBER 31, 2012
(Dollars in thousands)
| Property |
Market |
Rentable |
Percent |
Investment |
Estimated |
Estimated |
||||||||||||||||||
| Redevelopment: |
||||||||||||||||||||||||
| 9708-9714 Medical Center Drive |
Maryland | 92,124 | 17.4 | % | $ | 29,400 | $ | 29,400 | Q1 2013 | |||||||||||||||
| 1701 / 1711 Research Blvd |
Maryland | 104,743 | 100.0 | % | 13,300 | 28,200 | Q4 2013 | |||||||||||||||||
|
|
|
|
|
|
|
|
|
|||||||||||||||||
| Total / weighted-average |
196,867 | 61.4 | % | $ | 42,700 | $ | 57,600 | |||||||||||||||||
| Other Capital Improvements (4) |
$ | 71,800 | ||||||||||||||||||||||
| Pre-Development: |
||||||||||||||||||||||||
| Eccles Avenue |
San Francisco | 260,000 | — | $ | 29,100 | |||||||||||||||||||
| 4775 / 4785 Executive Drive |
San Diego | 275,000 | — | 29,600 | ||||||||||||||||||||
| 500 Fairview Avenue |
Seattle | 108,000 | — | 1,600 | ||||||||||||||||||||
| 450 Kendall Street (Kendall G) |
Boston | 53,000 | — | 10,100 | ||||||||||||||||||||
|
|
|
|
|
|
|
|||||||||||||||||||
| Total / weighted-average |
696,000 | — | $ | 70,400 | ||||||||||||||||||||
|
|
|
|||||||||||||||||||||||
| Total |
$ | 184,900 | ||||||||||||||||||||||
|
|
|
|||||||||||||||||||||||
| Additional Development Potential: | Estimated | Capitalized Interest | ||||||||||||||||||||||
| Developable | 3 Mo. Ended | |||||||||||||||||||||||
| Market |
Square Feet |
12/31/12 (5) |
||||||||||||||||||||||
| Boston |
50,000 |
|
Redevelopment |
|
$ | 630 | ||||||||||||||||||
| San Francisco |
1,346,000 |
|
Other Capital Improvements (4) |
|
742 | |||||||||||||||||||
| Maryland |
674,000 |
|
Pre-Development |
|
896 | |||||||||||||||||||
|
|
|
|||||||||||||||||||||||
| New York / New Jersey |
964,000 |
|
Total |
|
$ | 2,268 | ||||||||||||||||||
|
|
|
|||||||||||||||||||||||
| Pennsylvania |
103,000 | |||||||||||||||||||||||
| Seattle |
40,000 | |||||||||||||||||||||||
| University Related - Other |
138,000 | |||||||||||||||||||||||
|
|
|
|||||||||||||||||||||||
| Total |
3,315,000 | |||||||||||||||||||||||
| Total Development Potential |
||||||||||||||||||||||||
|
|
|
|||||||||||||||||||||||
| (including Pre-Development) |
4,011,000 | |||||||||||||||||||||||
|
|
|
|||||||||||||||||||||||
| (1) | Includes amounts paid for acquiring the property, landlord improvements, and tenant improvement allowances, but for Redevelopment properties excludes any amounts accrued, and payroll, interest or operating expenses capitalized, through December 31, 2012. |
| (2) | Excludes costs associated with speculative leasing. |
| (3) | Management’s estimate of the time in which construction is substantially completed. A project is considered substantially complete and held available for occupancy upon the completion of tenant improvements, but no later than one year from cessation of major construction activity. |
| (4) | Includes improvements on operating properties, including major tenant improvement projects on properties which are not considered to be in Redevelopment or Pre-development during the three months ended December 31, 2012. |
| (5) | Interest was capitalized at an average rate of 5.22% during the three months ended December 31, 2012. |
24
CAPITAL EXPENDITURES
DECEMBER 31, 2012
(In thousands)
| Three Months Ended | ||||||||||||||||||||
| 12/31/12 | 9/30/12 | 6/30/12 | 3/31/12 | 12/31/11 | ||||||||||||||||
| Development / Pre-Development |
$ | 1,832 | $ | 1,540 | $ | 1,582 | $ | 443 | $ | 716 | ||||||||||
| Redevelopment |
1,411 | 2,429 | 8,117 | 11,006 | 6,316 | |||||||||||||||
| Tenant improvements - first generation (1) |
11,831 | 19,727 | 17,184 | 15,083 | 4,123 | |||||||||||||||
| Recurring capital expenditures and second generation tenant improvements (1) (2) |
5,738 | 2,739 | 1,716 | 4,629 | 3,201 | |||||||||||||||
| Other capital |
7,853 | 4,067 | 9,034 | 10,909 | 11,558 | |||||||||||||||
|
|
|
|
|
|
|
|
|
|
|
|||||||||||
| Total capital expenditures |
$ | 28,665 | $ | 30,502 | $ | 37,633 | $ | 42,070 | $ | 25,914 | ||||||||||
|
|
|
|
|
|
|
|
|
|
|
|||||||||||
| (1) | For definitions of first and second generation leases, see page 35. |
| (2) | Includes revenue enhancing and non-revenue enhancing recurring capital expenditures. Excludes first generation tenant improvements. For a definition of recurring capital expenditures, see page 35. |
25
PROPERTY LISTING – UNCONSOLIDATED PARTNERSHIPS
DECEMBER 31, 2012
(Dollars in thousands)
| Rentable | Leased | |||||||||||||||||||||||||||||||
| Property | Square | Square | Percent Leased | |||||||||||||||||||||||||||||
| Property |
Acquisition Date |
Status (1) | Buildings | Feet | Feet | 12/31/12 | 9/30/12 | Market | ||||||||||||||||||||||||
| McKellar Court |
||||||||||||||||||||||||||||||||
| McKellar Court |
September 30, 2004 | Stabilized | 1 | 72,863 | 72,863 | 100.0 | % | 100.0 | % | San Diego | ||||||||||||||||||||||
| PREI |
||||||||||||||||||||||||||||||||
| 650 E. Kendall Street (Kendall B) |
April 4, 2007 | Lease Up | 1 | 280,000 | 126,065 | 45.0 | % | 45.0 | % | Boston | ||||||||||||||||||||||
| 350 E. Kendall Street Garage (Kendall F) |
April 4, 2007 | Stabilized | 1 | 1,409 Stalls | 1,409 Stalls | 100.0 | % | 100.0 | % | Boston | ||||||||||||||||||||||
| McKellar Court (2) |
PREI | Total | ||||||||||
| Total assets |
$ | 14,060 | $ | 249,944 | $ | 264,004 | ||||||
| Total debt (3) |
10,280 | 138,975 | 149,255 | |||||||||
| Current annualized base rent |
1,920 | 6,884 | 8,804 | |||||||||
| BioMed’s net investment in unconsolidated partnerships |
$ | 12,189 | $ | 20,178 | $ | 32,367 | ||||||
| BioMed’s pro rata share of debt |
— | 27,795 | 27,795 | |||||||||
| BioMed ownership percentage |
22 | % | 20 | % | 20 | % | ||||||
| (1) | For a definition of Property Status, see page 35. |
| (2) | The Company owns a general partnership interest in the limited partnership that owns this property, which entitles it to 75% of the gains upon a sale of the property and 22% of the operating cash flows. |
| (3) | McKellar Court’s debt is payable to BioMed Realty, L.P. and is included in investments in unconsolidated partnerships on the Company’s consolidated balance sheet. |
26
LEASE EXPIRATIONS
DECEMBER 31, 2012
The weighted-average remaining lease term is 7.3 years for the total portfolio.
| Current (1) | Expiration (2) | |||||||||||||||||||||||||||||||
| Expiration |
Leased Square Feet |
Percent of Leased Square Feet |
Annualized Base Rent |
Percent of Annualized Base Rent |
Annualized Base Rent per Leased Square Feet |
Annualized Base Rent |
Percent of Annualized Base Rent |
Annualized Base Rent per Leased Square Feet |
||||||||||||||||||||||||
| (In thousands) | (In thousands) | |||||||||||||||||||||||||||||||
| Month-to-month |
5,667 | — | $ | 148 | — | $ | 26.12 | $ | 148 | — | $ | 26.12 | ||||||||||||||||||||
| First quarter 2013 |
289,699 | 2.5 | % | 12,687 | 2.9 | % | 43.79 | 12,734 | 2.5 | % | 43.96 | |||||||||||||||||||||
| Second quarter 2013 |
162,457 | 1.4 | % | 4,958 | 1.1 | % | 30.52 | 4,976 | 1.0 | % | 30.63 | |||||||||||||||||||||
| Third quarter 2013 |
232,835 | 2.0 | % | 10,712 | 2.4 | % | 46.01 | 10,741 | 2.1 | % | 46.13 | |||||||||||||||||||||
| Fourth quarter 2013 |
42,887 | 0.4 | % | 720 | 0.2 | % | 16.79 | 720 | 0.1 | % | 16.79 | |||||||||||||||||||||
|
|
|
|
|
|
|
|
|
|
|
|
|
|
|
|
|
|||||||||||||||||
| 2013 |
727,878 | 6.3 | % | 29,077 | 6.6 | % | 39.95 | 29,171 | 5.7 | % | 40.08 | |||||||||||||||||||||
| 2014 |
742,266 | 6.4 | % | 21,584 | 4.9 | % | 29.08 | 21,748 | 4.3 | % | 29.30 | |||||||||||||||||||||
| 2015 |
488,424 | 4.2 | % | 16,224 | 3.7 | % | 33.22 | 16,937 | 3.3 | % | 34.68 | |||||||||||||||||||||
| 2016 |
1,005,967 | 8.7 | % | 37,246 | 8.5 | % | 37.03 | 40,105 | 7.9 | % | 39.87 | |||||||||||||||||||||
| 2017 |
459,935 | 4.0 | % | 13,535 | 3.1 | % | 29.43 | 15,372 | 3.0 | % | 33.42 | |||||||||||||||||||||
| 2018 |
1,714,946 | 14.8 | % | 71,716 | 16.3 | % | 41.82 | 78,494 | 15.5 | % | 45.77 | |||||||||||||||||||||
| 2019 |
600,955 | 5.2 | % | 18,625 | 4.2 | % | 30.99 | 20,881 | 4.1 | % | 34.75 | |||||||||||||||||||||
| 2020 |
797,026 | 6.9 | % | 31,498 | 7.2 | % | 39.52 | 31,491 | 6.2 | % | 39.51 | |||||||||||||||||||||
| 2021 |
679,533 | 5.9 | % | 18,906 | 4.3 | % | 27.82 | 21,913 | 4.3 | % | 32.25 | |||||||||||||||||||||
| 2022 |
587,791 | 5.1 | % | 14,135 | 3.2 | % | 24.05 | 17,792 | 3.5 | % | 30.27 | |||||||||||||||||||||
| Thereafter |
3,739,219 | 32.5 | % | 166,441 | 38.0 | % | 44.51 | 212,765 | 42.2 | % | 56.90 | |||||||||||||||||||||
|
|
|
|
|
|
|
|
|
|
|
|
|
|
|
|
|
|||||||||||||||||
| Total / weighted-average |
11,549,607 | 100.0 | % | $ | 439,135 | 100.0 | % | $ | 38.02 | $ | 506,817 | 100.0 | % | $ | 43.88 | |||||||||||||||||
|
|
|
|
|
|
|
|
|
|
|
|
|
|
|
|
|
|||||||||||||||||
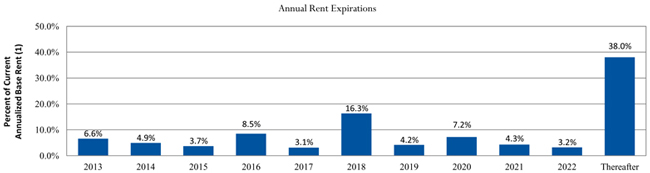
| (1) | Current annualized base rent is the monthly contractual rent as of the current quarter ended, or if rent has not yet commenced, the first monthly rent payment due at each rent commencement date, multiplied by 12 months. |
| (2) | Annualized base rent at expiration is the monthly contractual rent as of the date of expiration of the applicable lease (not including any extension option(s)), multiplied by 12 months. |
27
EXPIRATIONS BY MARKET
DECEMBER 31, 2012
| Leased Square Feet | ||||||||||||||||||||||||||||||||||||
| Expiration |
Boston | San Francisco | Maryland | San Diego | NY/NJ | Pennsylvania | Seattle | University/Other | Total | |||||||||||||||||||||||||||
| Month-to-month |
— | — | 1,790 | 3,247 | 630 | — | — | — | 5,667 | |||||||||||||||||||||||||||
| 2013 |
210,347 | 209,879 | 11,839 | 185,665 | 22,274 | 61,703 | 24,673 | 1,498 | 727,878 | |||||||||||||||||||||||||||
| 2014 |
28,019 | 75,784 | 67,946 | 66,301 | 63,525 | 407,961 | — | 32,730 | 742,266 | |||||||||||||||||||||||||||
| 2015 |
36,527 | 73,484 | 7,546 | 288,417 | — | 44,382 | — | 38,068 | 488,424 | |||||||||||||||||||||||||||
| 2016 |
328,024 | 239,158 | 4,721 | 35,716 | 40,687 | 31,166 | 36,885 | 289,610 | 1,005,967 | |||||||||||||||||||||||||||
| 2017 |
87,784 | 119,923 | 95,747 | 80,398 | 64,693 | — | 11,390 | — | 459,935 | |||||||||||||||||||||||||||
| 2018 |
1,135,297 | 153,639 | 13,014 | 331,157 | 24,944 | — | 42,628 | 14,267 | 1,714,946 | |||||||||||||||||||||||||||
| 2019 |
23,115 | 133,571 | 186,550 | 81,204 | — | — | 49,664 | 126,851 | 600,955 | |||||||||||||||||||||||||||
| 2020 |
367,010 | 49,915 | 130,846 | 72,863 | 39,958 | — | — | 136,434 | 797,026 | |||||||||||||||||||||||||||
| 2021 |
16,634 | 250,306 | 39,505 | 8,365 | 132,933 | 71,500 | — | 160,290 | 679,533 | |||||||||||||||||||||||||||
| 2022 |
43,904 | 463,359 | — | 17,707 | 27,524 | 35,297 | — | — | 587,791 | |||||||||||||||||||||||||||
| Thereafter |
688,510 | 468,430 | 1,029,713 | 668,997 | 770,718 | — | 83,023 | 29,828 | 3,739,219 | |||||||||||||||||||||||||||
|
|
|
|
|
|
|
|
|
|
|
|
|
|
|
|
|
|
|
|||||||||||||||||||
| Total |
2,965,171 | 2,237,448 | 1,589,217 | 1,840,037 | 1,187,886 | 652,009 | 248,263 | 829,576 | 11,549,607 | |||||||||||||||||||||||||||
|
|
|
|
|
|
|
|
|
|
|
|
|
|
|
|
|
|
|
|||||||||||||||||||
28
10 LARGEST TENANTS
DECEMBER 31, 2012
BioMed’s properties were leased to 214 tenants.
| Tenant |
Leased Square Feet |
Percent of Leased Sq Ft |
Annualized Base Rent Current (1) |
Annualized Base Rent per Leased Sq Ft Current |
Percent of Annualized Base Rent Current Total Portfolio |
Lease Expiration |
||||||||||||||||||||
| (In thousands) | ||||||||||||||||||||||||||
| 1 |
GlaxoSmithKline plc (2) | 924,970 | 8.0 | % | $ | 44,483 | $ | 48.09 | 10.1 | % | June 2026 | |||||||||||||||
| 2 |
Vertex Pharmaceuticals Incorporated (3) | 685,286 | 5.9 | % | 34,260 | 49.99 | 7.8 | % | Multiple | |||||||||||||||||
| 3 |
Beth Israel Deaconess Medical Center, Inc. | 362,364 | 3.1 | % | 25,543 | 70.49 | 5.8 | % | July 2023 | |||||||||||||||||
| 4 |
Regeneron Pharmaceuticals, Inc. | 632,550 | 5.5 | % | 25,528 | 40.36 | 5.8 | % | July 2024 | |||||||||||||||||
| 5 |
Elan Pharmaceuticals, Inc. (4) | 382,977 | 3.3 | % | 24,807 | 64.77 | 5.6 | % | Multiple | |||||||||||||||||
| 6 |
Sanofi (5) | 418,003 | 3.6 | % | 19,470 | 46.58 | 4.4 | % | Multiple | |||||||||||||||||
| 7 |
Ironwood Pharmaceuticals, Inc. | 303,259 | 2.6 | % | 15,291 | 50.42 | 3.5 | % | February 2018 | |||||||||||||||||
| 8 |
Children’s Hospital Corporation (6) | 200,081 | 1.7 | % | 13,853 | 69.24 | 3.2 | % | May 2023 | |||||||||||||||||
| 9 |
Merck & Co., Inc. (7) | 175,893 | 1.5 | % | 9,343 | 53.12 | 2.1 | % | Multiple | |||||||||||||||||
| 10 |
Janssen Biotech, Inc. (Johnson & Johnson) | 374,387 | 3.2 | % | 9,002 | 24.04 | 2.0 | % | April 2014 | |||||||||||||||||
|
|
|
|
|
|
|
|
|
|
|
|||||||||||||||||
| Total / weighted-average (8) | 4,459,770 | 38.4 | % | $ | 221,580 | $ | 49.68 | 50.3 | % | |||||||||||||||||
|
|
|
|
|
|
|
|
|
|
|
|||||||||||||||||
| (1) | Based on current annualized base rent. Current annualized base rent is the monthly contractual rent as of the current quarter ended, or if rent has not yet commenced, the first monthly rent payment due at each rent commencement date, multiplied by 12 months. |
| (2) | The Company’s tenant is Human Genome Sciences (HGS), a wholly owned subsidiary of GlaxoSmithKline plc (GSK). |
| (3) | 81,204 square feet are leased with a subsidiary of Vertex Pharmaceuticals Incorporated. 292,758 square feet expire January 2016, 20,608 square feet expire May 2017, 290,716 square feet expire May 2018 and 81,204 square feet expire January 2019. |
| (4) | 122,992 square feet expire January 2013, 55,098 square feet expire December 2014, 115,888 square feet expire April 2024 and 88,999 square feet expire February 2025. |
| (5) | 343,000 square feet expire August 2018 and 75,003 square feet expire October 2018. |
| (6) | This tenant guarantees rent on 49,866 square feet leased at the Center for Life Science| Boston. |
| (7) | This tenant guarantees rent on 30,589 square feet leased at Weston Parkway. 145,304 square feet expire September 2013 and 30,589 square feet expire January 2014. |
| (8) | Without regard to any early lease terminations and/or renewal options. |
29
SAME PROPERTY ANALYSIS
DECEMBER 31, 2012
(Dollars in thousands)
| Three Months Ended | ||||||||||||
| 12/31/12 | 12/31/11 | Percent Change | ||||||||||
| Total Same Property Portfolio (1) |
||||||||||||
| Rentable square feet |
11,603,751 | 11,603,751 | ||||||||||
| Percent of total portfolio |
88.8 | % | 96.2 | % | ||||||||
| Percent leased |
88.1 | % | 82.4 | % | ||||||||
| Revenues: |
||||||||||||
| Rental |
$ | 92,975 | $ | 88,445 | 5.1 | % | ||||||
| Tenant recoveries |
31,176 | 29,611 | 5.3 | % | ||||||||
|
|
|
|
|
|
|
|||||||
| Total revenues |
124,151 | 118,056 | 5.2 | % | ||||||||
| Expenses: |
||||||||||||
| Rental operations |
36,101 | 35,303 | 2.3 | % | ||||||||
|
|
|
|
|
|
|
|||||||
| Same property net operating income (2) |
$ | 88,050 | $ | 82,753 | 6.4 | % | ||||||
|
|
|
|
|
|
|
|||||||
| Less straight line rents, fair-value lease revenue, lease incentive revenue, and bad debt expense |
(3,577 | ) | (3,140 | ) | 13.9 | % | ||||||
|
|
|
|
|
|
|
|||||||
| Same property net operating income - cash basis (2) (3) |
$ | 84,473 | $ | 79,613 | 6.1 | % | ||||||
|
|
|
|
|
|
|
|||||||
| Rental revenue - cash basis (3) |
$ | 88,910 | $ | 85,059 | 4.5 | % | ||||||
|
|
|
|
|
|
|
|||||||
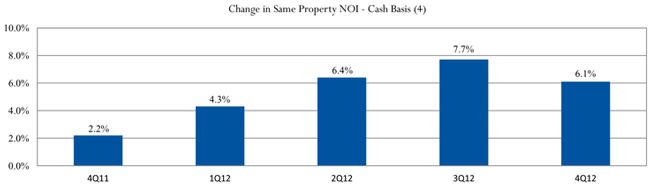
| (1) | The same property portfolio includes properties in the total portfolio that were stabilized or in lease up throughout the full quarter in both the current year and the prior year. |
| (2) | For a definition and discussion of net operating income, see page 34. For a quantitative reconciliation of net operating income to net income in accordance with GAAP, see page 15. |
| (3) | Represents rents on a “cash-on-cash” basis. |
| (4) | Compared to the same period in the prior year. |
30
ACQUISITIONS / DISPOSITIONS
DECEMBER 31, 2012
| Acquisitions Detail for 2012: |
Market |
Closing Date | Rentable Square Feet (1) |
Investment | Percent Leased at Acquisition |
|||||||||||
| Property |
||||||||||||||||
| (In thousands) | ||||||||||||||||
| First Quarter 2012 |
||||||||||||||||
| Cambridge Place (2) |
Boston | February 9, 2012 | 286,878 | $ | 119,000 | 80.2 | % | |||||||||
|
|
|
|
|
|
|
|||||||||||
| First quarter total |
286,878 | $ | 119,000 | 80.2 | % | |||||||||||
|
|
|
|
|
|
|
|||||||||||
| Second Quarter 2012 |
||||||||||||||||
| 6122-6126 Nancy Ridge Drive |
San Diego | April 25, 2012 | 68,000 | $ | 20,000 | 100.0 | % | |||||||||
| 550 Broadway Street |
San Francisco | April 27, 2012 | 71,239 | 28,000 | 100.0 | % | ||||||||||
| Summers Ridge (3) |
San Diego | June 8, 2012 | — | 47,184 | 100.0 | % | ||||||||||
| Granta Park |
University Related - Other | June 12, 2012 | 472,234 | 196,044 | 99.5 | % | ||||||||||
|
|
|
|
|
|
|
|||||||||||
| Second quarter total |
611,473 | $ | 291,228 | 99.6 | % | |||||||||||
|
|
|
|
|
|
|
|||||||||||
| Third Quarter 2012 |
||||||||||||||||
| 9900/9901 Belward Campus Drive |
Maryland | July 18, 2012 | 106,469 | $ | 26,170 | 92.5 | % | |||||||||
|
|
|
|
|
|
|
|||||||||||
| Third quarter total |
106,469 | $ | 26,170 | 92.5 | % | |||||||||||
|
|
|
|
|
|
|
|||||||||||
| Fourth Quarter 2012 |
||||||||||||||||
| None |
||||||||||||||||
| Total 2012 Acquisitions |
1,004,820 | $ | 436,398 | 93.3 | % | |||||||||||
|
|
|
|
|
|
|
|||||||||||
| Dispositions Detail for 2012: |
Market |
Closing Date | Rentable Square Feet (1) |
Gross Proceeds |
||||||||||||
| Property |
||||||||||||||||
| (In thousands) | ||||||||||||||||
| Second Quarter 2012 |
||||||||||||||||
| Forbes Boulevard |
San Francisco | April 27, 2012 | 240,000 | $ | 28,000 | |||||||||||
|
|
|
|
|
|||||||||||||
| Second quarter total |
240,000 | $ | 28,000 | |||||||||||||
|
|
|
|
|
|||||||||||||
| Total 2012 Dispositions |
240,000 | $ | 28,000 | |||||||||||||
|
|
|
|
|
|||||||||||||
| (1) | Rentable square feet at the time of acquisition or disposition. |
| (2) | Includes 210 Broadway, 50 Hampshire Street and 60 Hampshire Street properties. |
| (3) | Consists of two adjacent development sites. Concurrent with the acquisition, the Company signed a 20-year ground lease with Shire Regenerative Medicine, a subsidiary of Shire plc. |
31
LEASING ACTIVITY (1)
DECEMBER 31, 2012
| Leased Square Feet |
Current Annualized Base Rent per Leased Sq Ft |
Pre-Leased Square Feet |
Current Annualized Base Rent per Pre-Leased Sq Ft |
|||||||||||||
| Leased Square Feet as of September 30, 2012 |
11,405,091 | 55,565 | ||||||||||||||
| Expirations |
(464,913 | ) | $ | 40.46 | ||||||||||||
| Pre-leased delivery |
25,049 | 21.52 | (25,049 | ) | $ | 21.52 | ||||||||||
| Renewals, amendments, and extensions |
368,299 | 40.80 | ||||||||||||||
| New leases - 1st generation (2) |
149,987 | 41.06 | — | — | ||||||||||||
| New leases - 2nd generation (2) |
66,094 | 21.63 | 40,495 | 25.11 | ||||||||||||
|
|
|
|
|
|||||||||||||
| Leased Square Feet as of December 31, 2012 |
11,549,607 | 71,011 | ||||||||||||||
|
|
|
|
|
|||||||||||||
| Three Months Ended | ||||||||||||||||||||
| Leased Square Feet |
12/31/12 | 9/30/12 | 6/30/12 | 3/31/12 | 12/31/11 | |||||||||||||||
| Renewals, amendments, and extensions |
368,299 | 176,655 | 87,383 | 70,894 | 112,795 | |||||||||||||||
| New leases |
256,576 | 190,705 | 263,432 | 395,365 | 141,147 | |||||||||||||||
|
|
|
|
|
|
|
|
|
|
|
|||||||||||
| Gross Leasing Activity |
624,875 | 367,360 | 350,815 | 466,259 | 253,942 | |||||||||||||||
|
|
|
|
|
|
|
|
|
|
|
|||||||||||
| Net Absorption |
144,516 | 115,493 | 186,911 | 210,313 | 66,673 | |||||||||||||||
|
|
|
|
|
|
|
|
|
|
|
|||||||||||
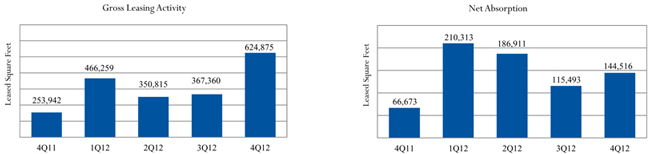
| (1) | Leasing activity for leases signed during the periods presented, which may be different than the period of actual occupancy. |
| (2) | For definitions of first and second generation leases, see page 35. |
32
TENANT IMPROVEMENTS, LEASING COMMISSIONS AND TENANT CONCESSIONS
DECEMBER 31, 2012
| Three Months Ended | ||||||||||||||||||||
| 12/31/12 | 9/30/12 | 6/30/12 | 3/31/12 | 12/31/11 | ||||||||||||||||
| Renewals, Amendments, and Extensions (1) |
||||||||||||||||||||
| Number of renewals |
17 | 6 | 7 | 6 | 7 | |||||||||||||||
| Square feet |
368,299 | 176,655 | 87,383 | 70,894 | 112,795 | |||||||||||||||
| Tenant improvement costs per square foot (2) |
$ | 1.23 | $ | 21.68 | $ | 0.17 | $ | 10.31 | $ | — | ||||||||||
| Leasing commission costs per square foot (2) |
3.54 | 6.23 | 1.15 | 2.99 | 1.96 | |||||||||||||||
| Tenant concession costs per square foot (2) (3) |
17.01 | 2.60 | 0.24 | 7.99 | 0.24 | |||||||||||||||
|
|
|
|
|
|
|
|
|
|
|
|||||||||||
| Total tenant improvement, leasing commission, and tenant concession costs psf |
$ | 21.78 | $ | 30.51 | $ | 1.56 | $ | 21.29 | $ | 2.20 | ||||||||||
|
|
|
|
|
|
|
|
|
|
|
|||||||||||
| New Leases - 1st Generation (4) |
||||||||||||||||||||
| Number of leases |
5 | 8 | 8 | 8 | 5 | |||||||||||||||
| Square feet |
149,987 | 100,992 | 219,552 | 319,947 | 57,783 | |||||||||||||||
| Tenant improvement costs per square foot (2) |
$ | 61.97 | $ | 1.14 | $ | 118.40 | $ | 18.98 | $ | 42.91 | ||||||||||
| Leasing commission costs per square foot (2) |
7.25 | 7.77 | 17.19 | 7.84 | 8.26 | |||||||||||||||
| Tenant concession costs per square foot (2) (3) |
22.00 | 4.93 | 4.28 | 29.22 | 11.28 | |||||||||||||||
|
|
|
|
|
|
|
|
|
|
|
|||||||||||
| Total tenant improvement, leasing commission, and tenant concession costs psf |
$ | 91.22 | $ | 13.84 | $ | 139.87 | $ | 56.04 | $ | 62.45 | ||||||||||
|
|
|
|
|
|
|
|
|
|
|
|||||||||||
| New Leases - 2nd Generation (4) |
||||||||||||||||||||
| Number of leases |
8 | 8 | 8 | 8 | 9 | |||||||||||||||
| Square feet |
106,589 | 89,713 | 43,880 | 75,418 | 83,364 | |||||||||||||||
| Tenant improvement costs per square foot (2) |
$ | 16.86 | $ | 46.58 | $ | 7.93 | $ | 27.22 | $ | 0.99 | ||||||||||
| Leasing commission costs per square foot (2) |
8.99 | 7.48 | 5.62 | 2.78 | 1.36 | |||||||||||||||
| Tenant concession costs per square foot (2) (3) |
10.15 | 1.55 | 7.16 | 4.22 | 11.82 | |||||||||||||||
|
|
|
|
|
|
|
|
|
|
|
|||||||||||
| Total tenant improvement, leasing commission, and tenant concession costs psf |
$ | 36.00 | $ | 55.61 | $ | 20.71 | $ | 34.22 | $ | 14.17 | ||||||||||
|
|
|
|
|
|
|
|
|
|
|
|||||||||||
| Total |
||||||||||||||||||||
| Number of renewals/leases |
30 | 22 | 23 | 22 | 21 | |||||||||||||||
| Square feet |
624,875 | 367,360 | 350,815 | 466,259 | 253,942 | |||||||||||||||
| Tenant improvement costs per square foot (2) |
$ | 18.47 | $ | 22.42 | $ | 75.14 | $ | 19.00 | $ | 10.09 | ||||||||||
| Leasing commission costs per square foot (2) |
5.36 | 6.96 | 11.74 | 6.29 | 3.19 | |||||||||||||||
| Tenant concession costs per square foot (2) (3) |
17.04 | 2.97 | 3.64 | 21.95 | 6.55 | |||||||||||||||
|
|
|
|
|
|
|
|
|
|
|
|||||||||||
| Total tenant improvement, leasing commission, and tenant concession costs psf |
$ | 40.87 | $ | 32.35 | $ | 90.52 | $ | 47.24 | $ | 19.83 | ||||||||||
|
|
|
|
|
|
|
|
|
|
|
|||||||||||
| (1) | Does not include retained tenants that have relocated to new space or expanded into new space. |
| (2) | Based on management estimates. Assumes all tenant improvement, leasing commission, and tenant concession costs are paid in the calendar year in which the lease is executed, which may be different than the year in which they are actually paid. |
| (3) | Includes both rent concessions due to free or discounted rent periods and lease incentives paid to tenants. |
| (4) | Includes pre-leasing activity and retained tenants that have relocated to new space or expanded into new space within the Company’s portfolio. For definitions of first and second generation leases, see page 35. |
33
NON-GAAP FINANCIAL MEASURE DEFINITIONS
DECEMBER 31, 2012
This document includes certain non-GAAP financial measures that management believes are helpful in understanding our business, as further described below. Our definition and calculation of non-GAAP financial measures may differ from those of other REITs, and therefore, may not be comparable. The non-GAAP measures should not be considered an alternative to net income as an indicator of our performance and should be considered only a supplement to cash flows from operating, investing or financing activities as a measure of liquidity, computed in accordance with GAAP.
FFO, CFFO and AFFO
We present funds from operations, or FFO, FFO excluding acquisition-related expenses, or CFFO, and adjusted funds from operations, or AFFO, available to common shares and OP units because we consider them to be important supplemental measures of our operating performance and believe they are frequently used by securities analysts, investors and other interested parties in the evaluation of REITs, many of which present FFO, CFFO and AFFO when reporting their results.
FFO, CFFO and AFFO are intended to exclude GAAP historical cost depreciation and amortization of real estate and related assets, which assumes that the value of real estate assets diminishes ratably over time. Historically, however, real estate values have risen or fallen with market conditions. Because FFO, CFFO and AFFO exclude depreciation and amortization unique to real estate, gains and losses from property dispositions and extraordinary items, they provide performance measures that, when compared year over year, reflect the impact to operations from trends in occupancy rates, rental rates, operating costs, development activities and interest costs, providing perspective not immediately apparent from net income. We compute FFO in accordance with standards established by the Board of Governors of the National Association of Real Estate Investment Trusts, or NAREIT. As defined by NAREIT, FFO represents net income (computed in accordance with GAAP), excluding gains (or losses) from sales of depreciable property, impairment charges on depreciable real estate, real estate related depreciation and amortization (excluding amortization of loan origination costs) and after adjustments for unconsolidated partnerships and joint ventures.
We calculate CFFO by adding acquisition-related expenses to FFO. We calculate AFFO by adding to CFFO: (a) non-cash revenues and expenses, (b) recurring capital expenditures and second generation tenant improvements and (c) leasing commissions.
Our computations may differ from the methodologies for calculating FFO, CFFO and AFFO utilized by other equity REITs and, accordingly, may not be comparable to such other REITs. Further, FFO, CFFO and AFFO do not represent amounts available for management’s discretionary use because of needed capital replacement or expansion, debt service obligations, or other commitments and uncertainties. FFO, CFFO and AFFO should not be considered alternatives to net income/(loss) (computed in accordance with GAAP) as indicators of our financial performance or to cash flow from operating activities (computed in accordance with GAAP) as indicators of our liquidity, nor are they indicative of funds available to fund our cash needs, including our ability to pay dividends or make distributions. FFO, CFFO and AFFO should be considered only as supplements to net income computed in accordance with GAAP as measures of our operations.
Earnings before Interest, Taxes, Depreciation and Amortization (EBITDA) and Adjusted EBITDA
EBITDA is defined as earnings before interest, taxes, depreciation and amortization. We calculate adjusted EBITDA by adding to EBITDA: (a) noncontrolling interests in our operating partnership, (b) impairments, (c) dividends payable on and cost on redemption of our series A preferred stock, (d) non-cash adjustments for marketable securities, (e) gains or losses from sales of real estate and (f) acquisition-related expenses. Management uses EBITDA and adjusted EBITDA as indicators of our ability to incur and service debt. In addition, we consider EBITDA and adjusted EBITDA to be appropriate supplemental measures of our performance because they eliminate depreciation and interest, which permits investors to view income from operations without the impact of non-cash depreciation or the cost of debt. However, because EBITDA and adjusted EBITDA are calculated before recurring cash charges including interest expense and taxes, and are not adjusted for capital expenditures or other recurring cash requirements of our business, their utility is limited.
Coverage Ratios
We present interest and fixed charge ratios as supplemental liquidity measures. Management uses these ratios as indicators of our financial flexibility to service current interest expense and debt amortization from current cash net operating income. In addition, we believe that these coverage ratios represent common metrics used by securities analysts, investors and other interested parties to evaluate our ability to service fixed cash payments. However, because these ratios are derived from adjusted EBITDA, their utility is limited by the same factors that limit the usefulness of adjusted EBITDA as a liquidity measure.
Net Operating Income (NOI)
We use net operating income, or NOI, as a performance measure and believe NOI provides useful information to investors regarding our financial condition and results of operations because it reflects only those income and expense items that are incurred at the property level. We compute NOI by adding or subtracting certain items from net income, noncontrolling interest in the operating partnership, gains/losses from investment in unconsolidated partnerships, interest expense, interest income, depreciation and amortization and general and administrative expenses. NOI presented by us may not be comparable to NOI reported by other REITs that define NOI differently. NOI should not be considered as an alternative to net income as an indication of our performance or to cash flows as a measure of liquidity or ability to make distributions.
34
DEFINITIONS
DECEMBER 31, 2012
Property Status
Stabilized
Represents operating properties that are more than 90% leased.
Lease up
Represents operating properties that are less than 90% leased.
Redevelopment
Represents properties that we are currently preparing for their intended use, and accordingly are capitalizing interest and other costs as of the end of the quarter.
Pre-development
Represents development properties that are engaged in activities related to planning, entitlement or other preparations for future construction.
Development
Represents properties that we are currently developing through ground up construction.
Development Potential
Represents estimates of the additional rentable square footage that we could put into service if management made the strategic election to pursue additional development.
Lease Type
First Generation
Leases on space which, in management’s evaluation, require significant improvements to prepare or condition the premises for its intended purpose or enhance the value of the property. This generally includes capital expenditures for development, redevelopment or repositioning a property.
Second Generation
Leases which are not considered by management to be first generation leases.
Recurring Capital Expenditures
Recurring capital expenditures exclude (1) items associated with the expansion of a building or its improvements, (2) renovations to a building which change the underlying classification of the building, incurred to prepare or condition the premises for its intended purpose (for example, from office to laboratory) or (3) capital improvements that represent an addition to the property rather than the replacement of property, plant or equipment.
35