Attached files
| file | filename |
|---|---|
| 8-K - FORM 8-K - BRYN MAWR BANK CORP | d481724d8k.htm |
 Exhibit 99.1
Year End 2012
Update
December 31, 2012
(as of February 6, 2013)
Bryn Mawr Bank
Corporation
NASDAQ: BMTC
Strong -
Stable -
Secure |
 1
Safe Harbor
This presentation contains statements which, to the extent that they are not
recitations of historical fact may constitute forward-looking statements for
purposes of the Securities Act of 1933, as amended, and the Securities
Exchange Act of 1934, as amended.
Please
see
the
section
titled
Safe
Harbor
begins
on
slide
32
for
more
information
regarding these types of statements.
The information contained in this presentation is correct only as of February 6,
2013. Our business, financial condition, results of operations and
prospects may have changed since that date, and we do not undertake to
update such information. |
 2
Bryn Mawr Bank Corporation
Profile
Founded in 1889 –
124 year history
A unique business model with a traditional commercial bank ($2 billion)
and
a
trust
company
($6.7
billion)
under
one
roof
at
December
31,
2012
Wholly-owned subsidiary –
The Bryn Mawr Trust Company
Largest community bank in Philadelphia’s affluent western suburbs
Three wealth acquisitions and two bank acquisitions completed since 2008
Experienced and committed management team |
 3
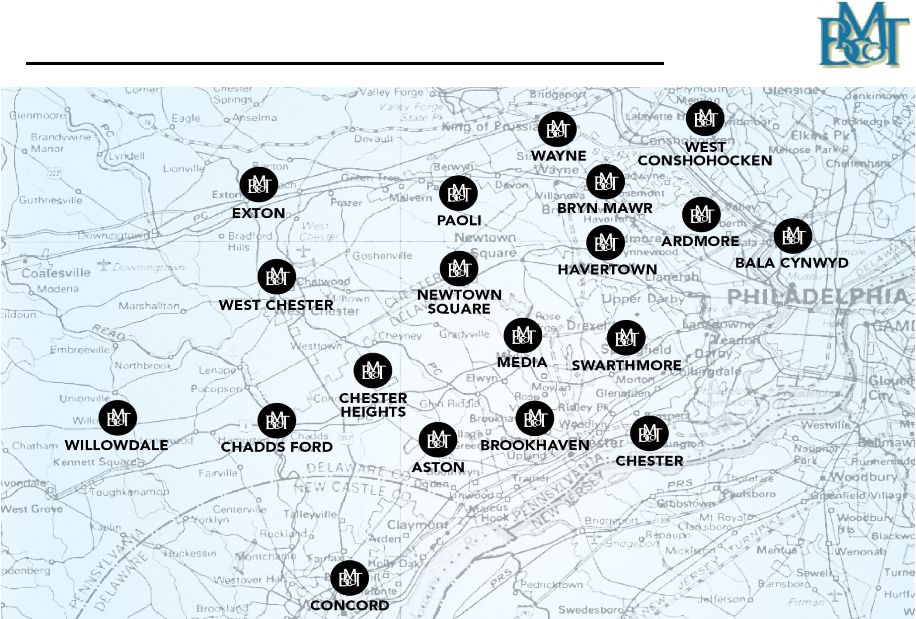
Southeast PA / DE Branch Footprint
•
19 BMTC Full Service Branch Locations |
 4
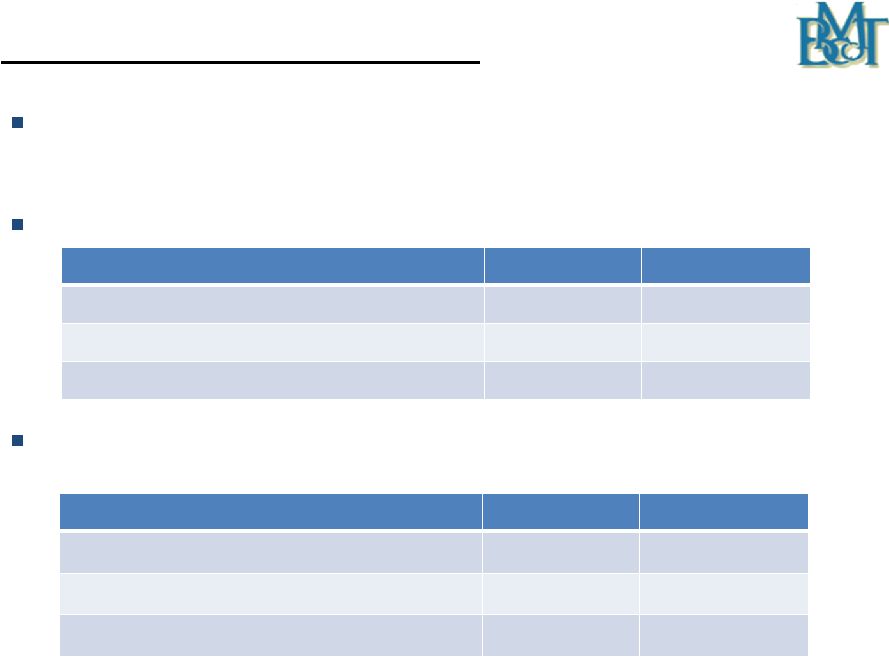
Investment Considerations
2012 dividend of $0.64
per share ($0.16 per quarter); Increased to $0.17
for the first quarter of 2013
Profitability Ratios:
Profitability Ratios, Excluding Tax-Effected Due Diligence and
Merger- Related Expenses (non-GAAP measures)*:
Full Year
12/31/2012
12/31/2011
Return on average assets (“ROA”)
1.15%
1.14%
Return on average equity (“ROE”)
10.91%
11.08%
Return on average tangible equity (“ROTE”)
14.55%
13.85%
Full Year
12/31/2012
12/31/2011
ROA, excluding tax-effected due diligence and merger-related
expenses (a non-GAAP measure)*
1.25%
1.15%
ROE, excluding tax-effected due diligence and merger-related
expenses (a non-GAAP measure)*
11.79%
11.30%
ROTE, excluding tax-effected due diligence and merger-related
expenses (a non-GAAP measure)*
15.73%
14.10%
* See Non-GAAP Measures disclosure beginning on slide 36
|
 5
Comments on BMTC from Bank Analysts
“BMTC is a highly attractive franchise with a strong commercial
banking and wealth management focus.”
(Guggenheim, October 2012)
“Bryn Mawr is one of our top picks in the Northeast.”
(Sterne Agee, October 2012)
“The business mix built by the bank remains enviable in suburban
Philadelphia.”
(Keefe, Bruyette & Woods, October 2012)
“Going forward, despite fierce macroeconomic headwinds, we believe
management’s efforts are likely to produce significant core EPS
growth.”
(Merion Research, October 2012) |
 6
Year to Date 2012 BMTC Stock Performance
Closing price on December 30, 2011:
$19.49
Closing price on December 31, 2012:
$22.27
Dividends declared per share –
12 months 2012:
$0.64
Security or Index
2012 Total Return
3 Year Annualized
Return**
Trailing 12-Month
Dividend Yield
BMTC*
17.81%
17.40%
2.87%
NASDAQ Bank Index*
18.73%
6.65%
2.29%
KBW Bank Index*
33.05%
8.03%
1.95%
*Source: Bloomberg
** Annualized return -1/1/2010 to 12/31/2012 |
 7
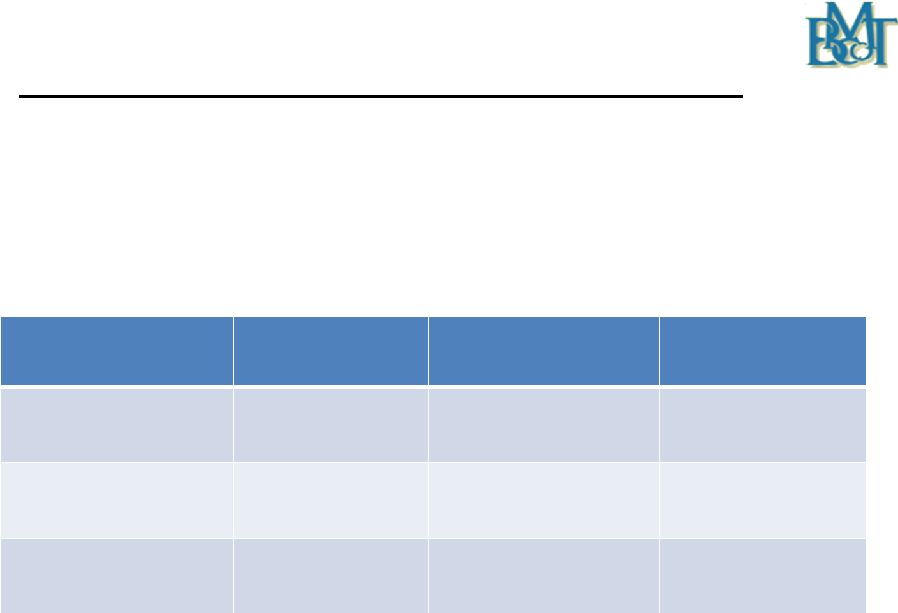
Consistent BMTC Annual Dividend
Year
Diluted
Earnings
Per Share
Annual
Dividend
Dividend
Yield Year-
End
Dividend
Payout Ratio
2008
$1.08
$0.54
2.69%
50.0%
2009
$1.18
$0.56
3.71%
47.5%
2010
$0.85
$0.56
3.21%
65.9%
2011
$1.54
$0.60
3.08%
39.0%
2012
$1.60
$0.64
2.87%
40.0% |
 Growth
Initiatives |
 9
2013 Strategic Initiatives
3-8-3 Strategic Plan
$3 billion in Banking assets -
$8 billion in Wealth assets –
3 years
(December 2014)
Approved by the Board of Directors on May 8, 2012
Organic growth –
opportunistic expansion
Inorganic growth criterion -
Acquisitions to be strategic and
accretive to earnings per share in first 12 months (excluding merger
costs) |
 10
2013 Strategic Initiatives -
continued
Focus on the net interest margin
Concentrate on growing fee-based income
Continued emphasis on strong credit quality
Integrate, streamline and assimilate recent acquisitions into more
effective and efficient wealth operations
Enhance and upgrade IT infrastructure throughout the organization
|
 11
Closed November 17, 2012
Purchased approximately $70 million of deposits and $80 million of
loans providing a positive influence on net interest income and the
net interest margin
Acquired and opened first branch in Delaware
Became the Bank’s 18
full service branch
Loan mark of $3.7 million or 4.6% of loans
th
Purchase of Deposits and Loans from First
Bank of Delaware |
 Financial
Review |
 Financial Highlights
4
th
Qtr
2012
3
rd
Qtr
2012
2
nd
Qtr
2012
1
st
Qtr
2012
4
th
Qtr
2011
Total assets
($ in billions)
$2.04
$1.81
$1.85
$1.84
$1.77
Portfolio loans & leases
($ in billions)
$1.40
$1.31
$1.30
$1.30
$1.29
Total deposits
($ in billions)
$1.63
$1.40
$1.43
$1.43
$1.38
Total wealth assets
($ in billions)
$6.66
$6.48
$6.28
$5.15
$4.83
Market capitalization
($ in millions)
$298.7
$296.8
$280.1
$297.4
$253.2
Net income
($ in millions)
$5.30
$5.43
$5.35
$5.07
$5.00
Tax-equivalent net interest margin
3.86%
3.78%
3.84%
3.93%
3.91%
Non-interest income as a
percentage of total revenue
42%
43%
42%
37%
37% |
 14
Financial Highlights -
continued
4
th
Qtr
2012
3
rd
Qtr
2012
2
nd
Qtr
2012
1
st
Qtr
2012
4
th
Qtr
2011
Diluted earnings per common
share
$0.40
$0.41
$0.40
$0.39
$0.38
Dividends declared
$0.16
$0.16
$0.16
$0.16
$0.15
Book value per share, end of
quarter
$15.17
$15.02
$14.73
$14.40
$14.07
Tangible book value per
share, end of quarter
$11.08
$11.14
$10.77
$11.20
$10.78
Tangible common equity ratio,
end of quarter
7.60%
8.58%
8.07%
8.22%
8.19%
Efficiency ratio
70.1%
67.0%
66.4%
65.7%
65.4%
Efficiency ratio, excluding tax-
effected due diligence and
merger-related expenses
(a non-GAAP measure)*
67.5%
66.3%
64.3%
65.1%
66.0%
* See Non-GAAP Measures Disclosure beginning on slide 36
|
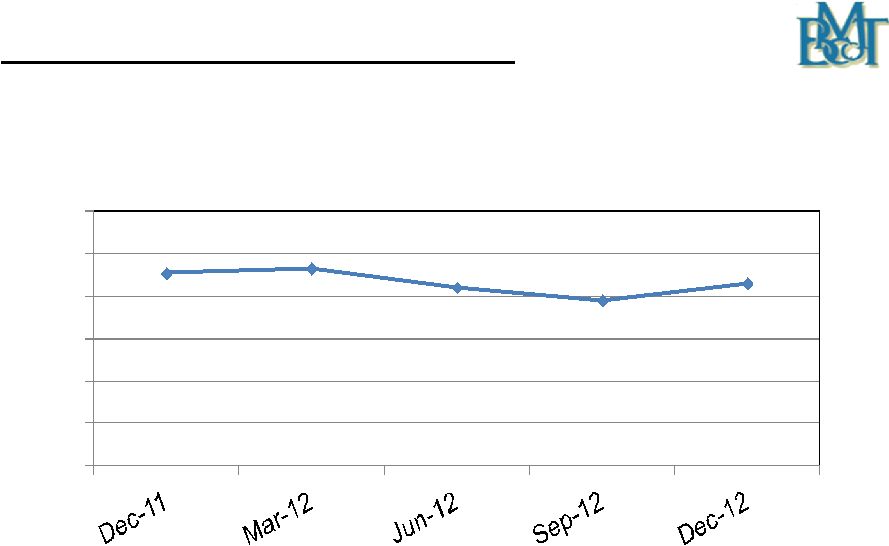 15
3.91%
3.93%
3.84%
3.78%
3.86%
3.0%
3.2%
3.4%
3.6%
3.8%
4.0%
4.2%
Quarterly Net Interest Margin
On a tax-equivalent basis |
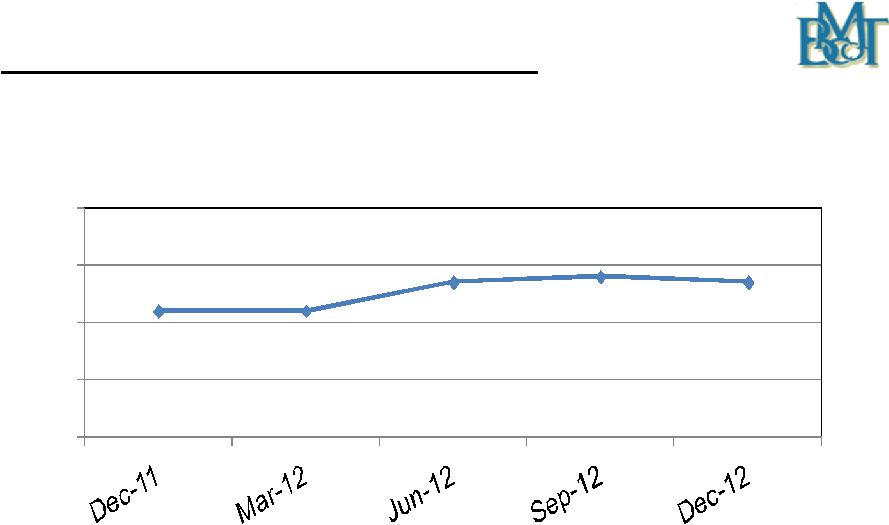 16
37%
37%
42%
43%
42%
15%
25%
35%
45%
55%
Quarterly Non-Interest Income
(As a % of Total Revenue) |
 17
Capital Considerations
Maintain a “well capitalized”
capital position including a target tangible
common equity to tangible asset ratio of 8.00%
Selectively add capital to maintain capital levels and fund asset growth and
acquisitions
Strong emphasis on retained earnings going forward
Shelf Registration (Form S-3) of $150 million provides the ability to raise
capital as needed including a Dividend Reinvestment and Direct Stock
Purchase Plan with Waiver |
 18
Capital Position -
Bryn Mawr Bank Corporation
12/31/2012
6/30/2012
12/31/2011
Tier I
11.03%
11.30%
11.16%
Total (Tier II)
12.02%
13.90%
13.74%
Tier I Leverage
8.72%
8.80%
8.89%
Tangible Common
Equity
7.60%
8.07%
8.19% |
 19
Events Reducing Capital Ratios in 2012
Asset growth was better than expected; anticipated loan growth can be
funded from cash and investment securities
Paid off $22.5 million of subordinated debt in 2012 reducing Tier II capital
and ongoing interest expense
Pension OCI changes due to lower discount rate
Davidson Trust Company acquisition on May 15, 2012
First Bank of Delaware transaction on November 17, 2012
Anticipated retained earnings over the next six months should raise the TCE
ratio back to 8.00%+, as the benefits of the subordinated debt payoffs and the
full-year impact of the acquisitions run through the income
statement. |
 Wealth
Division
Review |
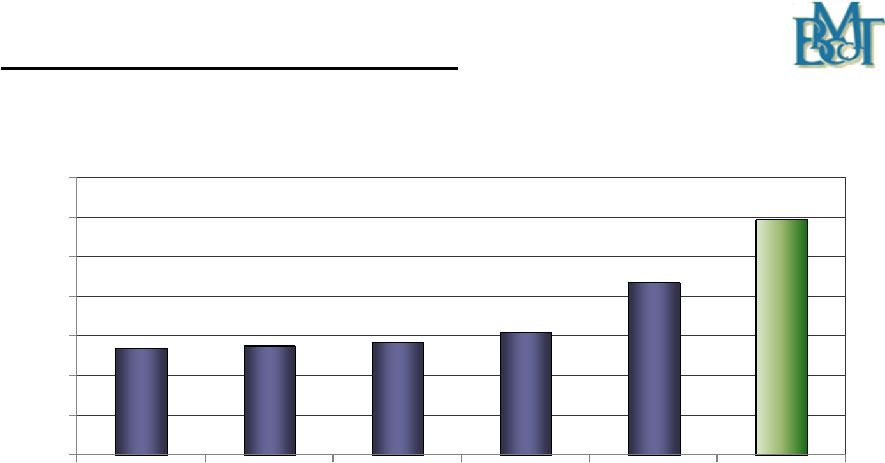
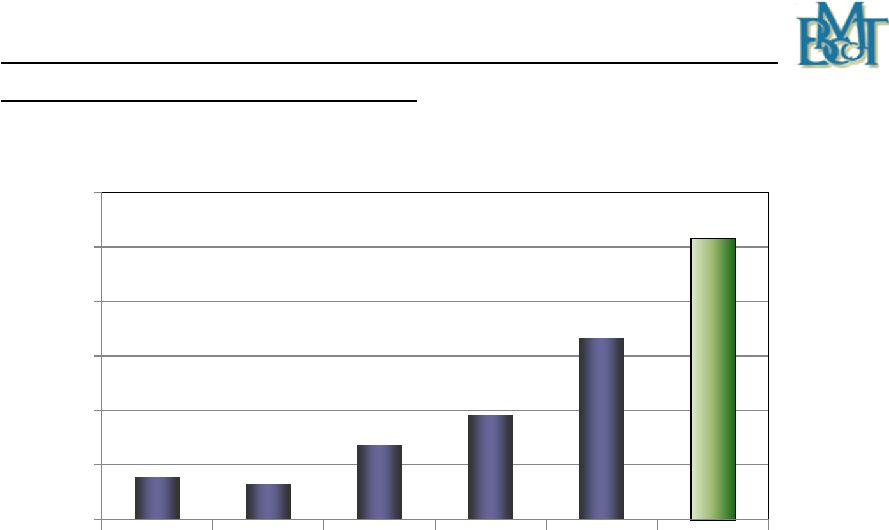 21
$2.28
$2.15
$2.87
$3.41
$4.83
$6.66
$1.5
$2.5
$3.5
$4.5
$5.5
$6.5
$7.5
2007
2008
2009
2010
2011
2012
Wealth Assets Under Management, Administration,
Supervision and Brokerage
($ in billions) |
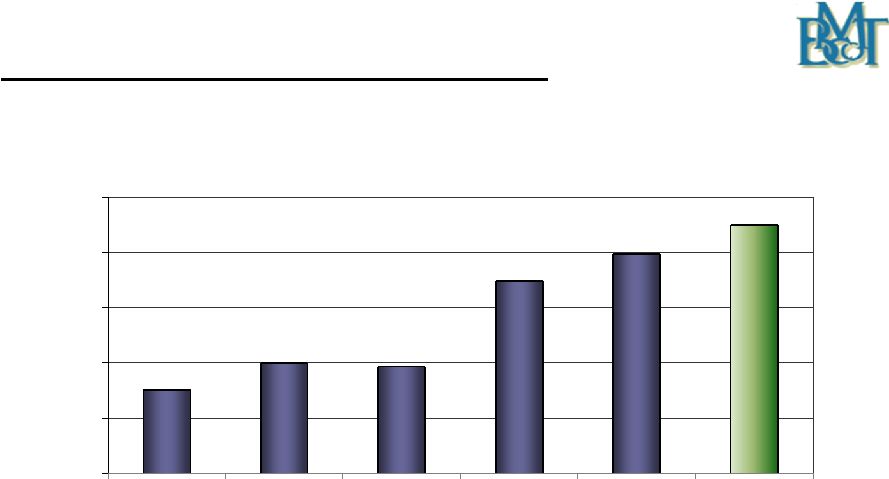
 22
$13.5
$13.8
$14.2
$15.5
$21.7
$29.8
$0.0
$5.0
$10.0
$15.0
$20.0
$25.0
$30.0
$35.0
2007
2008
2009
2010
2011
2012
Wealth Management Fees
($ in millions) |
 23
Wealth Division Highlights
Wealth Management
(Bryn Mawr, Hershey and Devon, PA)
$4.36 billion in assets
Integrated solutions to protect and preserve wealth
Financial Planning
Estate Planning
Retirement Planning
Investment Management
Custody Services
Philanthropic Services
Fiduciary Trust Services
Multi-family Office
Tax Services
Long-standing client relationships
Integration of operations of all three trust entities is underway
|
 24
Wealth Division Highlights -
continued
Bryn Mawr Asset Management (Bryn Mawr, PA)
$306 million in assets
Brokerage services, asset allocation, open platform with objective advice
“Lift Out”
strategy with other opportunities being continuously evaluated
BMTC of Delaware (Greenville, DE)
$1.4 billion in assets
Provides
corporate
fiduciary
and
administrative
trustee
services
under
Delaware law and the full spectrum of tax advantaged strategies
Lower margin business with full year profitability expected in 2013
Lau Associates (Greenville, DE)
$594 million in assets
Fee-only, independent multi-family office providing highly personalized
service and sophisticated financial planning |
 Credit
Review |
 26
Portfolio Loan & Lease Growth
$803
$900
$886
$1,197
$1,295
$1,398
$500
$700
$900
$1,100
$1,300
$1,500
2007
2008
2009
2010*
2011
2012**
($ in millions)
* From 2010 forward, includes the addition of the First Keystone
loan portfolio.
** From 2012 forward, includes the addition of the loans acquired from First Bank
of Delaware. |
 27
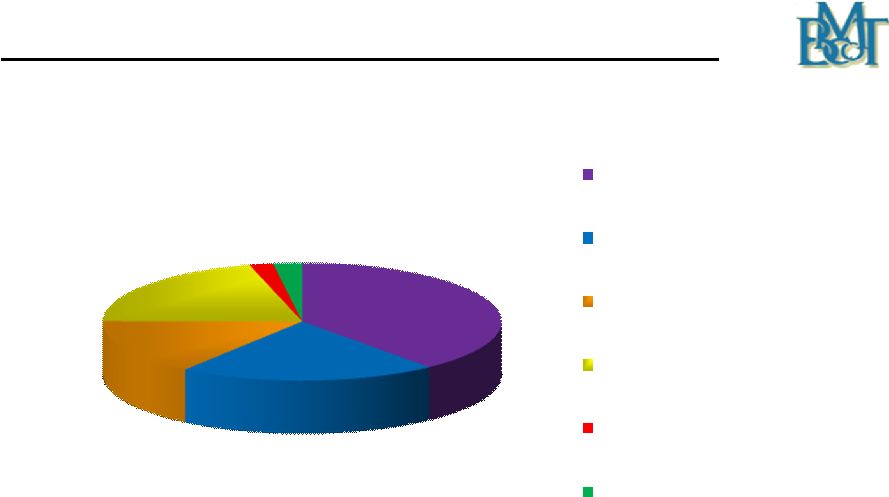
Loan Composition at December 31, 2012
$546
$292
$212
$288
$27
$33
Commercial Mortgages
(39%)
Commercial & Industrial
(21%)
Home Equity & Consumer
Loans (15%)
Residential Mortgages
(21%)
Construction
(2%)
Leases
(2%)
($ in millions)
Total loans and leases of $1,398 million |
 28
Quarterly Asset Quality Data
4
th
Qtr
2012
3
rd
Qtr
2012
2
nd
Qtr
2012
1
st
Qtr
2012
4
th
Qtr
2011
Non-performing loans and leases as
a % of portfolio loans and leases
1.06%
1.05%
1.41%
1.73%
1.11%
Allowance as a % of portfolio loans
and leases
1.03%
1.04%
1.01%
1.00%
0.98%
Non-performing assets as a % of
total assets
0.77%
0.78%
1.03%
1.25%
0.84%
Annualized net loan and lease
charge-offs as a % of average
quarterly loans and leases
0.07%
0.16%
0.28%
0.23%
-0.01% |
 29
Loan and Lease Updates
1st quarter 2013 loan pipeline looks promising.
Recent hires of experienced lenders coupled with the new team in
Delaware from the recent acquisition has increased new loan
opportunities.
The lease portfolio at December 31, 2012 is $33 million, has an average
yield of 9.83% and a delinquency rate of 0.22%. |
 30
Summary
Outstanding franchise in a stable market
Focus on Wealth Services, Business Banking and Residential Mortgage
Diversified income base –
non interest income 42% of total revenue for
the twelve months ended December 21, 2012
Outstanding loan quality in a difficult economic environment
Sound business strategy, strong asset quality, well capitalized and solid
risk management procedures serve as a foundation for potential strategic
expansion
Focus on earnings per share growth
Making IT infrastructure investments that will provide longer term benefits
|
 31
Ted Peters, Chairman
610-581-4800
tpeters@bmtc.com
Frank Leto, EVP
610-581-4730
fleto@bmtc.com
Joseph Keefer, EVP
610-581-4869
jkeefer@bmtc.com
Duncan Smith, CFO
610-526 –2466
jdsmith@bmtc.com
Chad Fortenbaugh –
Shareholder Relations –
610-581-4823 –
cfortenbaugh@bmtc.com |
 32
This presentation contains statements which, to the extent that they are not
recitations of historical fact may constitute forward-looking statements
for purposes of the Securities Act of 1933, as amended, and the Securities
Exchange Act of 1934, as amended. Such forward-looking statements may
include financial and other projections as well as statements regarding Bryn
Mawr Bank Corporation’s (the “Corporation”) that may include future
plans, objectives, performance, revenues, growth, profits, operating
expenses or the Corporation’s underlying assumptions. The words
“may”, “would”, “should”, “could”, “will”, “likely”, “possibly”, “expect,”
“anticipate,”
“intend”, “estimate”, “target”,
“potentially”, “probably”, “outlook”, “predict”,
“contemplate”,
“continue”,
“plan”,
“forecast”,
“project”
and
“believe”
or
other
similar
words,
phrases
or concepts may identify forward-looking statements. Persons reading or present
at this presentation are cautioned that such statements are only
predictions, and that the Corporation’s actual future results or
performance may be materially different. Such forward-looking statements
involve known and unknown risks and uncertainties. A number of factors, many
of which are beyond the Corporation’s control, could cause our actual results,
events or developments, or industry results, to be materially different from any
future results, events
or
developments
expressed,
implied
or
anticipated
by
such
forward-looking
statements,
and so our business and financial condition and results of operations could be
materially and adversely affected.
Safe Harbor |
 33
Safe Harbor (continued)
Such factors include, among others, our need for capital, our ability to control
operating costs and expenses, and to manage loan and lease delinquency
rates; the credit risks of lending activities and overall quality of the
composition of our loan, lease and securities portfolio; the impact of
economic conditions, consumer and business spending habits, and real estate market
conditions on
our
business
and
in
our
market
area;
changes
in
the
levels
of
general
interest
rates,
deposit
interest rates, or net interest margin and funding sources; changes in banking
regulations and policies and the possibility that any banking agency
approvals we might require for certain activities will not be obtained in a
timely manner or at all or will be conditioned in a manner that would impair
our ability to implement our business plans; changes in accounting policies and
practices; the inability of key third-party providers to perform their
obligations to us; our ability to attract and retain key personnel;
competition in our marketplace; war or terrorist activities; material
differences in the actual financial results, cost savings and revenue enhancements
associated with our acquisitions including our contemplated acquisition of
the First Bank of Delaware; and other factors as described in our securities
filings. All forward-looking statements and information made herein are
based on Management’s current beliefs and assumptions as of February 06,
2013
and speak only as of that date. The Corporation does not undertake to update
forward- looking statements. |
 34
Safe Harbor (continued)
For a complete discussion of the assumptions, risks and uncertainties related to
our business, you are encouraged to review our filings with the Securities
and Exchange Commission, including our most recent annual report on Form
10-K, as well as any changes in risk factors that we may identify in our
quarterly or other reports filed with the SEC. This
presentation
is
for
discussion
purposes
only,
and
shall
not
constitute
any
offer
to
sell
or
the
solicitation
of
an
offer
to
buy
any
security,
nor
is
it
intended
to
give
rise
to
any
legal
relationship
between
the
Corporation
and
you
or
any
other
person,
nor
is
it
a
recommendation
to
buy
any
securities or enter into any transaction with the Corporation.
The information contained herein is preliminary and material changes to such
information may be made at any time. If any offer of securities is made, it
shall be made pursuant to a definitive offering memorandum or prospectus
(“Offering Memorandum”) prepared by or on behalf of the
Corporation, which would contain material information not contained herein and
which shall supersede, amend and supplement this information in its
entirety. Any decision to invest in the Corporation’s securities
should be made after reviewing an Offering Memorandum, conducting such
investigations as the investor deems necessary or appropriate, and consulting the investor’s
own legal, accounting, tax, and other advisors in order to make an independent
determination of the suitability and consequences of an investment in such
securities. |
 35
Safe Harbor (continued)
No offer to purchase securities of the Corporation will be made or accepted prior
to receipt by an investor of an Offering Memorandum and relevant
subscription documentation, all of which must be reviewed together with the
Corporation’s then-current financial statements and, with respect to
the subscription documentation, completed and returned to the Corporation in its
entirety. Unless purchasing in an offering of securities registered
pursuant to the Securities Act of 1933, as amended,
all
investors
must
be
“accredited
investors”
as
defined
in
the
securities
laws
of
the
United States before they can invest in the Corporation.
|
 36
*Non GAAP Measures
Our management uses non-GAAP financial measures in their analysis of
our performance and believes that they provide useful supplemental
information that is essential to an investor’s understanding of Bryn Mawr
Bank Corporation’s operating results. These non-GAAP
financial measures should not be viewed as a substitute for financial
measures determined in accordance with GAAP, nor are they necessarily
comparable to non-GAAP performance measures that may be presented by
other companies. A reconciliation from GAAP measures to non-GAAP measures
related to the exclusion of tax-effected due diligence and
merger-related expenses is provided on the following two slides:
|
 37
*Reconciliation of GAAP Measures to Non-GAAP Measures
$ in thousands
Full Year 2012
Full Year 2011
Net income (a GAAP measure)
$21,147
$19,602
Add: Tax-effected due diligence and
merger-related expenses (35% tax rate)
$1,709
$349
Net income, excluding tax-effected due
diligence and merger-related expenses
(a non-GAAP measure)
$22,856
$19,951
•Return on average assets, excluding tax-effected due diligence and
merger-related expenses (a non-GAAP measure) is calculated by
dividing net income, excluding tax-effected due diligence and merger-related expenses
(a non-GAAP measure) by average assets.
•Return on average equity, excluding tax-effected due diligence and
merger-related expenses (a non-GAAP measure) is calculated by
dividing net income, excluding tax-effected due diligence and merger-related expenses
(a non-GAAP measure) by average equity.
•Return on tangible common equity, excluding tax-effected due diligence
and merger-related expenses (a non- GAAP measure) is calculated by
dividing net income, excluding tax-effected due diligence and merger-related
expenses (a non-GAAP measure) by average tangible common equity.
|
 38
*Reconciliation of GAAP Measures to Non-GAAP Measures (cont’d)
$ in thousands
4
th
Qtr
2012
3
rd
Qtr
2012
2
nd
Qtr
2012
1
st
Qtr
2012
4
th
Qtr
2011
Non-interest expense
(a GAAP measure)
$21,089
$18,889
$18,128
$16,795
$16,739
Less: Tax-effected due
diligence and merger-related
expenses (35% tax rate)
$774
$205
$594
$136
($51)
Non-interest expense,
excluding tax-effected due
diligence and merger-related
expenses (a non-GAAP
measure)
$20,315
$18,684
$17,534
$16,659
$16,790
•The efficiency ratio, excluding tax-effected due diligence and
merger-related expenses (a non-GAAP measure), is calculated by
dividing non-interest expense, excluding tax-effected due diligence and merger-related expenses
(a non-GAAP measure) by the sum of net interest income and non-interest
income. |