Attached files
| file | filename |
|---|---|
| 8-K - FORM 8-K - SOUTHERN Co GAS | form_8-k.htm |
| EX-99.1 - EXHIBIT 99.1 - SOUTHERN Co GAS | exhibit99_1.htm |
Fourth Quarter and Year-End 2012 Earnings Presentation February 6, 2013
Forward-Looking Statements & Supplemental Information * Forward-Looking Statements Certain expectations and projections regarding our future performance referenced in this presentation, in other reports or statements we file with the SEC or otherwise release to the public, and on our website, are forward-looking statements within the meaning of the Private Securities Litigation Reform Act of 1995. Senior officers and other employees may also make verbal statements to analysts, investors, regulators, the media and others that are forward-looking. Forward-looking statements involve matters that are not historical facts, such as statements regarding our future operations, prospects, strategies, financial condition, economic performance (including growth and earnings), industry conditions and demand for our products and services. Because these statements involve anticipated events or conditions, forward-looking statements often include words such as "anticipate," "assume," "believe," "can," "could," "estimate," "expect," "forecast," "future," "goal," "indicate," "intend," "may," "outlook," "plan," "potential," "predict," "project," "seek," "should," "target," "would," or similar expressions. You are cautioned not to place undue reliance on our forward-looking statements. Forward-looking statements contained in this presentation include, without limitation, statements regarding our anticipated capital expenditures and our ability to fund capitalization requirements, the timing and approval of our proposed infrastructure program, when we expect to realize the economic value created by our wholesale services business, our projected storage withdrawal schedule, the financial impact of the acquired NiSource Inc. assets on our retail operations, our earnings guidance, including our segment EBIT expectations for 2013, and related expectations and assumptions and our priorities for 2013. Our expectations are not guarantees and are based on currently available competitive, financial and economic data along with our operating plans. While we believe our expectations are reasonable in view of the currently available information, our expectations are subject to future events, risks and uncertainties, and there are several factors - many beyond our control - that could cause results to differ significantly from our expectations. Such events, risks and uncertainties include, but are not limited to, changes in price, supply and demand for natural gas and related products; the impact of changes in state and federal legislation and regulation, including changes related to climate change; actions taken by government agencies on rates and other matters; concentration of credit risk; utility and energy industry consolidation; the impact on cost and timeliness of construction projects by government and other approvals, development project delays, adequacy of supply of diversified vendors, unexpected change in project costs, including the cost of funds to finance these projects; the impact of acquisitions and divestitures, including the Nicor merger; limits on natural gas pipeline capacity; direct or indirect effects on our business, financial condition or liquidity resulting from a change in our credit ratings or the credit ratings of our counterparties or competitors; interest rate fluctuations; financial market conditions, including disruptions in the capital markets and lending environment and the current economic uncertainty; general economic conditions; uncertainties about environmental issues and the related impact of such issues; the impact of changes in weather, including climate change, on the temperature-sensitive portions of our business; the impact of natural disasters such as hurricanes on the supply and price of natural gas; the outcome of litigation; acts of war or terrorism; and other factors which are provided in detail in our filings with the Securities and Exchange Commission. Forward-looking statements are only as of the date they are made, and we do not undertake to update these statements to reflect subsequent changes. Supplemental Information Company management evaluates segment financial performance based on operating margin and earnings before interest and taxes (EBIT), which include the effects of corporate expense allocations. EBIT is a non-GAAP (accounting principles generally accepted in the United States of America) financial measure that includes operating income and other income and expenses. Items that are not included in EBIT are income taxes and financing costs, including debt and interest expense, each of which the company evaluates on a consolidated basis. The company believes EBIT is a useful measurement of its performance because it provides information that can be used to evaluate the effectiveness of its businesses from an operational perspective, exclusive of the costs to finance those activities and exclusive of income taxes, neither of which is directly relevant to the efficiency of those operations. Operating margin is a non-GAAP measure calculated as operating revenues minus cost of goods sold and revenue taxes, excluding operation and maintenance expense, depreciation and amortization, certain taxes other than income taxes and gains or losses on the sale of assets, if any. These items are included in the company's calculation of operating income. The company believes operating margin is a better indicator than operating revenues of the contribution resulting from customer growth, since cost of goods sold and revenue taxes are generally passed directly through to customers. In addition, in this presentation, the company has presented a non-GAAP measure of both its net income and its earnings per share each adjusted to exclude expenses incurred with respect to the Nicor merger. As the company does not routinely engage in transactions of the magnitude of the Nicor merger, and consequently does not regularly incur transaction related expenses with correlative size, the company believes presenting net income and EPS excluding Nicor merger expenses provides investors with an additional measure of the company’s core operating performance. The company also uses a non-GAAP measure when it presents the impact of warmer than normal weather on its diluted EPS. EBIT, operating margin, net income excluding merger expenses (also referred to as adjusted net income), EPS excluding merger expenses (also referred to as adjusted EPS) and the impact of warmer than normal weather should not be considered as alternatives to, or more meaningful indicators of, the company's operating performance than operating income, net income attributable to AGL Resources Inc. or EPS as determined in accordance with GAAP. In addition, the company's EBIT, operating margin, adjusted net income and adjusted EPS may not be comparable to similarly titled measures of another company. Reconciliations of non-GAAP financial measures referenced in this presentation are available at the end of this presentation and on the company’s Web site at www.aglresources.com
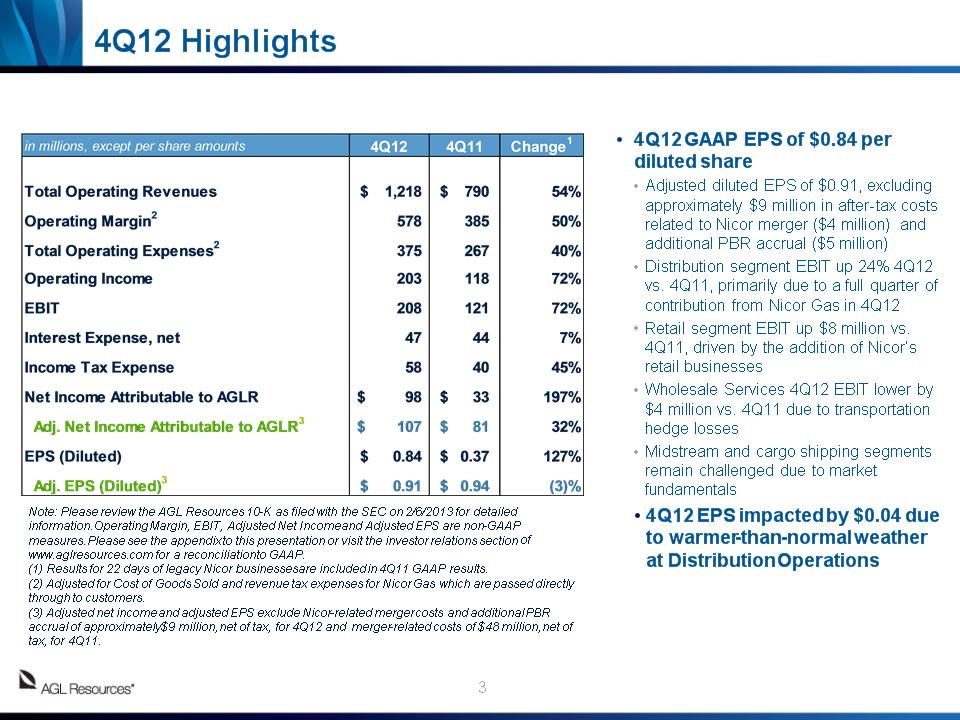
4Q12 Highlights 4Q12 GAAP EPS of $0.84 per diluted share Adjusted diluted EPS of $0.91, excluding approximately $9 million in after-tax costs related to Nicor merger ($4 million) and additional PBR accrual ($5 million) Distribution segment EBIT up 24% 4Q12 vs. 4Q11, primarily due to a full quarter of contribution from Nicor Gas in 4Q12 Retail segment EBIT up $8 million vs. 4Q11, driven by the addition of Nicor’s retail businesses Wholesale Services 4Q12 EBIT lower by $4 million vs. 4Q11 due to transportation hedge losses Midstream and cargo shipping segments remain challenged due to market fundamentals 4Q12 EPS impacted by $0.04 due to warmer-than-normal weather at Distribution Operations Note: Please review the AGL Resources 10-K as filed with the SEC on 2/6/2013 for detailed information. Operating Margin, EBIT, Adjusted Net Income and Adjusted EPS are non-GAAP measures. Please see the appendix to this presentation or visit the investor relations section of www.aglresources.com for a reconciliation to GAAP. (1) Results for 22 days of legacy Nicor businesses are included in 4Q11 GAAP results. (2) Adjusted for Cost of Goods Sold and revenue tax expenses for Nicor Gas which are passed directly through to customers. (3) Adjusted net income and adjusted EPS exclude Nicor-related merger costs and additional PBR accrual of approximately $9 million, net of tax, for 4Q12 and merger-related costs of $48 million, net of tax, for 4Q11. *
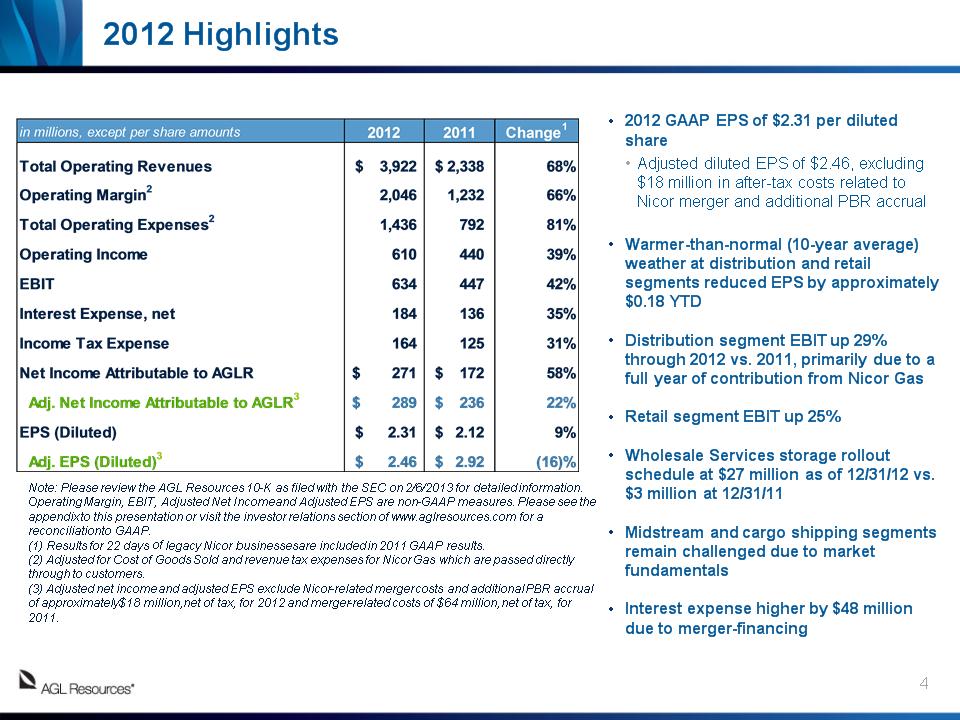
2012 Highlights 2012 GAAP EPS of $2.31 per diluted share Adjusted diluted EPS of $2.46, excluding $18 million in after-tax costs related to Nicor merger and additional PBR accrual Warmer-than-normal (10-year average) weather at distribution and retail segments reduced EPS by approximately $0.18 YTD Distribution segment EBIT up 29% through 2012 vs. 2011, primarily due to a full year of contribution from Nicor Gas Retail segment EBIT up 25% Wholesale Services storage rollout schedule at $27 million as of 12/31/12 vs. $3 million at 12/31/11 Midstream and cargo shipping segments remain challenged due to market fundamentals Interest expense higher by $48 million due to merger-financing Note: Please review the AGL Resources 10-K as filed with the SEC on 2/6/2013 for detailed information. Operating Margin, EBIT, Adjusted Net Income and Adjusted EPS are non-GAAP measures. Please see the appendix to this presentation or visit the investor relations section of www.aglresources.com for a reconciliation to GAAP. (1) Results for 22 days of legacy Nicor businesses are included in 2011 GAAP results. (2) Adjusted for Cost of Goods Sold and revenue tax expenses for Nicor Gas which are passed directly through to customers. (3) Adjusted net income and adjusted EPS exclude Nicor-related merger costs and additional PBR accrual of approximately $18 million, net of tax, for 2012 and merger-related costs of $64 million, net of tax, for 2011. *
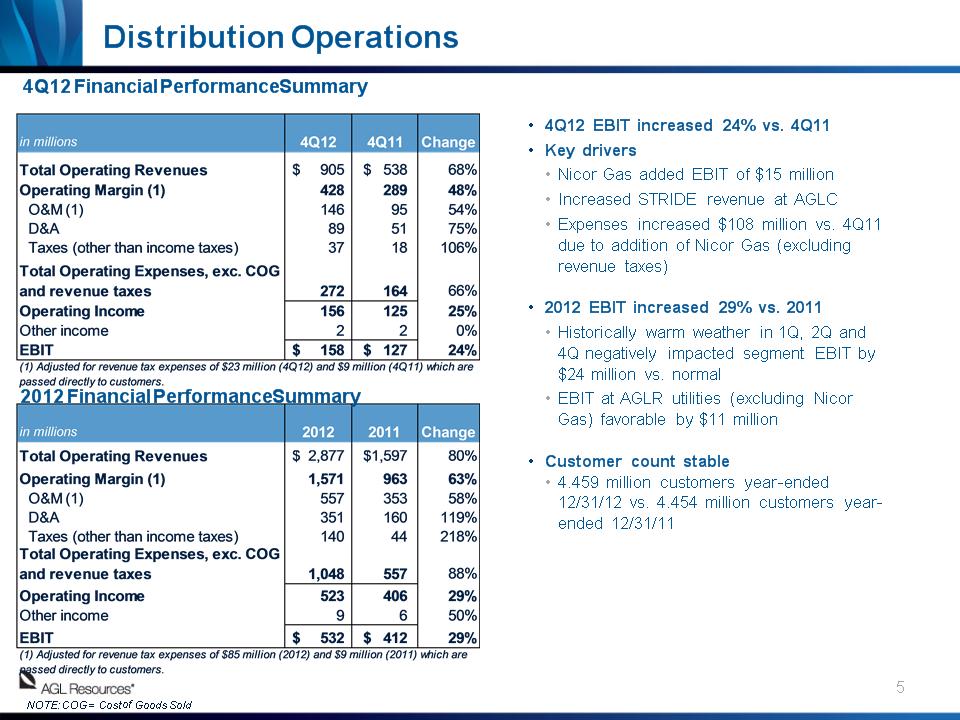
2012 Financial Performance Summary 4Q12 EBIT increased 24% vs. 4Q11 Key drivers Nicor Gas added EBIT of $15 million Increased STRIDE revenue at AGLC Expenses increased $108 million vs. 4Q11 due to addition of Nicor Gas (excluding revenue taxes) 2012 EBIT increased 29% vs. 2011 Historically warm weather in 1Q, 2Q and 4Q negatively impacted segment EBIT by $24 million vs. normal EBIT at AGLR utilities (excluding Nicor Gas) favorable by $11 million Customer count stable 4.459 million customers year-ended 12/31/12 vs. 4.454 million customers year-ended 12/31/11 Distribution Operations NOTE: COG = Cost of Goods Sold 4Q12 Financial Performance Summary *
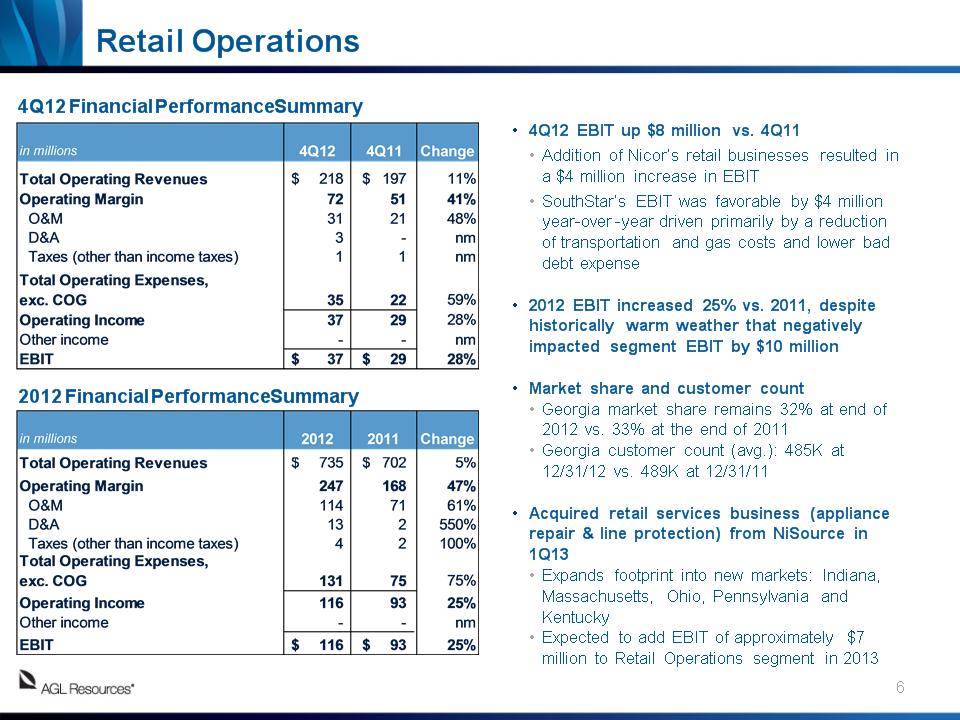
Retail Operations 4Q12 EBIT up $8 million vs. 4Q11 Addition of Nicor’s retail businesses resulted in a $4 million increase in EBIT SouthStar’s EBIT was favorable by $4 million year-over-year driven primarily by a reduction of transportation and gas costs and lower bad debt expense 2012 EBIT increased 25% vs. 2011, despite historically warm weather that negatively impacted segment EBIT by $10 million Market share and customer count Georgia market share remains 32% at end of 2012 vs. 33% at the end of 2011 Georgia customer count (avg.): 485K at 12/31/12 vs. 489K at 12/31/11 Acquired retail services business (appliance repair & line protection) from NiSource in 1Q13 Expands footprint into new markets: Indiana, Massachusetts, Ohio, Pennsylvania and Kentucky Expected to add EBIT of approximately $7 million to Retail Operations segment in 2013 4Q12 Financial Performance Summary 2012 Financial Performance Summary *
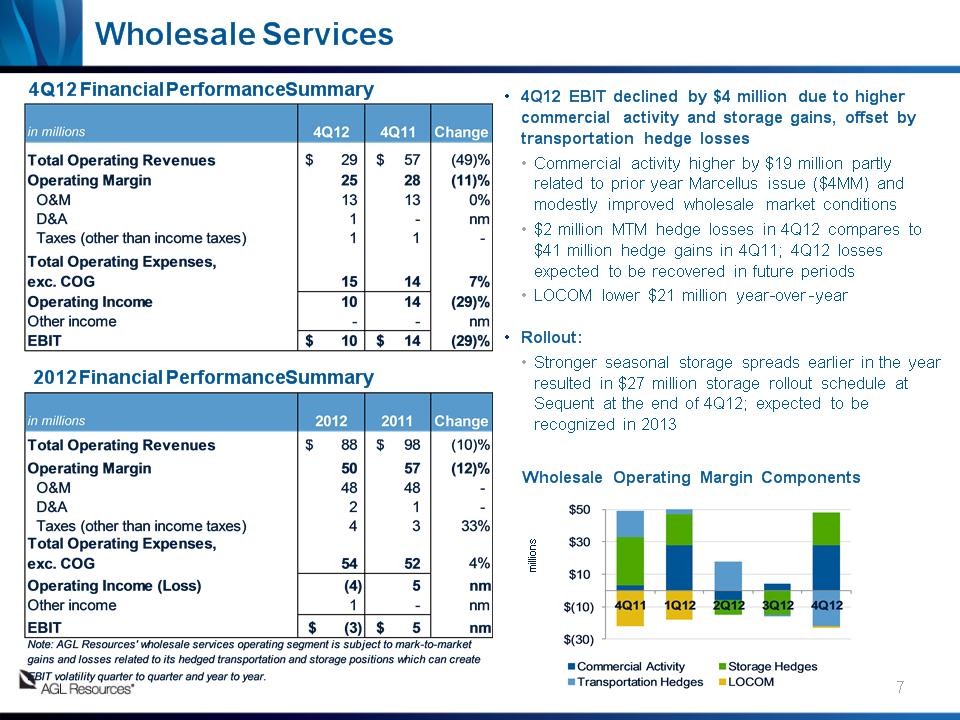
4Q12 EBIT declined by $4 million due to higher commercial activity and storage gains, offset by transportation hedge losses Commercial activity higher by $19 million partly related to prior year Marcellus issue ($4MM) and modestly improved wholesale market conditions $2 million MTM hedge losses in 4Q12 compares to $41 million hedge gains in 4Q11; 4Q12 losses expected to be recovered in future periods LOCOM lower $21 million year-over-year Rollout: Stronger seasonal storage spreads earlier in the year resulted in $27 million storage rollout schedule at Sequent at the end of 4Q12; expected to be recognized in 2013 4Q12 Financial Performance Summary Wholesale Services * millions Wholesale Operating Margin Components 2012 Financial Performance Summary
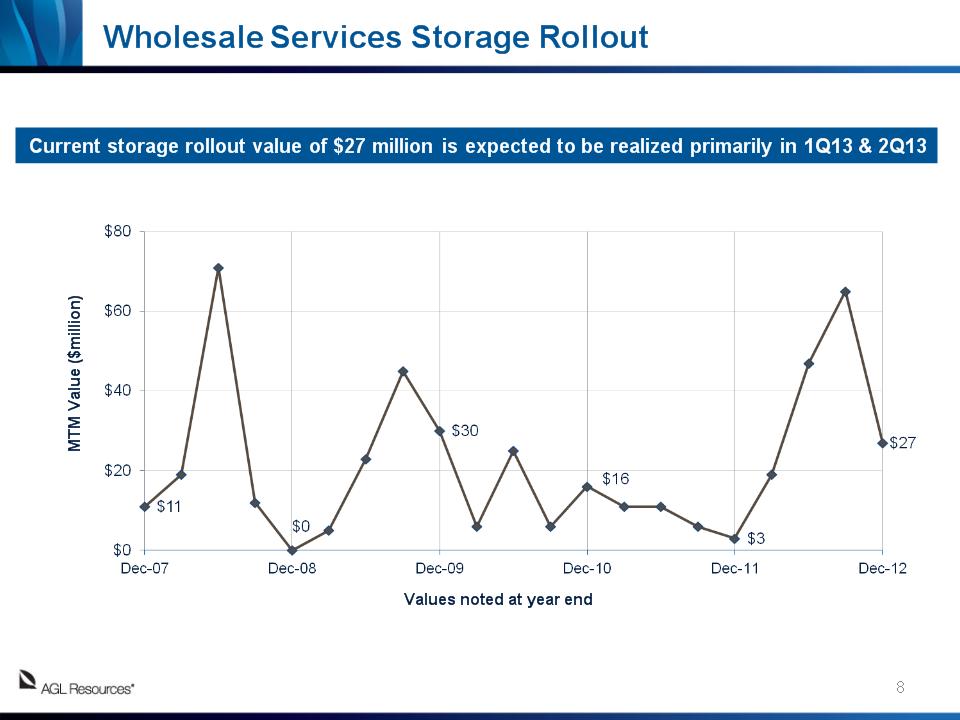
* Wholesale Services Storage Rollout Current storage rollout value of $27 million is expected to be realized primarily in 1Q13 & 2Q13 MTM Value ($million) Values noted at year end
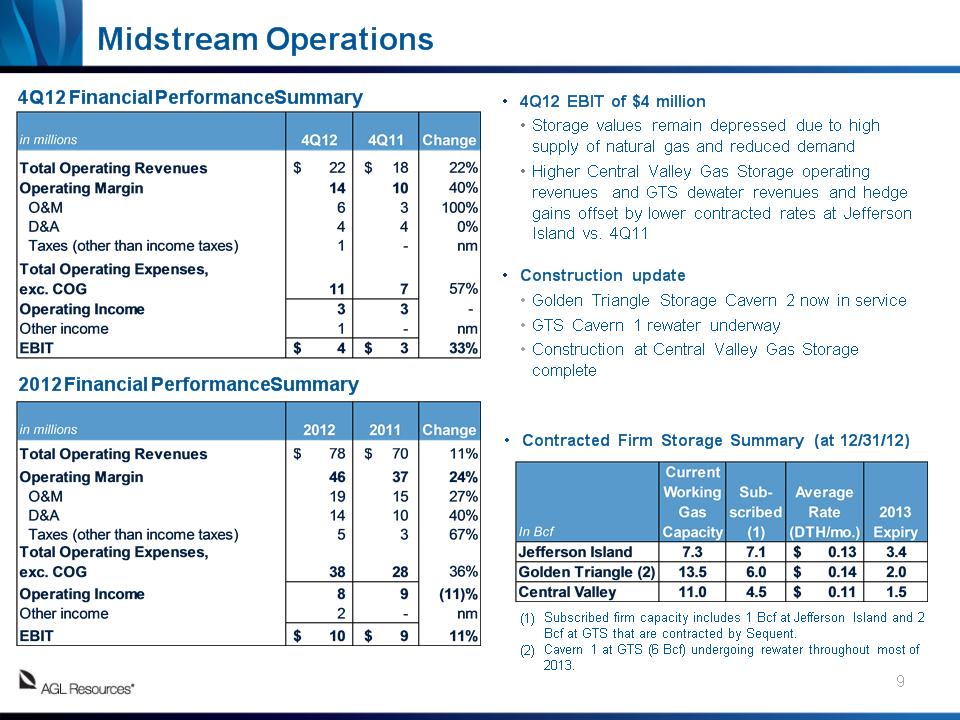
Midstream Operations 4Q12 EBIT of $4 million Storage values remain depressed due to high supply of natural gas and reduced demand Higher Central Valley Gas Storage operating revenues and GTS dewater revenues and hedge gains offset by lower contracted rates at Jefferson Island vs. 4Q11 Construction update Golden Triangle Storage Cavern 2 now in service GTS Cavern 1 rewater underway Construction at Central Valley Gas Storage complete 4Q12 Financial Performance Summary Contracted Firm Storage Summary (at 12/31/12) * Subscribed firm capacity includes 1 Bcf at Jefferson Island and 2 Bcf at GTS that are contracted by Sequent. Cavern 1 at GTS (6 Bcf) undergoing rewater throughout most of 2013. 2012 Financial Performance Summary
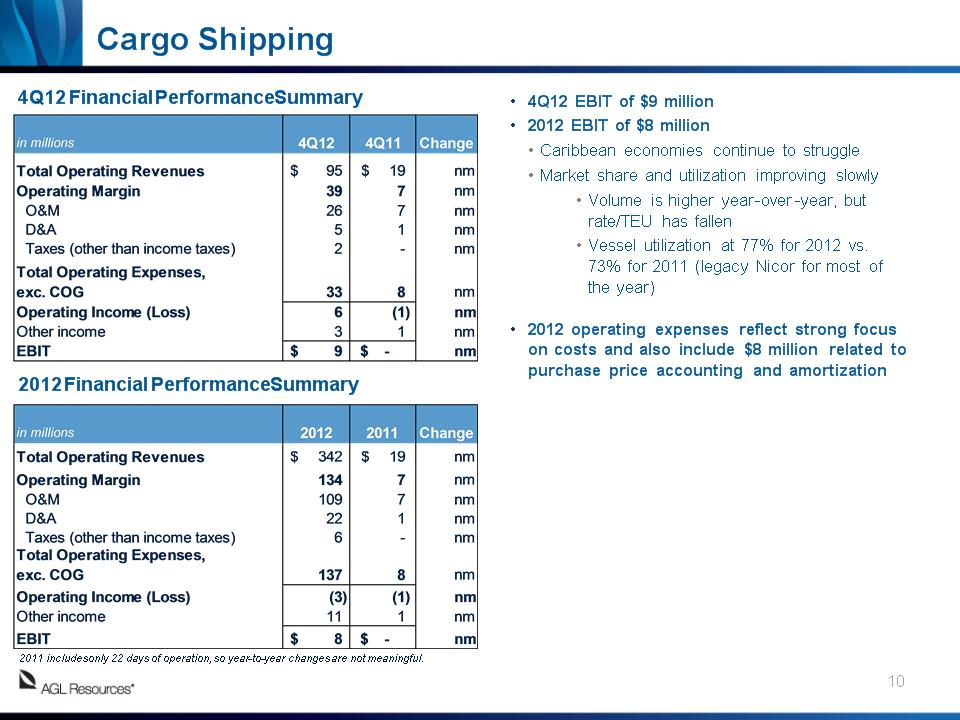
Cargo Shipping 4Q12 EBIT of $9 million 2012 EBIT of $8 million Caribbean economies continue to struggle Market share and utilization improving slowly Volume is higher year-over-year, but rate/TEU has fallen Vessel utilization at 77% for 2012 vs. 73% for 2011 (legacy Nicor for most of the year) 2012 operating expenses reflect strong focus on costs and also include $8 million related to purchase price accounting and amortization 4Q12 Financial Performance Summary * 2012 Financial Performance Summary 2011 includes only 22 days of operation, so year-to-year changes are not meaningful.
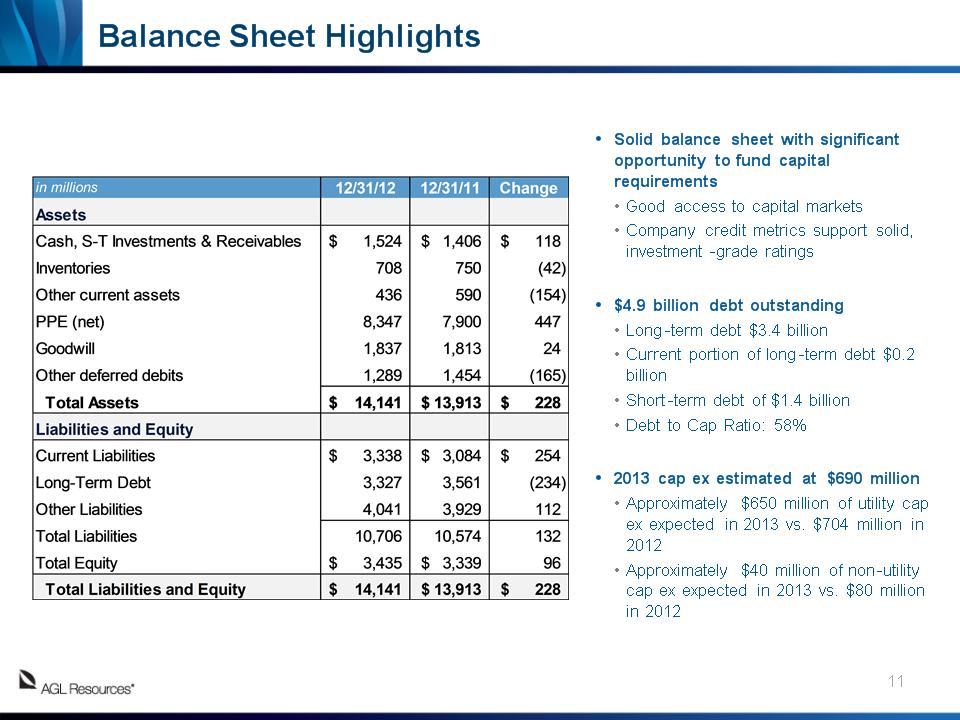
Balance Sheet Highlights Solid balance sheet with significant opportunity to fund capital requirements Good access to capital markets Company credit metrics support solid, investment-grade ratings $4.9 billion debt outstanding Long-term debt $3.4 billion Current portion of long-term debt $0.2 billion Short-term debt of $1.4 billion Debt to Cap Ratio: 58% 2013 cap ex estimated at $690 million Approximately $650 million of utility cap ex expected in 2013 vs. $704 million in 2012 Approximately $40 million of non-utility cap ex expected in 2013 vs. $80 million in 2012 *
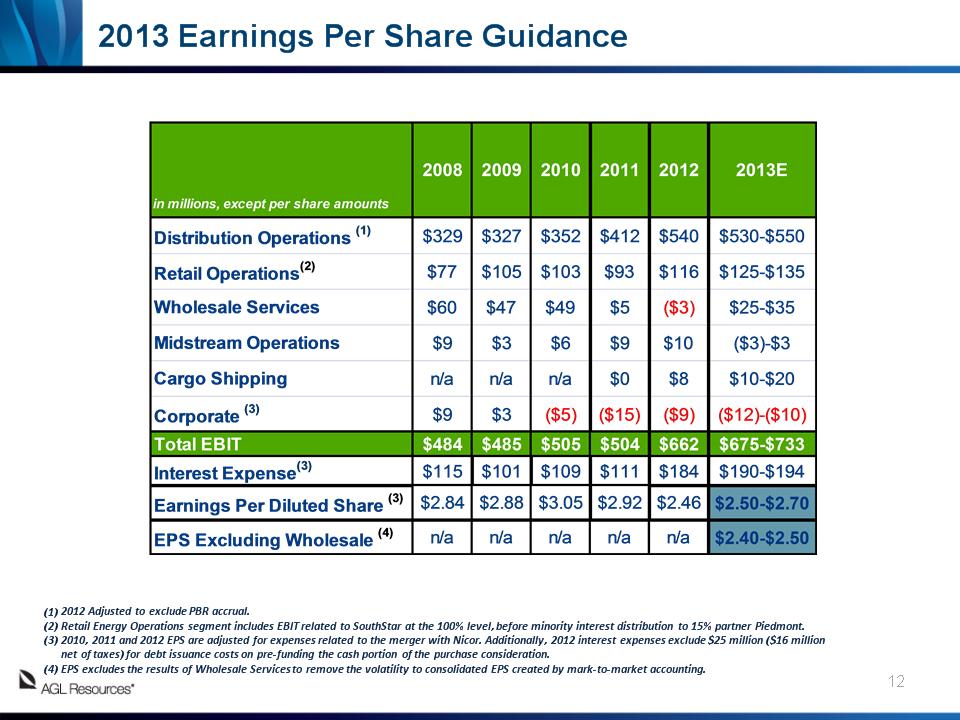
2013 Earnings Per Share Guidance * 2012 Adjusted to exclude PBR accrual. Retail Energy Operations segment includes EBIT related to SouthStar at the 100% level, before minority interest distribution to 15% partner Piedmont. 2010, 2011 and 2012 EPS are adjusted for expenses related to the merger with Nicor. Additionally, 2012 interest expenses exclude $25 million ($16 million net of taxes) for debt issuance costs on pre-funding the cash portion of the purchase consideration. EPS excludes the results of Wholesale Services to remove the volatility to consolidated EPS created by mark-to-market accounting.
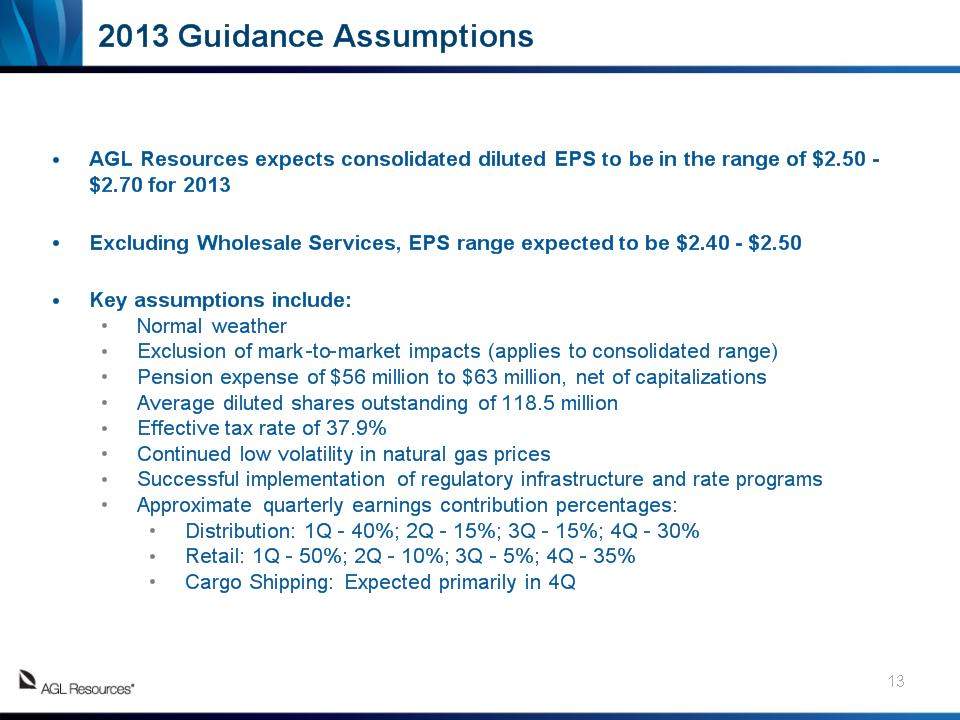
2013 Guidance Assumptions * AGL Resources expects consolidated diluted EPS to be in the range of $2.50 - $2.70 for 2013 Excluding Wholesale Services, EPS range expected to be $2.40 - $2.50 Key assumptions include: Normal weather Exclusion of mark-to-market impacts (applies to consolidated range) Pension expense of $56 million to $63 million, net of capitalizations Average diluted shares outstanding of 118.5 million Effective tax rate of 37.9% Continued low volatility in natural gas prices Successful implementation of regulatory infrastructure and rate programs Approximate quarterly earnings contribution percentages: Distribution: 1Q – 40%; 2Q – 15%; 3Q – 15%; 4Q – 30% Retail: 1Q – 50%; 2Q – 10%; 3Q – 5%; 4Q – 35% Cargo Shipping: Expected primarily in 4Q
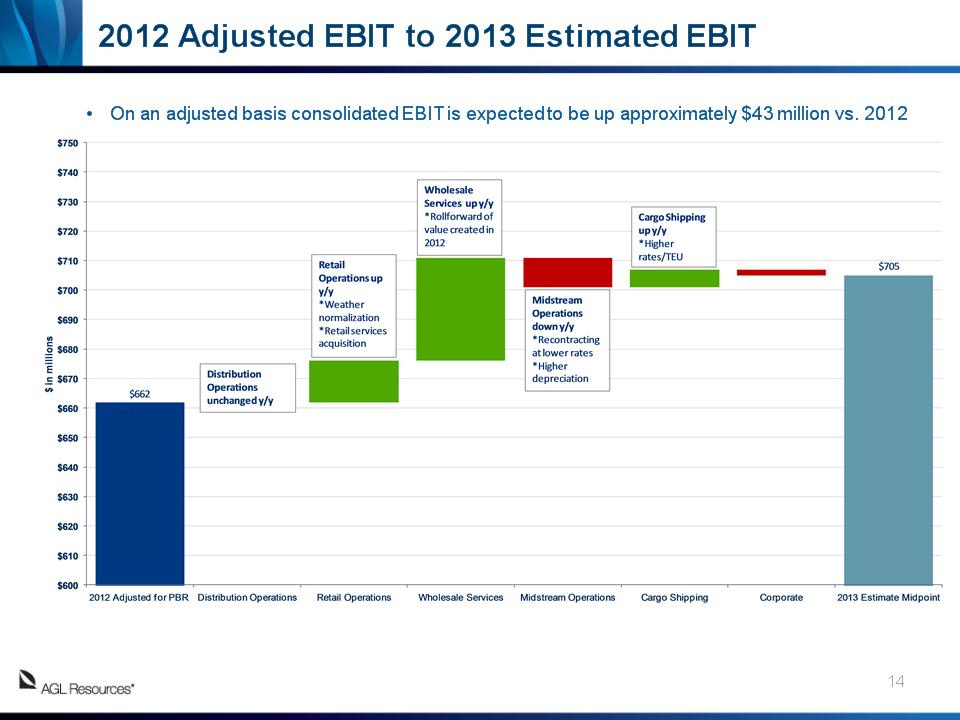
2012 Adjusted EBIT to 2013 Estimated EBIT * On an adjusted basis consolidated EBIT is expected to be up approximately $43 million vs. 2012
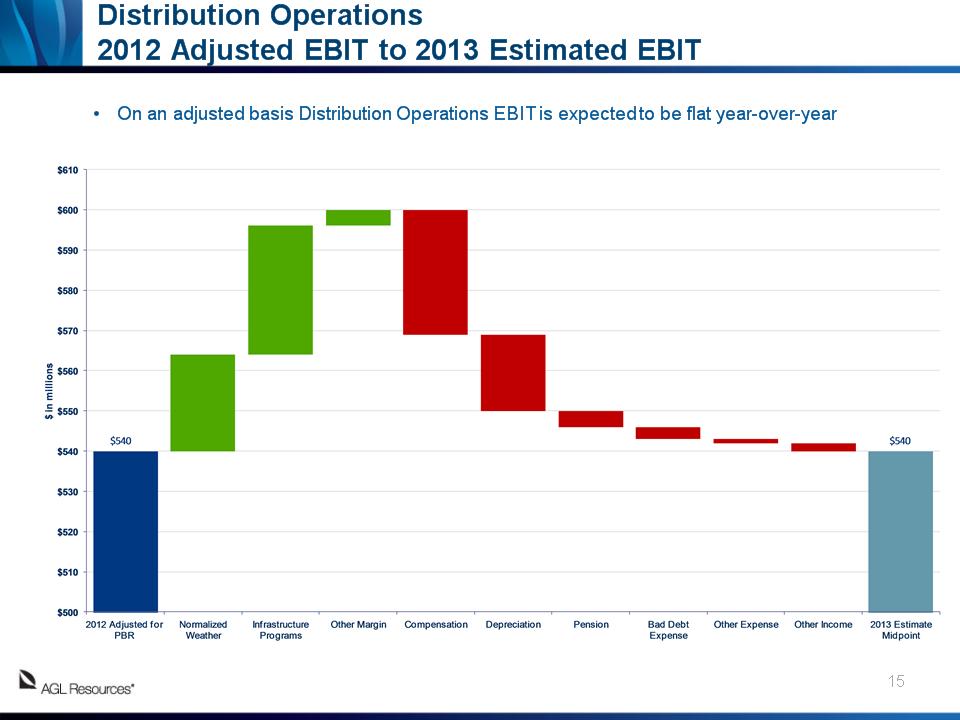
Distribution Operations 2012 Adjusted EBIT to 2013 Estimated EBIT * On an adjusted basis Distribution Operations EBIT is expected to be flat year-over-year
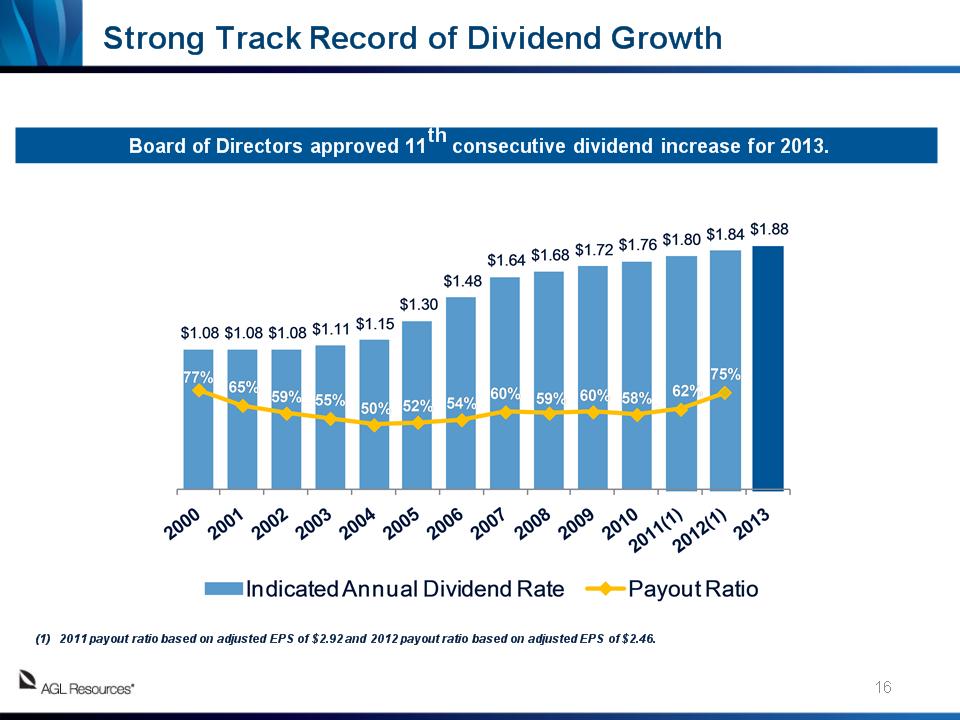
Strong Track Record of Dividend Growth * Board of Directors approved 11th consecutive dividend increase for 2013. 2011 payout ratio based on adjusted EPS of $2.92 and 2012 payout ratio based on adjusted EPS of $2.46.
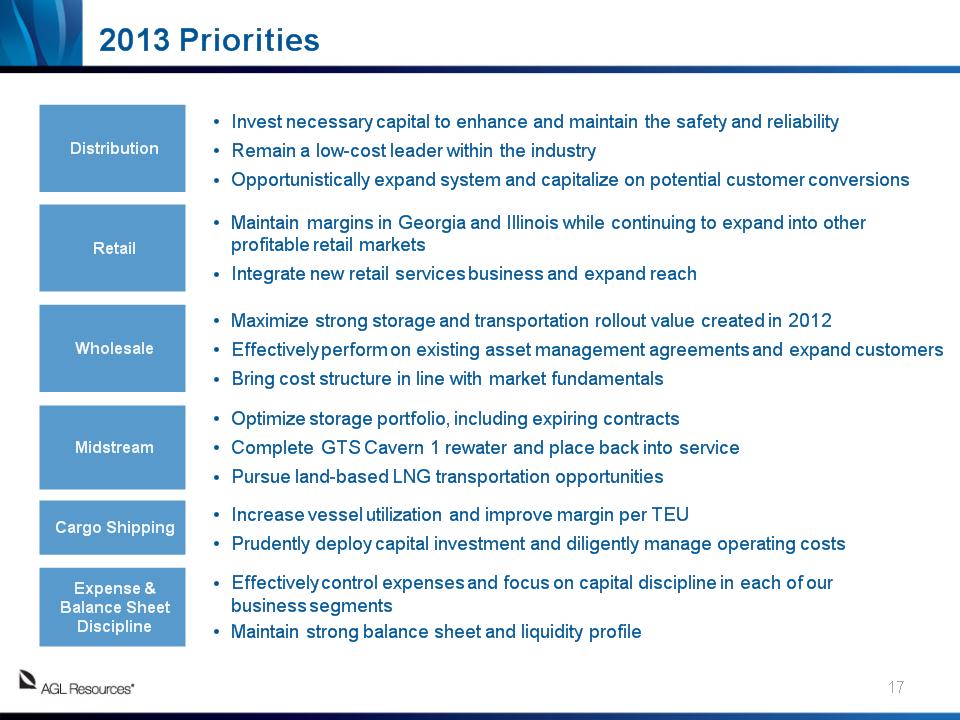
2013 Priorities Invest necessary capital to enhance and maintain the safety and reliability Remain a low-cost leader within the industry Opportunistically expand system and capitalize on potential customer conversions Maintain margins in Georgia and Illinois while continuing to expand into other profitable retail markets Integrate new retail services business and expand reach Maximize strong storage and transportation rollout value created in 2012 Effectively perform on existing asset management agreements and expand customers Bring cost structure in line with market fundamentals Distribution Retail Wholesale Midstream Cargo Shipping Expense & Balance Sheet Discipline Optimize storage portfolio, including expiring contracts Complete GTS Cavern 1 rewater and place back into service Pursue land-based LNG transportation opportunities Effectively control expenses and focus on capital discipline in each of our business segments Maintain strong balance sheet and liquidity profile Increase vessel utilization and improve margin per TEU Prudently deploy capital investment and diligently manage operating costs *
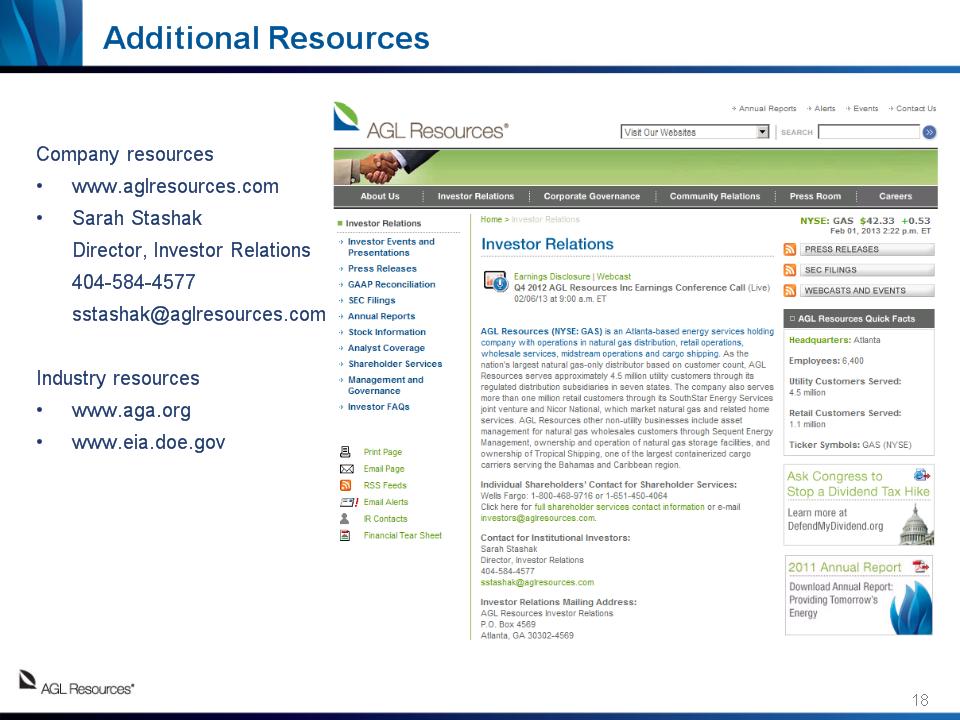
Additional Resources Company resources www.aglresources.com Sarah Stashak Director, Investor Relations 404-584-4577 sstashak@aglresources.com Industry resources www.aga.org www.eia.doe.gov *
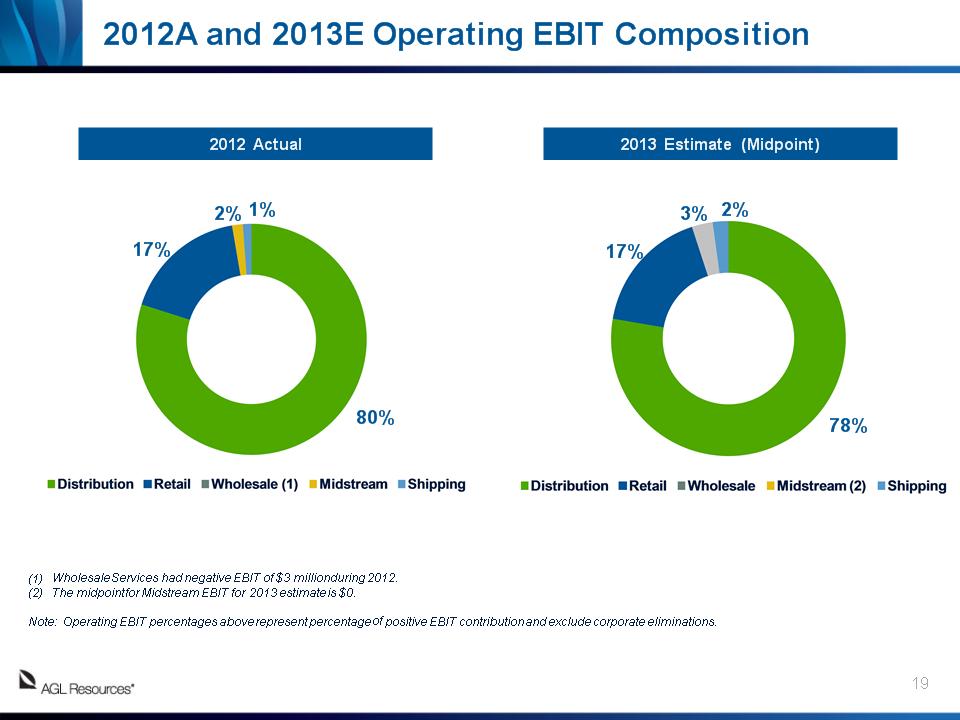
2012A and 2013E Operating EBIT Composition * 2012 Actual Wholesale Services had negative EBIT of $3 million during 2012. The midpoint for Midstream EBIT for 2013 estimate is $0. Note: Operating EBIT percentages above represent percentage of positive EBIT contribution and exclude corporate eliminations. 80% 1% 17% 2% 2013 Estimate (Midpoint) 78% 2% 17% 3%
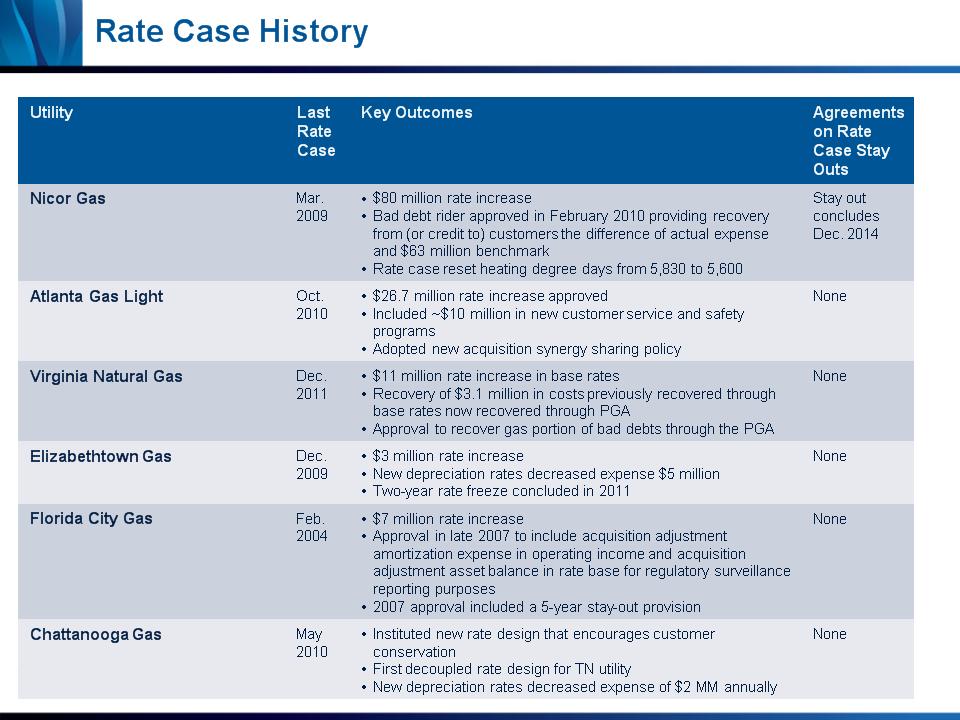
Rate Case History * Utility Last Rate Case Key Outcomes Agreements on Rate Case Stay Outs Nicor Gas Mar. 2009 $80 million rate increase Bad debt rider approved in February 2010 providing recovery from (or credit to) customers the difference of actual expense and $63 million benchmark Rate case reset heating degree days from 5,830 to 5,600 Stay out concludes Dec. 2014 Atlanta Gas Light Oct. 2010 $26.7 million rate increase approved Included ~$10 million in new customer service and safety programs Adopted new acquisition synergy sharing policy None Virginia Natural Gas Dec. 2011 $11 million rate increase in base rates Recovery of $3.1 million in costs previously recovered through base rates now recovered through PGA Approval to recover gas portion of bad debts through the PGA None Elizabethtown Gas Dec. 2009 $3 million rate increase New depreciation rates decreased expense $5 million Two-year rate freeze concluded in 2011 None Florida City Gas Feb. 2004 $7 million rate increase Approval in late 2007 to include acquisition adjustment amortization expense in operating income and acquisition adjustment asset balance in rate base for regulatory surveillance reporting purposes 2007 approval included a 5-year stay-out provision None Chattanooga Gas May 2010 Instituted new rate design that encourages customer conservation First decoupled rate design for TN utility New depreciation rates decreased expense of $2 MM annually None
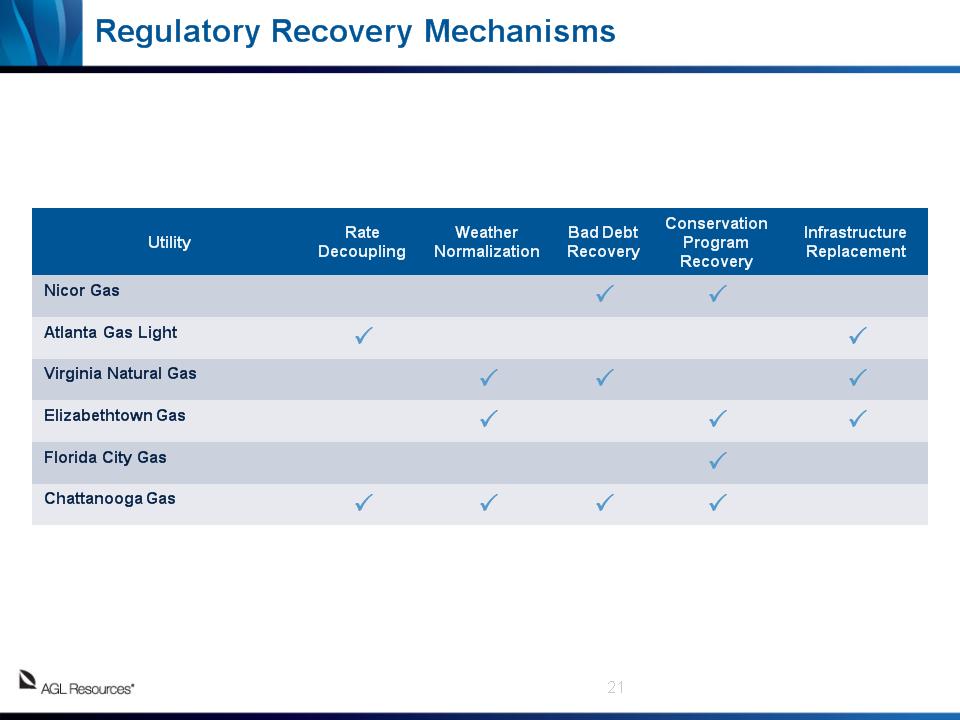
Regulatory Recovery Mechanisms Utility Rate Decoupling Weather Normalization Bad Debt Recovery Conservation Program Recovery Infrastructure Replacement Nicor Gas P P Atlanta Gas Light P P Virginia Natural Gas P P P Elizabethtown Gas P P P Florida City Gas P Chattanooga Gas P P P P *
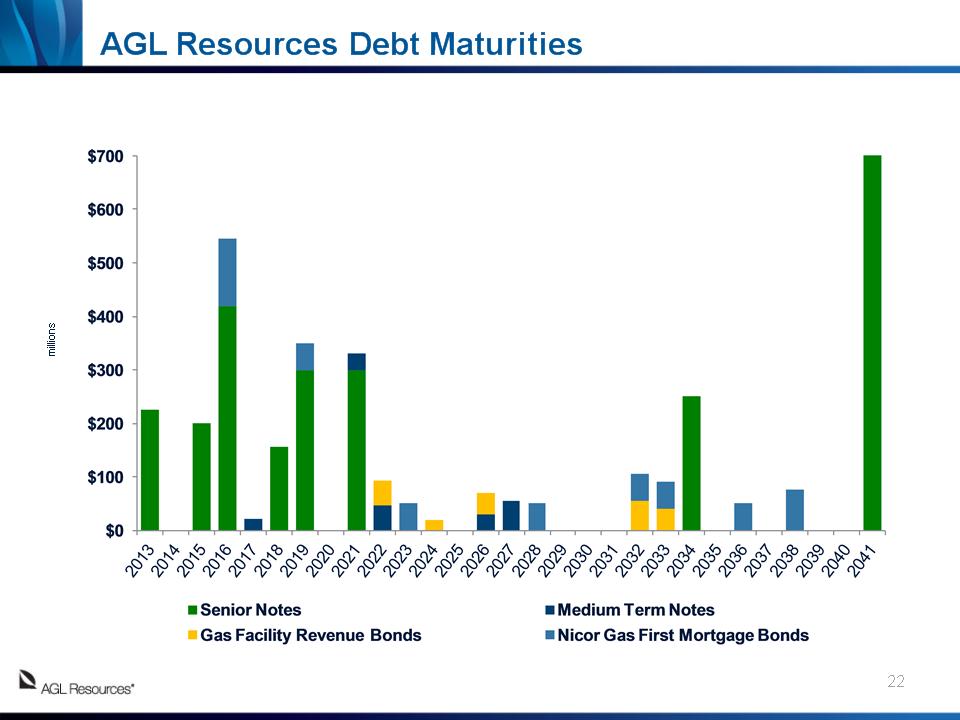
AGL Resources Debt Maturities millions *
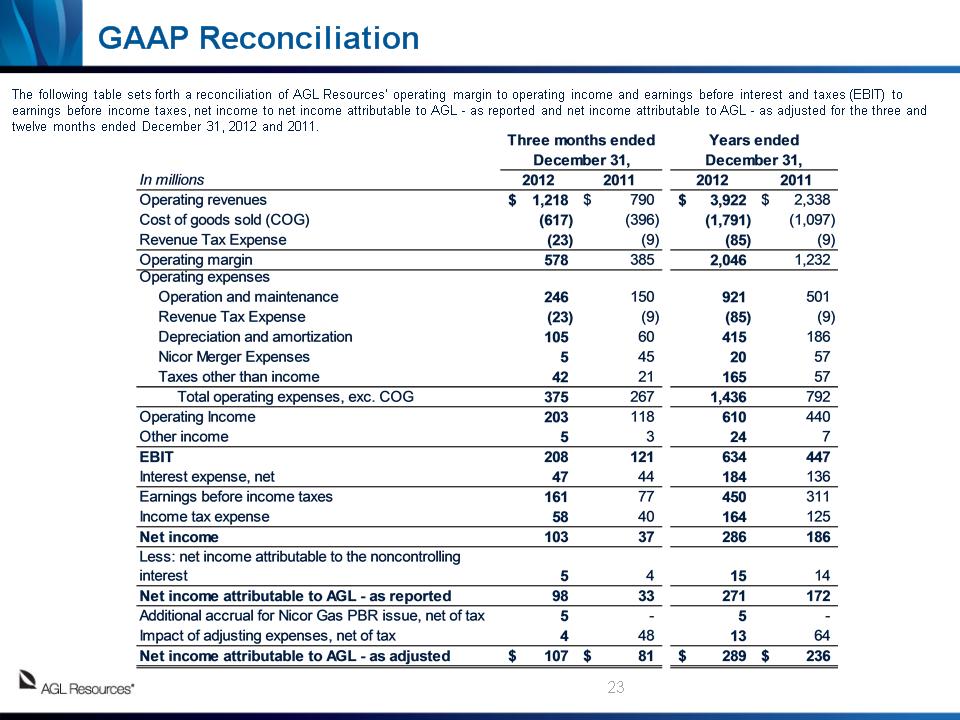
The following table sets forth a reconciliation of AGL Resources’ operating margin to operating income and earnings before interest and taxes (EBIT) to earnings before income taxes, net income to net income attributable to AGL – as reported and net income attributable to AGL – as adjusted for the three and twelve months ended December 31, 2012 and 2011. GAAP Reconciliation *
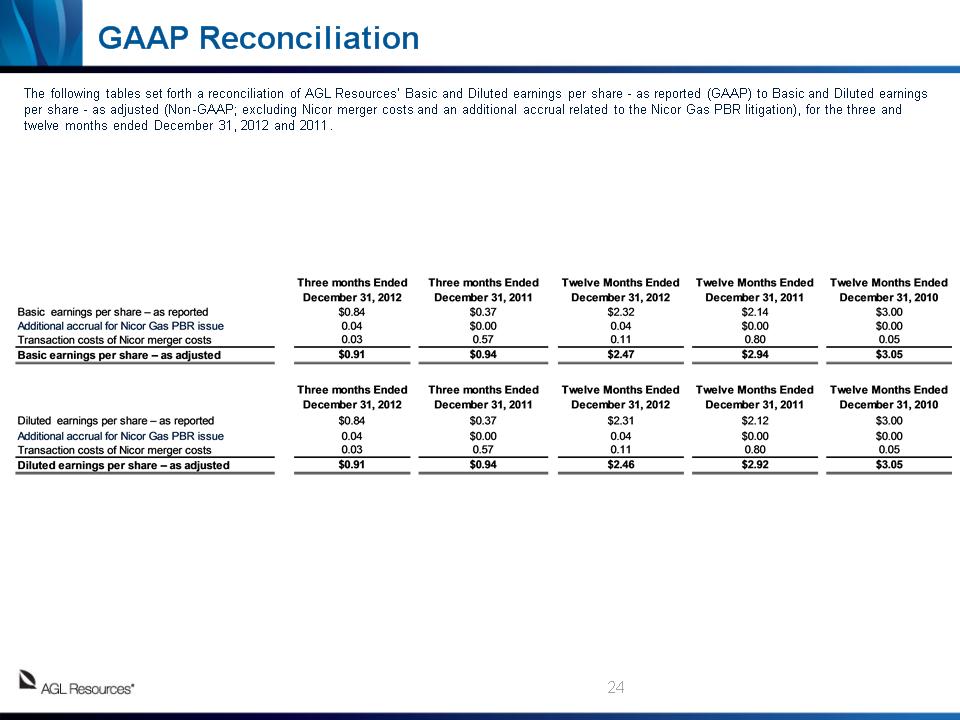
* The following tables set forth a reconciliation of AGL Resources’ Basic and Diluted earnings per share – as reported (GAAP) to Basic and Diluted earnings per share – as adjusted (Non-GAAP; excluding Nicor merger costs and an additional accrual related to the Nicor Gas PBR litigation), for the three and twelve months ended December 31, 2012 and 2011. GAAP Reconciliation
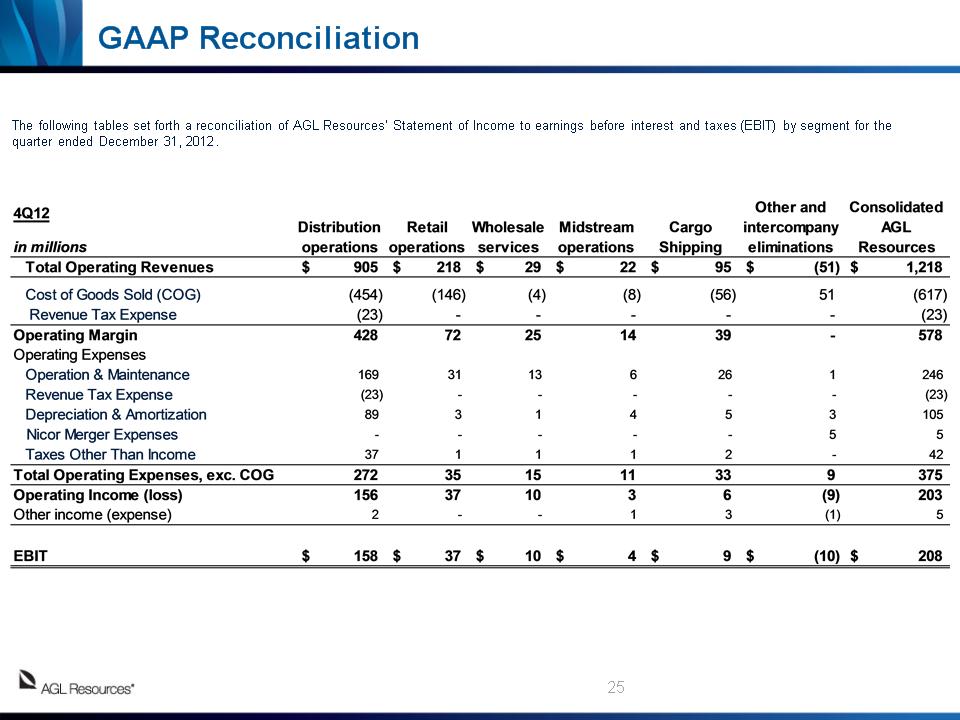
The following tables set forth a reconciliation of AGL Resources’ Statement of Income to earnings before interest and taxes (EBIT) by segment for the quarter ended December 31, 2012. * GAAP Reconciliation
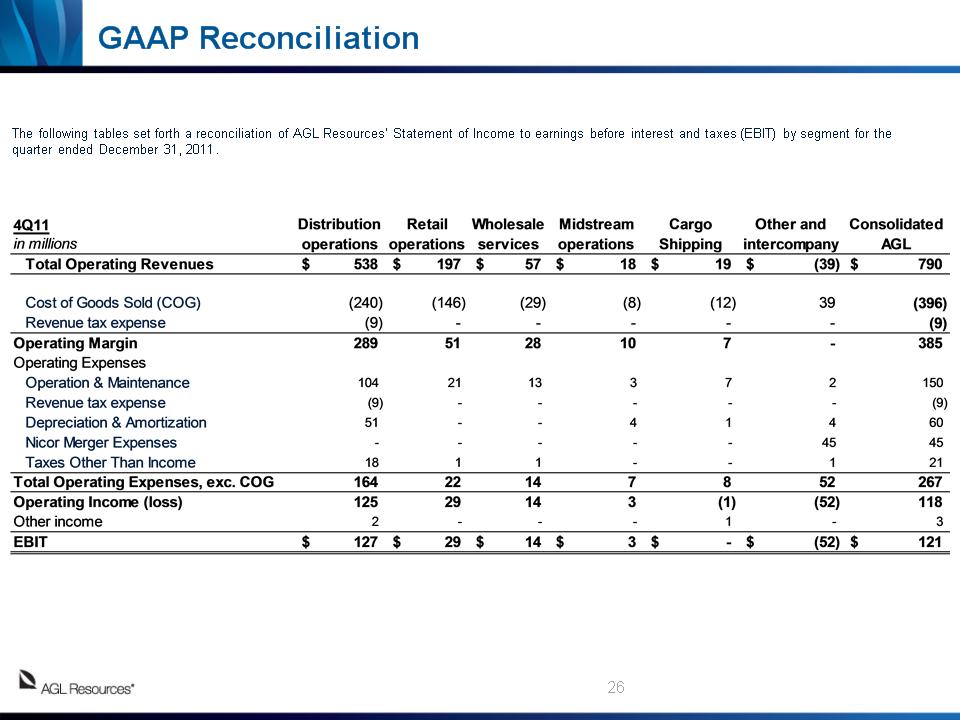
The following tables set forth a reconciliation of AGL Resources’ Statement of Income to earnings before interest and taxes (EBIT) by segment for the quarter ended December 31, 2011. * GAAP Reconciliation
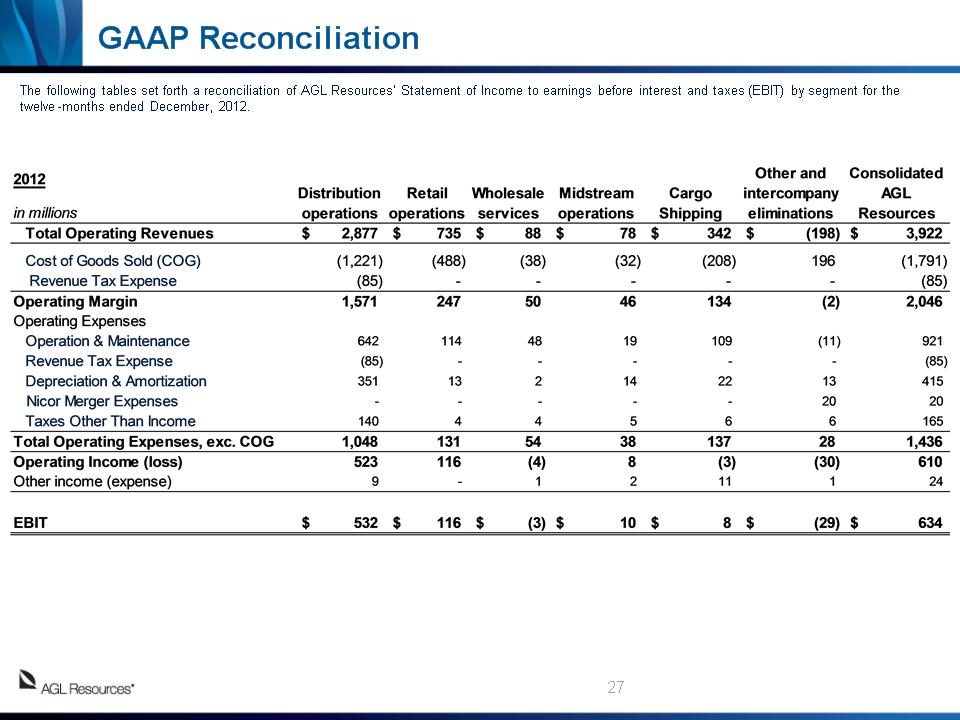
The following tables set forth a reconciliation of AGL Resources’ Statement of Income to earnings before interest and taxes (EBIT) by segment for the twelve-months ended December, 2012. * GAAP Reconciliation
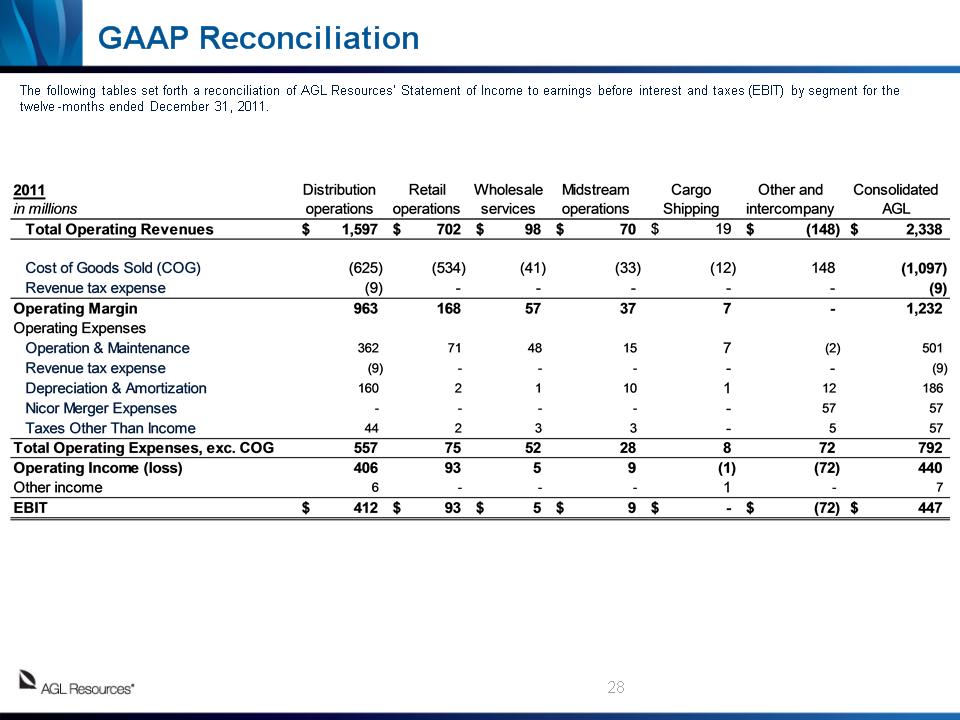
The following tables set forth a reconciliation of AGL Resources’ Statement of Income to earnings before interest and taxes (EBIT) by segment for the twelve-months ended December 31, 2011. * GAAP Reconciliation
Reconciliations of operating margin, EBIT by segment, adjusted net income and adjusted EPS are available in our quarterly reports (Form 10-Q) and annual reports (Form 10-K) filed with the Securities and Exchange Commission and on the Investor Relations section of our website at www.aglresources.com. Our management evaluates segment financial performance based on operating margin and EBIT, which includes the effects of corporate expense allocations. EBIT is a non-GAAP (accounting principles generally accepted in the United States of America) financial measure. Items that are not included in EBIT are income taxes and financing costs, including debt and interest, each of which the company evaluates on a consolidated basis. The company believes EBIT is a useful measurement of its performance because it provides information that can be used to evaluate the effectiveness of its businesses from an operational perspective, exclusive of the costs to finance those activities and exclusive of income taxes, neither of which is directly relevant to the efficiency of those operations. We also use EBIT internally to measure performance against budget and in reports for management and the Board of Directors. Projections of forward-looking EBIT are used in our internal budgeting process, and those projections are used in providing forward-looking business segment EBIT projections to investors. We are unable to reconcile our forward-looking EBIT business segment guidance to GAAP net income, because we do not predict the future impact of unusual items and mark-to-market gains or losses on energy contracts. The impact of these items could be material to our operating results reported in accordance with GAAP. Operating margin is a non-GAAP measure calculated as revenues minus cost of goods sold and revenue taxes, excluding operation and maintenance expense, depreciation and amortization, certain taxes other than income taxes and the gain or loss on the sale of assets, if any. These items are included in our calculation of operating income. We believe operating margin is a better indicator than operating revenues of the contribution resulting from customer growth, since cost of goods sold and revenue taxes are generally passed directly through to customers. We present our net income and our EPS excluding expenses incurred with respect to the merger with Nicor. As we do not routinely engage in transactions of the magnitude of the Nicor merger, and consequently do not regularly incur transaction related expenses of correlative size, we believe presenting our EPS excluding Nicor merger expenses provides investors with an additional measure of our core operating performance. Net income attributable to AGL Resources, as adjusted, and Basic and Diluted earnings per share, as adjusted, are non-GAAP measures and exclude transaction costs related to the merger with Nicor. Transaction costs include O&M expenses as well as incremental debt issuance costs and interest expense related to financing the cash portion of the purchase consideration in advance of the merger closing date. The company also uses a non-GAAP measure when it presents the impact of warmer-than-normal weather on its diluted EPS. EBIT, operating margin, net income excluding merger expenses, EPS excluding merger expenses and the impact of warmer-than-normal weather should not be considered as alternatives to, or more meaningful indicators of, our operating performance than operating income, net income attributable to AGL Resources Inc. or EPS as determined in accordance with GAAP. In addition, our EBIT, operating margin, adjusted net income and adjusted EPS may not be comparable to similarly titled measures of another company. We believe these financial measures are useful to investors because they provide an alternative method for assessing the Company’s operating results in a manner that is focused on the performance of the Company’s ongoing operations. The presentation of these financial measures is not meant to be a substitute for financial measures prepared in accordance with GAAP. * GAAP Reconciliation

Q&A