Attached files
| file | filename |
|---|---|
| 8-K - 8-K - COWEN INC. | a13-4315_18k.htm |
| EX-99.1 - EX-99.1 - COWEN INC. | a13-4315_1ex99d1.htm |
Exhibit 99.2
|
|
February 4, 2013 Cowen Group, Inc. Investor Presentation on the Acquisition of Dahlman Rose & Co. |
|
|
Cautionary Notice Regarding Forward-Looking Statements This presentation may contain forward-looking statements including statements relating to the market opportunity and future business prospects of Cowen and Dahlman Rose. Such statements are subject to certain risks and uncertainties that could cause actual results to differ materially from those expressed or implied in the forward-looking statements. Consequently, all forward-looking statements made during this communication are qualified by those risks, uncertainties and other factors. Actual results may differ materially and reported results should not be considered an indication of future performance. Please reference the SEC filings of Cowen, which is available on its website, for detailed descriptions of factors that could cause actual results to differ materially from those expressed or implied in such forward-looking statements. Certain statements in this communication relate to future results that are forward-looking statements as defined in the Private Securities Litigation Reform Act of 1995. Except for the ongoing obligations of Cowen and Dahlman Rose to disclose material information under the federal securities laws, neither Cowen nor Dahlman Rose undertakes any obligation to release any revisions to any forward-looking statements, to report events or to report the occurrence of unanticipated events unless required by law. 2 |
|
|
3 “At Cowen, we are dedicated to providing our clients with access to unparalleled domain knowledge, thoughtful advice and practical insights that will enable them to be better investors, business operators and decision makers.” |
|
|
4 Transaction Details Transaction Cowen Group to acquire 100% of issued and outstanding equity of Dahlman Rose Definitive agreement signed; approved by Cowen Group Board of Directors Consideration • All-stock; financial terms undisclosed Approvals Subject to customary closing conditions and regulatory approvals Timetable Anticipate closing in the first quarter of 2013 |
|
|
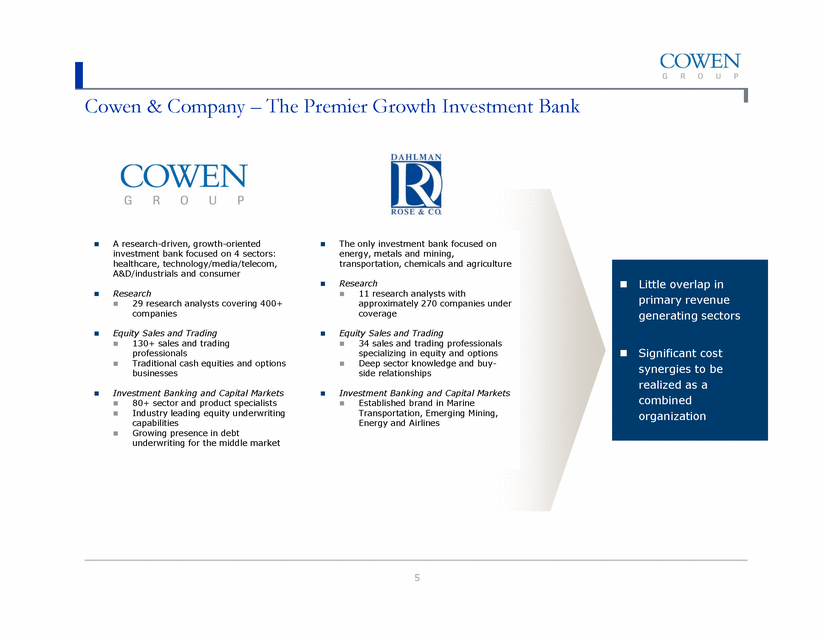
5 Cowen & Company – The Premier Growth Investment Bank A research-driven, growth-oriented investment bank focused on 4 sectors: healthcare, technology/media/telecom, A&D/industrials and consumer Research 29 research analysts covering 400+ companies Equity Sales and Trading 130+ sales and trading professionals Traditional cash equities and options businesses Investment Banking and Capital Markets 80+ sector and product specialists Industry leading equity underwriting capabilities Growing presence in debt underwriting for the middle market The only investment bank focused on energy, metals and mining, transportation, chemicals and agriculture Research 11 research analysts with approximately 270 companies under coverage Equity Sales and Trading 34 sales and trading professionals specializing in equity and options Deep sector knowledge and buyside relationships Investment Banking and Capital Markets Established brand in Marine Transportation, Emerging Mining, Energy and Airlines Little overlap in primary revenue generating sectors Significant cost synergies to be realized as a combined organization |
|
|
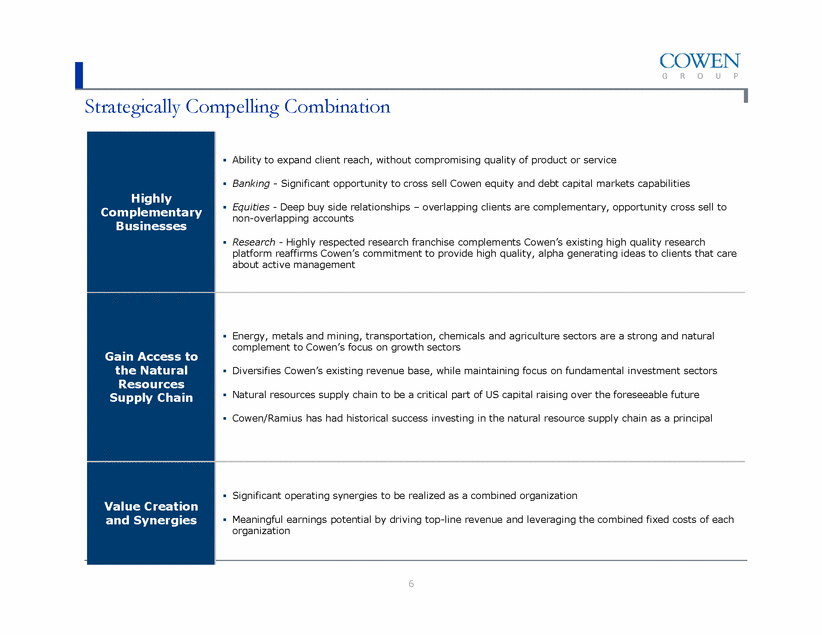
6 Strategically Compelling Combination Highly Complementary Businesses Ability to expand client reach, without compromising quality of product or service Banking - Significant opportunity to cross sell Cowen equity and debt capital markets capabilities Equities - Deep buy side relationships – overlapping clients are complementary, opportunity cross sell to non-overlapping accounts Research - Highly respected research franchise complements Cowen’s existing high quality research platform reaffirms Cowen’s commitment to provide high quality, alpha generating ideas to clients that care about active management Gain Access to the Natural Resources Supply Chain Energy, metals and mining, transportation, chemicals and agriculture sectors are a strong and natural complement to Cowen’s focus on growth sectors Diversifies Cowen’s existing revenue base, while maintaining focus on fundamental investment sectors Natural resources supply chain to be a critical part of US capital raising over the foreseeable future Cowen/Ramius has had historical success investing in the natural resource supply chain as a principal Value Creation and Synergies Significant operating synergies to be realized as a combined organization Meaningful earnings potential by driving top-line revenue and leveraging the combined fixed costs of each organization |
|
|
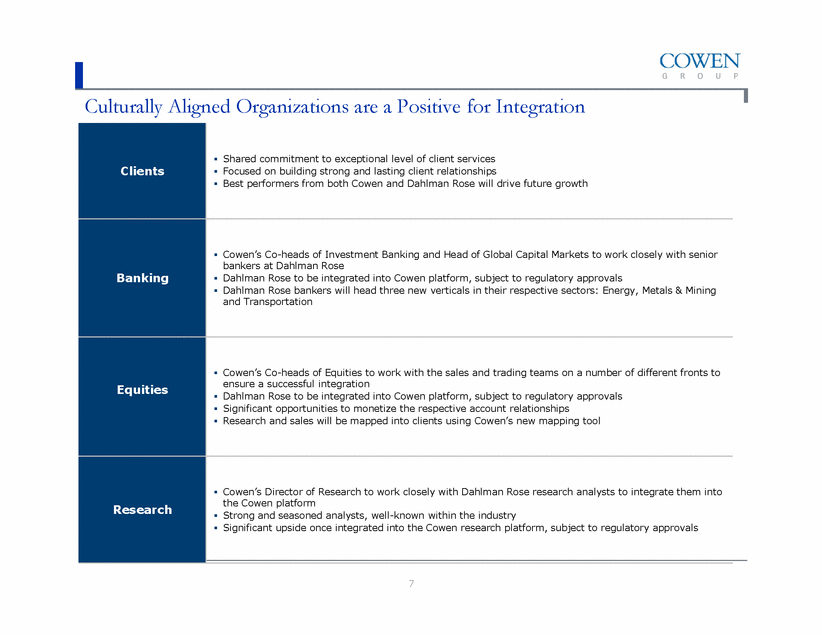
7 Culturally Aligned Organizations are a Positive for Integration Clients Shared commitment to exceptional level of client services Focused on building strong and lasting client relationships Best performers from both Cowen and Dahlman Rose will drive future growth Banking Cowen’s Co-heads of Investment Banking and Head of Global Capital Markets to work closely with senior bankers at Dahlman Rose Dahlman Rose to be integrated into Cowen platform, subject to regulatory approvals Dahlman Rose bankers will head three new verticals in their respective sectors: Energy, Metals & Mining and Transportation Equities Cowen’s Co-heads of Equities to work with the sales and trading teams on a number of different fronts to ensure a successful integration Dahlman Rose to be integrated into Cowen platform, subject to regulatory approvals Significant opportunities to monetize the respective account relationships Research and sales will be mapped into clients using Cowen’s new mapping tool Research Cowen’s Director of Research to work closely with Dahlman Rose research analysts to integrate them into the Cowen platform Strong and seasoned analysts, well-known within the industry Significant upside once integrated into the Cowen research platform, subject to regulatory approvals |
|
|
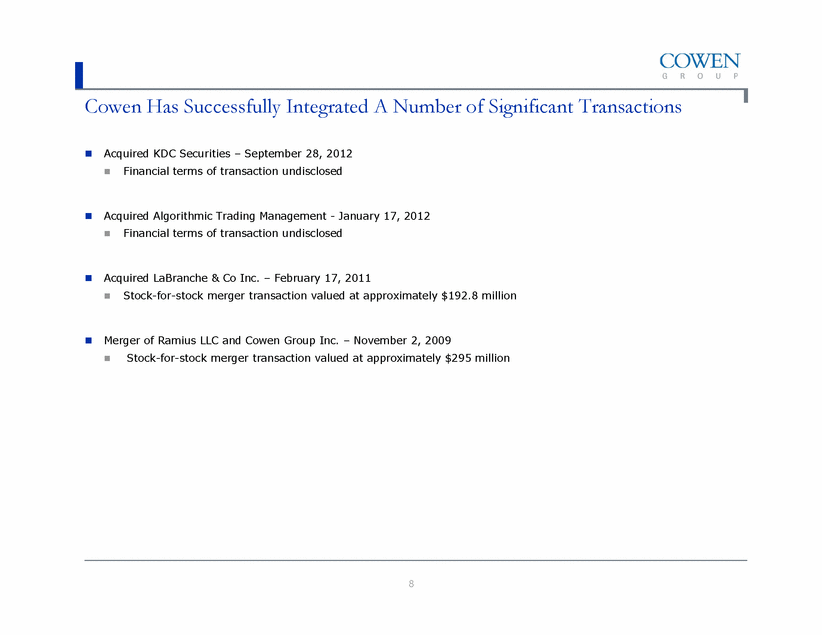
8 Cowen Has Successfully Integrated A Number of Significant Transactions Acquired KDC Securities – September 28, 2012 Financial terms of transaction undisclosed Acquired Algorithmic Trading Management - January 17, 2012 Financial terms of transaction undisclosed Acquired LaBranche & Co Inc. – February 17, 2011 Stock-for-stock merger transaction valued at approximately $192.8 million Merger of Ramius LLC and Cowen Group Inc. – November 2, 2009 Stock-for-stock merger transaction valued at approximately $295 million |
|
|
9 Investment Banking and Capital Markets – Already Top 10 Non-Bulge Equity Underwriter in Core Sectors + Note: ECM Analytics as of December 31, 2012. Includes priced IPOs and follow-ons in Cowen sectors from issuers with market values less than $5 billion. Excludes registered directs and PIPEs. Cowen sectors include health care, technology/media/telecommunications, aerospace & defense and consumer. Dahlman Rose sectors include: metals, mining, energy , transportation, chemicals and agriculture All Cowen Sectors — 2012 Firm Total # Fees (Est.) Mkt Share by Fees Fees per # 1. JP Morgan 53 178.2 12.9% 3.4 2. Morgan Stanley 38 139.6 10.1% 3.7 3. Goldman Sachs 32 117.6 8.5% 3.7 4. Credit Suisse 42 93.5 6.8% 2.2 5. BofA / Merrill Lynch 37 92.0 6.7% 2.5 6. Deutsche Bank 39 80.3 5.8% 2.1 7. Citi 35 71.3 5.2% 2.0 8. Barclays 25 57.1 4.1% 2.3 9. UBS 18 21.4 1.6% 1.2 Total Bulge Banks 851.0 $ 61.7% 2.7 $ 1. Jefferies 44 77.1 5.6% 1.8 2. Piper Jaffray 44 58.6 4.2% 1.3 3. Stifel Nicolaus Weisel 50 50.2 3.6% 1.0 4. Cowen 42 37.2 2.7% 0.9 5. Leerink 29 29.8 2.2% 1.0 6. William Blair 39 27.8 2.0% 0.7 7. RBC 26 20.0 1.4% 0.8 8. Needham 30 17.2 1.2% 0.6 9. Canaccord 35 16.2 1.2% 0.5 10. Lazard 20 15.5 1.1% 0.8 11. JMP Securities 29 15.3 1.1% 0.5 12. Wells Fargo 19 14.7 1.1% 0.8 13. Baird 16 14.0 1.0% 0.9 14. Oppenheimer & Co. 29 13.1 0.9% 0.5 15. Raymond James 19 9.7 0.7% 0.5 16. Roth 22 8.5 0.6% 0.4 17. KeyBanc Capital Markets 9 5.6 0.4% 0.6 18. Rodman & Renshaw 7 1.9 0.1% 0.3 19. FBR 2 0.9 0.1% 0.4 20. Cantor Fitzgerald 3 0.5 0.0% 0.2 21. Merriman 1 0.3 0.0% 0.3 22. Gleacher - - - - 23. Keefe Bruyette & Woods - - - - Other Banks 94.7 6.9% Total Small / Mid-Sized Banks 528.8 $ 38.3% 0.8 $ Total Sector 257 1,379.8 $ 5.4 $ - IPOs 70 573.5 $ 42% 8.2 $ - Follow-Ons 187 806.3 $ 58% 4.3 $ Dahlman Rose Sectors — 2012 Firm Total # Fees (Est.) Mkt Share by Fees Fees per # 1. Morgan Stanley 45 149.3 12.0% 3.3 2. Citi 53 111.8 9.0% 2.1 3. Credit Suisse 48 101.0 8.1% 2.1 4. BofA / Merrill Lynch 51 95.0 7.6% 1.9 5. Barclays 50 90.5 7.3% 1.8 6. JP Morgan 43 73.3 5.9% 1.7 7. Goldman Sachs 37 71.3 5.7% 1.9 8. UBS 43 65.4 5.3% 1.5 9. Deutsche Bank 42 49.0 3.9% 1.2 Total Bulge Banks 806.7 $ 64.9% 2.0 $ 1. Wells Fargo 62 83.5 6.7% 1.3 2. RBC 64 77.2 6.2% 1.2 3. Raymond James 42 51.5 4.1% 1.2 4. Jefferies 10 19.0 1.5% 1.9 5. Baird 28 16.4 1.3% 0.6 6. Stifel Nicolaus Weisel 25 13.8 1.1% 0.6 7. Oppenheimer & Co. 19 11.6 0.9% 0.6 8. Dahlman Rose 15 6.4 0.5% 0.4 9. Roth 7 4.4 0.4% 0.6 10. KeyBanc Capital Markets 4 4.0 0.3% 1.0 11. William Blair 7 3.8 0.3% 0.5 12. Piper Jaffray 2 3.6 0.3% 1.8 13. Lazard 5 2.9 0.2% 0.6 14. Canaccord 4 2.2 0.2% 0.6 15. FBR 1 0.7 0.1% 0.7 16. Needham 1 0.6 0.1% 0.6 17. Keefe Bruyette & Woods 1 0.3 0.0% 0.3 18. Cantor Fitzgerald - - - - 19. Cowen - - - - 20. Gleacher - - - - 21. JMP Securities - - - - 22. Merriman - - - - 23. Rodman & Renshaw - - - - Other Banks 134.9 10.8% Total Small / Mid-Sized Banks 436.9 $ 35.1% 1.0 $ Total Sector 148 1,243.6 $ 8.4 $ - IPOs 31 564.2 $ 45% 18.2 $ - Follow-Ons 117 679.3 $ 55% 5.8 $ All Cowen / Dahlman Rose Sectors — 2012 Firm Total # Fees (Est.) Mkt Share by Fees Fees per # 1. Morgan Stanley 80 280.0 11.0% 3.5 2. JP Morgan 93 240.1 9.4% 2.6 3. Barclays 74 145.6 5.7% 2.0 4. Citi 85 176.9 7.0% 2.1 5. BofA / Merrill Lynch 85 181.0 7.1% 2.1 6. Goldman Sachs 68 185.9 7.3% 2.7 7. Credit Suisse 87 188.0 7.4% 2.2 8. Deutsche Bank 80 128.3 5.0% 1.6 9. UBS 61 86.8 3.4% 1.4 Total Bulge Banks 1,612.6 $ 63.4% 2.3 $ 1. Wells Fargo 81 98.2 3.9% 1.2 2. RBC 89 96.1 3.8% 1.1 3. Jefferies 52 92.3 3.6% 1.8 4. Raymond James 59 59.2 2.3% 1.0 5. Stifel Nicolaus Weisel 72 61.3 2.4% 0.9 6. Piper Jaffray 45 56.4 2.2% 1.3 7. Cowen / Dahlman Rose 55 41.1 1.6% 0.7 8. William Blair 41 31.4 1.2% 0.8 9. Leerink 29 29.8 1.2% 1.0 10. Baird 43 29.1 1.1% 0.7 11. Oppenheimer & Co. 47 24.5 1.0% 0.5 12. Canaccord 36 17.4 0.7% 0.5 13. Needham 29 16.8 0.7% 0.6 14. JMP Securities 28 15.0 0.6% 0.5 15. Lazard 25 15.1 0.6% 0.6 16. Roth 27 13.0 0.5% 0.5 17. KeyBanc Capital Markets 15 9.3 0.4% 0.6 18. FBR 6 3.1 0.1% 0.5 19. Rodman & Renshaw 7 1.9 0.1% 0.3 20. Keefe Bruyette & Woods 1 0.6 0.0% 0.6 21. Cantor Fitzgerald 3 0.5 0.0% 0.2 22. Merriman 1 0.3 0.0% 0.3 23. Gleacher - - - - Other Banks 218.0 8.6% Total Small / Mid-Sized Banks 930.7 $ 36.6% 0.9 $ Total Sector 384 2,543.3 $ 6.6 $ - IPOs 100 1,130.6 $ 44% 11.3 $ - Follow-Ons 284 1,412.7 $ 56% 5.0 $ |
|
|
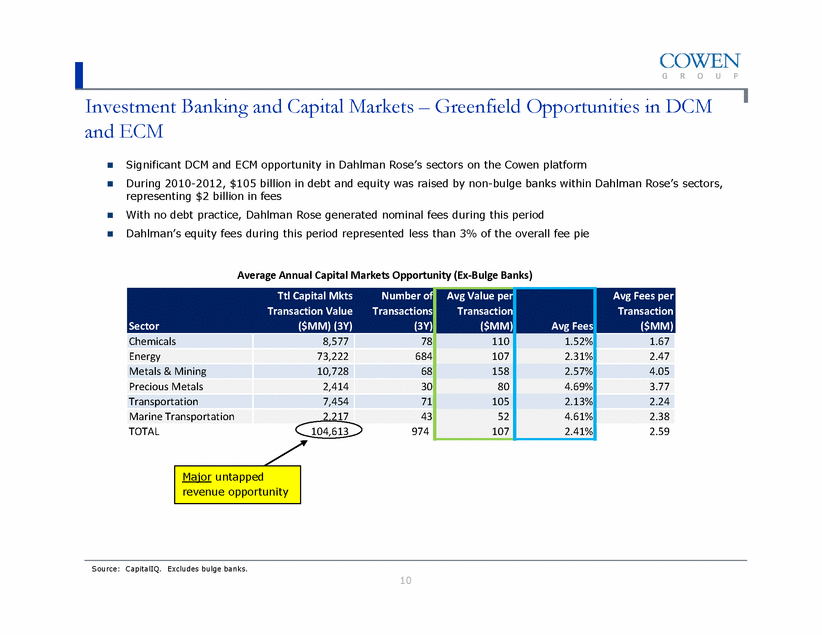
Investment Banking and Capital Markets – Greenfield Opportunities in DCM and ECM Source: CapitalIQ. Excludes bulge banks. Average Annual Capital Markets Opportunity (Ex-Bulge Banks) Sector Ttl Capital Mkts Transaction Value ($MM) (3Y) Number of Transactions (3Y) Avg Value per Transaction ($MM) Avg Fees Avg Fees per Transaction ($MM) Chemicals 8,577 78 110 1.52% 1.67 Energy 73,222 684 107 2.31% 2.47 Metals & Mining 10,728 68 158 2.57% 4.05 Precious Metals 2,414 30 80 4.69% 3.77 Transportation 7,454 71 105 2.13% 2.24 Marine Transportation 2,217 43 52 4.61% 2.38 TOTAL 104,613 974 107 2.41% 2.59 Significant DCM and ECM opportunity in Dahlman Rose’s sectors on the Cowen platform During 2010-2012, $105 billion in debt and equity was raised by non-bulge banks within Dahlman Rose’s sectors, representing $2 billion in fees With no debt practice, Dahlman Rose generated nominal fees during this period Dahlman’s equity fees during this period represented less than 3% of the overall fee pie Major untapped revenue opportunity 10 |
|
|
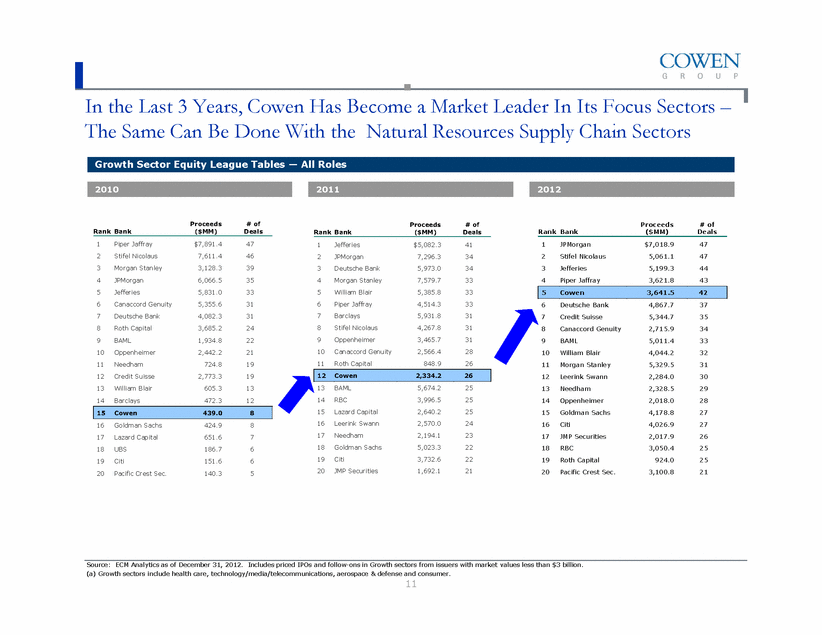
11 In the Last 3 Years, Cowen Has Become a Market Leader In Its Focus Sectors – The Same Can Be Done With the Natural Resources Supply Chain Sectors Source: ECM Analytics as of December 31, 2012. Includes priced IPOs and follow-ons in Growth sectors from issuers with market values less than $3 billion. (a) Growth sectors include health care, technology/media/telecommunications, aerospace & defense and consumer. Growth Sector Equity League Tables — All Roles Proceeds # of Rank Bank ($MM) Deals 1 Piper Jaffray $7,891.4 47 2 Stifel Nicolaus 7,611.4 46 3 Morgan Stanley 3,128.3 39 4 JPMorgan 6,066.5 35 5 Jefferies 5,831.0 33 6 Canaccord Genuity 5,355.6 31 7 Deutsche Bank 4,082.3 31 8 Roth Capital 3,685.2 24 9 BAML 1,934.8 22 10 Oppenheimer 2,442.2 21 11 Needham 724.8 19 12 Credit Suisse 2,773.3 19 13 William Blair 605.3 13 14 Barclays 472.3 12 15 Cowen 439.0 8 16 Goldman Sachs 424.9 8 17 Lazard Capital 651.6 7 18 UBS 186.7 6 19 Citi 151.6 6 20 Pacific Crest Sec. 140.3 5 2010 2012 2011 Proceeds # of Rank Bank ($MM) Deals 1 Jefferies $5,082.3 41 2 JPMorgan 7,296.3 34 3 Deutsche Bank 5,973.0 34 4 Morgan Stanley 7,579.7 33 5 William Blair 5,385.8 33 6 Piper Jaffray 4,514.3 33 7 Barclays 5,931.8 31 8 Stifel Nicolaus 4,267.8 31 9 Oppenheimer 3,465.7 31 10 Canaccord Genuity 2,566.4 28 11 Roth Capital 848.9 26 12 Cowen 2,334.2 26 13 BAML 5,674.2 25 14 RBC 3,996.5 25 15 Lazard Capital 2,640.2 25 16 Leerink Swann 2,570.0 24 17 Needham 2,194.1 23 18 Goldman Sachs 5,023.3 22 19 Citi 3,732.6 22 20 JMP Securities 1,692.1 21 Proceeds # of Rank Bank ($MM) Deals 1 JPMorgan $7,018.9 47 2 Stifel Nicolaus 5,061.1 47 3 Jefferies 5,199.3 44 4 Piper Jaffray 3,621.8 43 5 Cowen 3,641.5 42 6 Deutsche Bank 4,867.7 37 7 Credit Suisse 5,344.7 35 8 Canaccord Genuity 2,715.9 34 9 BAML 5,011.4 33 10 William Blair 4,044.2 32 11 Morgan Stanley 5,329.5 31 12 Leerink Swann 2,284.0 30 13 Needham 2,328.5 29 14 Oppenheimer 2,018.0 28 15 Goldman Sachs 4,178.8 27 16 Citi 4,026.9 27 17 JMP Securities 2,017.9 26 18 RBC 3,050.4 25 19 Roth Capital 924.0 25 20 Pacific Crest Sec. 3,100.8 21 |
|
|
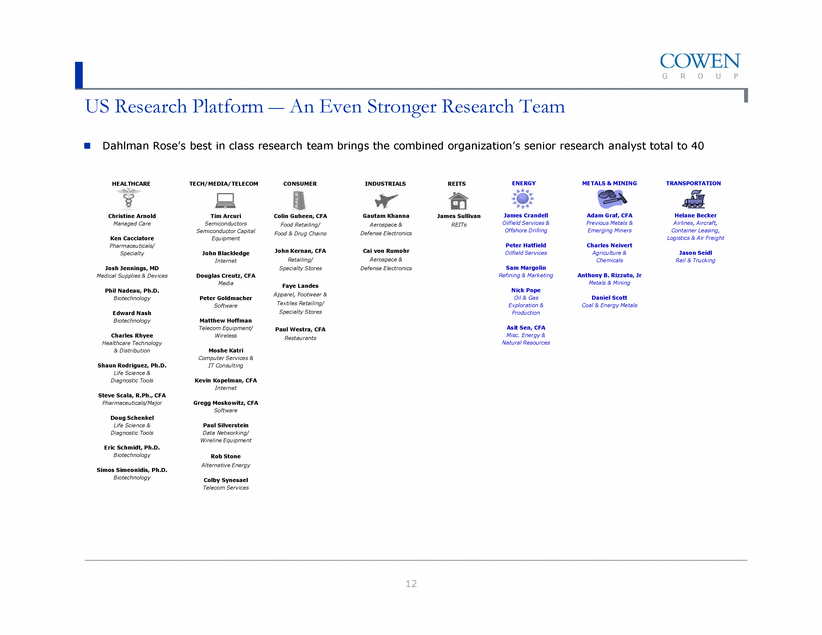
12 US Research Platform 7 An Even Stronger Research Team Dahlman Rose’s best in class research team brings the combined organization’s senior research analyst total to 40 HEALTHCARE Christine Arnold Managed Care Ken Cacciatore Pharmaceuticals/ Specialty Josh Jennings, MD Medical Supplies & Devices Phil Nadeau, Ph.D. Biotechnology Edward Nash Biotechnology Charles Rhyee Healthcare Technology & Distribution Shaun Rodriguez, Ph.D. Life Science & Diagnostic Tools Steve Scala, R.Ph., CFA Pharmaceuticals/Major Doug Schenkel Life Science & Diagnostic Tools Eric Schmidt, Ph.D. Biotechnology Simos Simeonidis, Ph.D. Biotechnology INDUSTRIALS Gautam Khanna Aerospace & Defense Electronics Cai von Rumohr Aerospace & Defense Electronics CONSUMER Colin Guheen, CFA Food Retailing/ Food & Drug Chains John Kernan, CFA Retailing/ Specialty Stores Faye Landes Apparel, Footwear & Textiles Retailing/ Specialty Stores Paul Westra, CFA Restaurants REITS James Sullivan REITs TECH/MEDIA/TELECOM Tim Arcuri Semiconductors Semiconductor Capital Equipment John Blackledge Internet Douglas Creutz, CFA Media Peter Goldmacher Software Matthew Hoffman Telecom Equipment/ Wireless Moshe Katri Computer Services & IT Consulting Kevin Kopelman, CFA Internet Gregg Moskowitz, CFA Software Paul Silverstein Data Networking/ Wireline Equipment Rob Stone Alternative Energy Colby Synesael Telecom Services ENERGY James Crandell Oilfield Services & Offshore Drilling Peter Hatfield Oilfield Services Sam Margolin Refining & Marketing Nick Pope Oil & Gas Exploration & Production Asit Sen, CFA Misc. Energy & Natural Resources METALS & MINING Adam Graf, CFA Previous Metals & Emerging Miners Charles Neivert Agriculture & Chemicals Anthony B. Rizzuto, Jr Metals & Mining Daniel Scott Coal & Energy Metals TRANSPORTATION Helane Becker Airlines, Aircraft, Container Leasing, Logistics & Air Freight Jason Seidl Rail & Trucking |
|
|
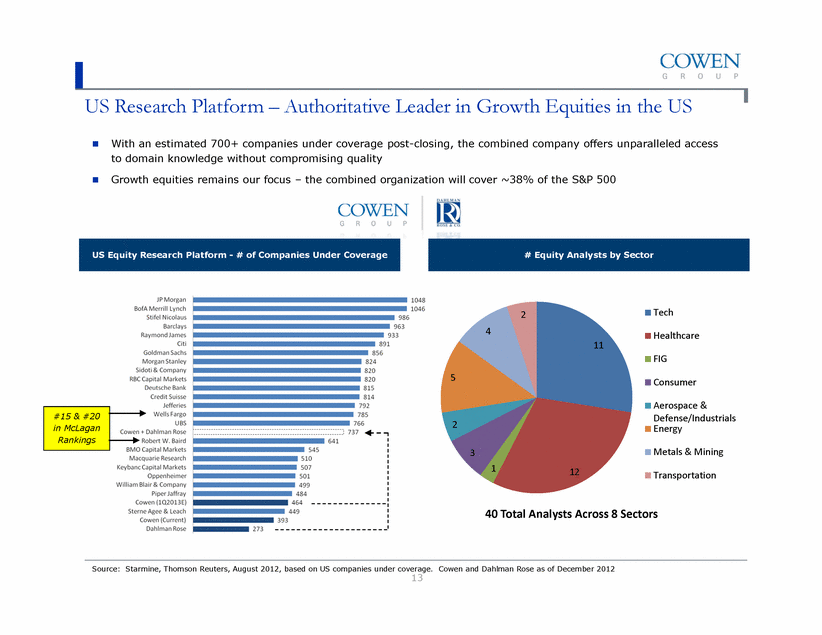
13 US Research Platform – Authoritative Leader in Growth Equities in the US US Equity Research Platform - # of Companies Under Coverage #15 & #20 in McLagan Rankings # Equity Analysts by Sector Source: Starmine, Thomson Reuters, August 2012, based on US companies under coverage. Cowen and Dahlman Rose as of December 2012 With an estimated 700+ companies under coverage post-closing, the combined company offers unparalleled access to domain knowledge without compromising quality Growth equities remains our focus – the combined organization will cover ~38% of the S&P 500 11 12 1 3 2 5 4 2 40 Total Analysts Across 8 Sectors Tech Healthcare FIG Consumer Aerospace & Defense/Industrials Energy Metals & Mining Transportation |
|
|
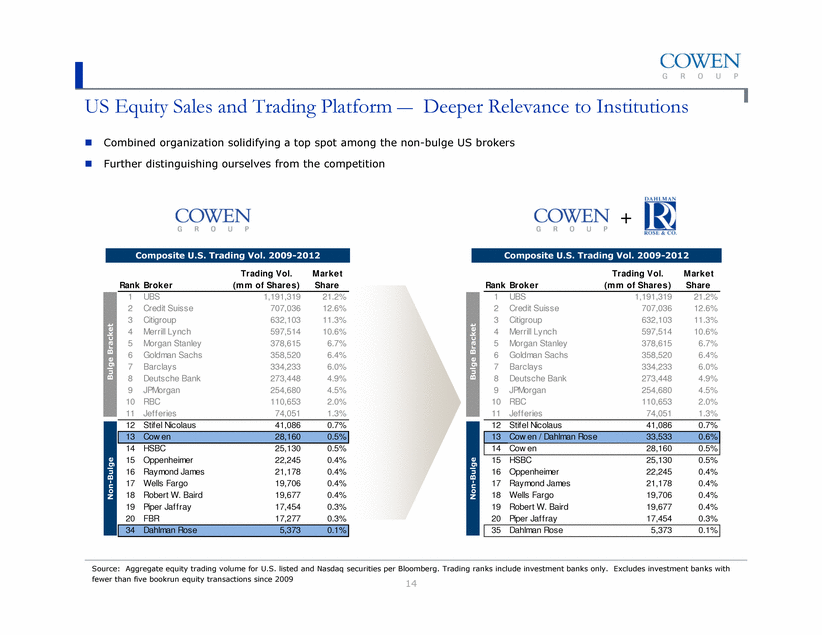
14 US Equity Sales and Trading Platform — Deeper Relevance to Institutions Combined organization solidifying a top spot among the non-bulge US brokers Further distinguishing ourselves from the competition Bulge Bracket Non-Bulge Composite U.S. Trading Vol. 2009-2012 + Composite U.S. Trading Vol. 2009-2012 Trading Vol. Market Rank Broker (mm of Shares) Share 1 UBS 1,191,319 21.2% 2 Credit Suisse 707,036 12.6% 3 Citigroup 632,103 11.3% 4 Merrill Lynch 597,514 10.6% 5 Morgan Stanley 378,615 6.7% 6 Goldman Sachs 358,520 6.4% 7 Barclays 334,233 6.0% 8 Deutsche Bank 273,448 4.9% 9 JPMorgan 254,680 4.5% 10 RBC 110,653 2.0% 11 Jefferies 74,051 1.3% 12 Stifel Nicolaus 41,086 0.7% 13 Cow en 28,160 0.5% 14 HSBC 25,130 0.5% 15 Oppenheimer 22,245 0.4% 16 Raymond James 21,178 0.4% 17 Wells Fargo 19,706 0.4% 18 Robert W. Baird 19,677 0.4% 19 Piper Jaffray 17,454 0.3% 20 FBR 17,277 0.3% 34 Dahlman Rose 5,373 0.1% Bulge Bracket Non-Bulge Trading Vol. Market Rank Broker (mm of Shares) Share 1 UBS 1,191,319 21.2% 2 Credit Suisse 707,036 12.6% 3 Citigroup 632,103 11.3% 4 Merrill Lynch 597,514 10.6% 5 Morgan Stanley 378,615 6.7% 6 Goldman Sachs 358,520 6.4% 7 Barclays 334,233 6.0% 8 Deutsche Bank 273,448 4.9% 9 JPMorgan 254,680 4.5% 10 RBC 110,653 2.0% 11 Jefferies 74,051 1.3% 12 Stifel Nicolaus 41,086 0.7% 13 Cow en / Dahlman Rose 33,533 0.6% 14 Cow en 28,160 0.5% 15 HSBC 25,130 0.5% 16 Oppenheimer 22,245 0.4% 17 Raymond James 21,178 0.4% 18 Wells Fargo 19,706 0.4% 19 Robert W. Baird 19,677 0.4% 20 Piper Jaffray 17,454 0.3% 35 Dahlman Rose 5,373 0.1% Source: Aggregate equity trading volume for U.S. listed and Nasdaq securities per Bloomberg. Trading ranks include investment banks only. Excludes investment banks with fewer than five bookrun equity transactions since 2009 |
|
|
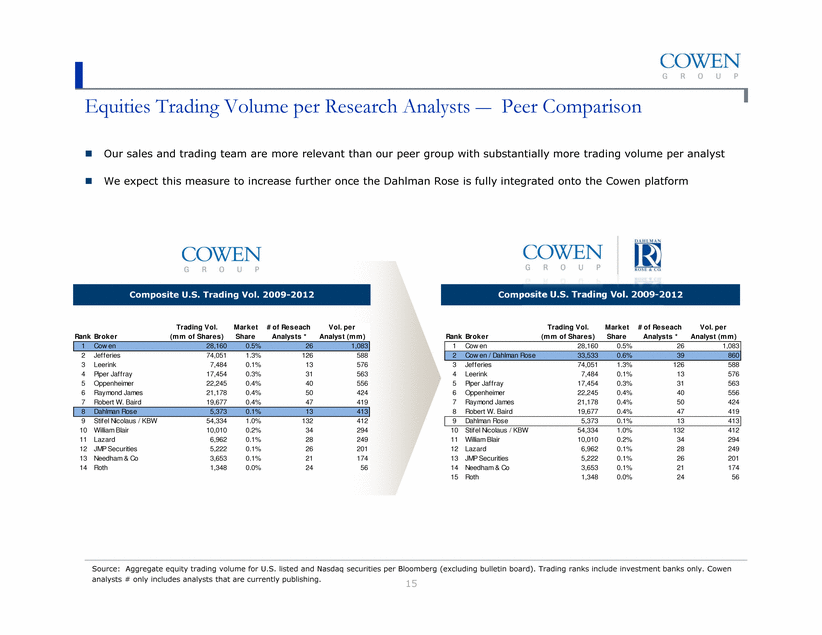
15 Equities Trading Volume per Research Analysts — Peer Comparison Our sales and trading team are more relevant than our peer group with substantially more trading volume per analyst We expect this measure to increase further once the Dahlman Rose is fully integrated onto the Cowen platform Composite U.S. Trading Vol. 2009-2012 Composite U.S. Trading Vol. 2009-2012 Trading Vol. Market # of Reseach Vol. per Rank Broker (mm of Shares) Share Analysts * Analyst (mm) 1 Cow en 28,160 0.5% 26 1,083 2 Jefferies 74,051 1.3% 126 588 3 Leerink 7,484 0.1% 13 576 4 Piper Jaffray 17,454 0.3% 31 563 5 Oppenheimer 22,245 0.4% 40 556 6 Raymond James 21,178 0.4% 50 424 7 Robert W. Baird 19,677 0.4% 47 419 8 Dahlman Rose 5,373 0.1% 13 413 9 Stifel Nicolaus / KBW 54,334 1.0% 132 412 10 William Blair 10,010 0.2% 34 294 11 Lazard 6,962 0.1% 28 249 12 JMP Securities 5,222 0.1% 26 201 13 Needham & Co 3,653 0.1% 21 174 14 Roth 1,348 0.0% 24 56 Trading Vol. Market # of Reseach Vol. per Rank Broker (mm of Shares) Share Analysts * Analyst (mm) 1 Cow en 28,160 0.5% 26 1,083 2 Cow en / Dahlman Rose 33,533 0.6% 39 860 3 Jefferies 74,051 1.3% 126 588 4 Leerink 7,484 0.1% 13 576 5 Piper Jaffray 17,454 0.3% 31 563 6 Oppenheimer 22,245 0.4% 40 556 7 Raymond James 21,178 0.4% 50 424 8 Robert W. Baird 19,677 0.4% 47 419 9 Dahlman Rose 5,373 0.1% 13 413 10 Stifel Nicolaus / KBW 54,334 1.0% 132 412 11 William Blair 10,010 0.2% 34 294 12 Lazard 6,962 0.1% 28 249 13 JMP Securities 5,222 0.1% 26 201 14 Needham & Co 3,653 0.1% 21 174 15 Roth 1,348 0.0% 24 56 Source: Aggregate equity trading volume for U.S. listed and Nasdaq securities per Bloomberg (excluding bulletin board). Trading ranks include investment banks only. Cowen analysts # only includes analysts that are currently publishing. composite U.S. Trading Vol. 2009-2012 |
|
|
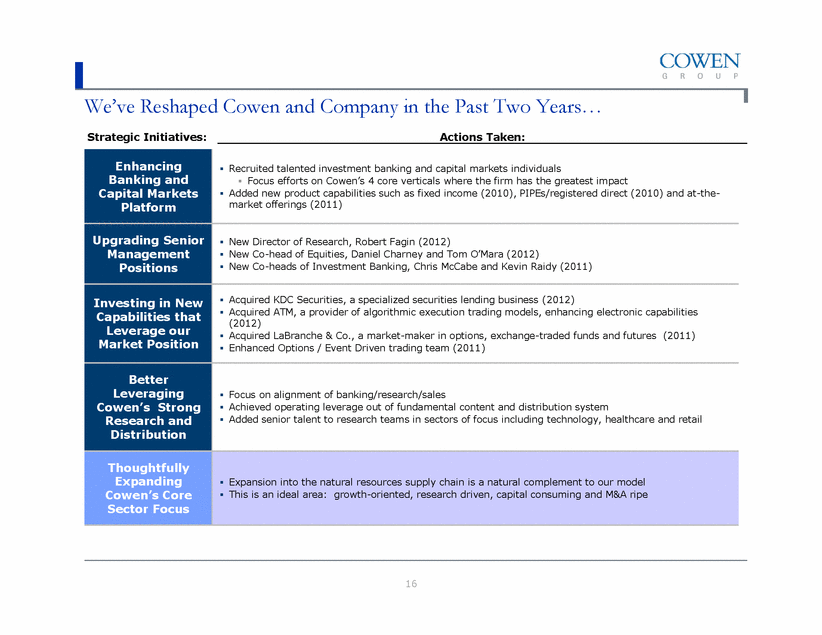
16 We’ve Reshaped Cowen and Company in the Past Two Years... Enhancing Banking and Capital Markets Platform Recruited talented investment banking and capital markets individuals Focus efforts on Cowen’s 4 core verticals where the firm has the greatest impact Added new product capabilities such as fixed income (2010), PIPEs/registered direct (2010) and at-the-market offerings (2011) Upgrading Senior Management Positions New Director of Research, Robert Fagin (2012) New Co-head of Equities, Daniel Charney and Tom O’Mara (2012) New Co-heads of Investment Banking, Chris McCabe and Kevin Raidy (2011) Investing in New Capabilities that Leverage our Market Position Acquired KDC Securities, a specialized securities lending business (2012) Acquired ATM, a provider of algorithmic execution trading models, enhancing electronic capabilities (2012) Acquired LaBranche & Co., a market-maker in options, exchange-traded funds and futures (2011) Enhanced Options / Event Driven trading team (2011) Better Leveraging Cowen’s Strong Research and Distribution Focus on alignment of banking/research/sales Achieved operating leverage out of fundamental content and distribution system Added senior talent to research teams in sectors of focus including technology, healthcare and retail Thoughtfully Expanding Cowen’s Core Sector Focus Expansion into the natural resources supply chain is a natural complement to our model This is an ideal area: growth-oriented, research driven, capital consuming and M&A ripe Strategic Initiatives: Actions Taken: |
|
|
...And This Transaction Has the Ability to Further Strengthen Cowen’s Platform III. COWEN AND COMPANY This transaction is about execution - something that the team at Cowen has experience doing That experience is fundamental to Cowen’s ability to further transform the Cowen platform through the acquisition of Dahlman Rose Success relies on Cowen’s ability to extract operating synergies while focusing on its core competencies within banking, research and equities to drive the topline 17 |
|
|
18 Questions? |

