Attached files
| file | filename |
|---|---|
| 8-K - USA TRUCK INC | form8k-01312013.htm |

USA Truck Announces Fourth Quarter Results
VAN BUREN, ARKANSAS January 31, 2013
USA Truck, Inc. (NASDAQ: USAK) today announced base revenue of $107.1 million for the quarter ended December 31, 2012, an increase of 6.8% from $100.3 million for the same quarter of 2011. We incurred a net loss of $3.1 million, $0.30 per share, for the quarter ended December 31, 2012, compared to a net loss of $4.4 million, $0.42 per share, for the same quarter of 2011.
Base revenue decreased 0.6% to $408.7 million for the twelve months ended December 31, 2012, from $411.0 million for the same period of 2011. We incurred a net loss of $17.5 million, $1.70 per share, for the twelve months ended December 31, 2012, compared to a net loss of $10.8 million, $1.05 per share, for the same period of 2011.
Asset-Based Trucking Operations
Cliff Beckham, President and CEO, offered the following comments: “The improved operating fundamentals we experienced toward the end of the third quarter continued into the fourth quarter, and the improvement is reflected in our financial results as we narrowed our loss per share by 28.6% to $0.30, compared to a $0.42 loss a year ago. Sequentially, we nearly cut in half the third quarter's $0.59 loss in a historically seasonally weaker quarter for us.
“Improvement was most evident in our Trucking segment, where we produced year-over-year revenue growth for the first time since the second quarter of 2011. Base Trucking revenue grew 3.4% despite a 3.1% reduction in the average fleet size. Base revenue per tractor per week improved 6.7% to $2,720 on an improved freight mix and a substantially larger manned tractor count.
“Our yield management activities during the third quarter, which adversely impacted volumes during that quarter as we re-priced underperforming freight, began to produce results during the fourth quarter. We replaced volumes lost during the third quarter with better-performing freight, as evidenced by the combination of a 2.2% improvement in rate per loaded mile and a 6.7% increase in loaded length-of-haul. Pricing typically falls at longer lengths-of-haul, so the fact that we grew both simultaneously indicates improving lane flow (directionality, density, and market selection). We upgraded our customer base during the fourth quarter, including the replacement of four of our top 25 Trucking shippers, while reducing concentration with our largest shippers. We expect some of our new customers to grow into our top 25 customer list in the first half of 2013.
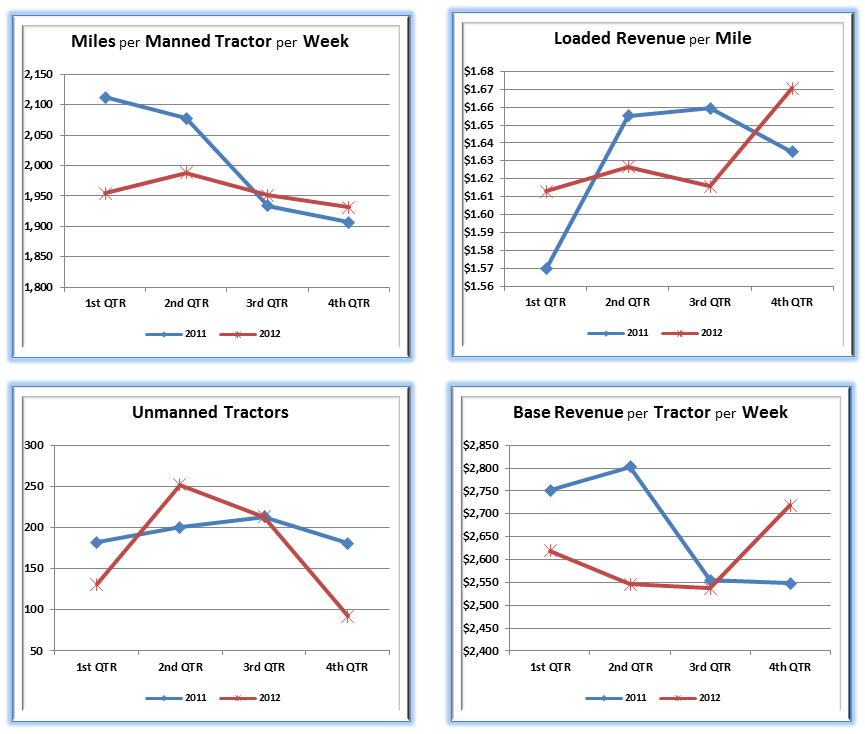
“The improved freight mix and the better operational execution helped us to increase miles per manned tractor per week by 1.3% to 1,931 miles. The heightened empty mile factor (up 92 basis points to 12.0%) suggests that we still need additional freight volume to better utilize our equipment. We are executing a detailed strategy that we believe will grow volumes in specific markets and lanes during this winter's freight bidding season.
“Perhaps our largest accomplishment during the quarter involved cutting our unmanned tractor count by more than 50%, to 92 from 213 sequentially versus the third quarter of 2012. The manned tractor count growth was made possible primarily by lower driver turnover, which improved throughout the quarter to an annualized rate of 83% in December 2012, compared to 107% in December 2011. We attribute the improvement to enhanced Company-wide focus on driver retention, better freight, and more consistent miles. The combination of our manned tractor count and greater miles per manned tractor led to a 5.5% improvement in overall tractor utilization to 1,850 miles per in-service tractor per week.”
The key operating metric charts below (Miles per Manned Tractor per Week, Loaded Revenue per Mile, Unmanned Tractors, and Base Revenue per Tractor per Week) reflect the results we have experienced for the periods indicated.
Non-Asset Based Operations
“Our SCS segment delivered strong performance again, growing base revenue by 17.6% and operating income by 13.4%. Gross margin expanded by 30 basis points on slightly improved market conditions during the quarter. SCS represented 21.2% of our total base revenue during the quarter, and continues to deliver profitable results with minimal capital investment. Intermodal operations experienced better gross margins on less revenue and were immaterial to our financial results.”
Balance Sheet and Liquidity
Mr. Beckham also addressed the Company’s capitalization: “We believe our balance sheet and sources of liquidity are adequate to support our operating needs for the foreseeable future. At December 31, 2012, our outstanding debt, less cash, represented 55.1% of our balance sheet capitalization, compared to 47.4% at December 31, 2011. At December 31, 2012, we were in compliance with our new, five-year $125.0 million revolving credit facility and had approximately $19.9 million of available borrowing capacity (net of the minimum availability we are required to maintain of approximately $18.8 million). For the twelve months ended December 31, 2012, we incurred net capital expenditures of approximately $32.2 million. Our 2013 operating plan anticipates capital expenditures, net of proceeds on sale of assets, of $47.3 million.”
The following table summarizes the results of operations information of USA Truck, Inc. (“Company”) for the three-and twelve- month periods indicated:
|
USA TRUCK, INC.
|
|||||||||||
|
CONSOLIDATED STATEMENTS OF OPERATIONS
|
|||||||||||
|
(in thousands, except per share data)
|
|||||||||||
|
Three Months Ended
|
Twelve Months Ended
|
||||||||||
|
December 31,
|
December 31,
|
||||||||||
|
2012
|
2011
|
2012
|
2011
|
||||||||
|
(UNAUDITED)
|
|||||||||||
|
Revenue:
|
|||||||||||
|
Trucking revenue
|
$
|
77,891
|
$
|
75,309
|
$
|
297,624
|
$
|
321,283
|
|||
|
Strategic Capacity Solutions revenue
|
22,647
|
19,257
|
89,831
|
67,085
|
|||||||
|
Intermodal revenue
|
6,515
|
5,691
|
21,264
|
22,658
|
|||||||
|
Base revenue
|
107,053
|
100,257
|
408,719
|
411,026
|
|||||||
|
Fuel surcharge revenue
|
27,718
|
25,945
|
103,709
|
108,382
|
|||||||
|
Total revenue
|
134,771
|
126,202
|
512,428
|
519,408
|
|||||||
|
Operating expenses and costs:
|
|||||||||||
|
Salaries, wages and employee benefits
|
35,756
|
34,309
|
142,263
|
136,538
|
|||||||
|
Fuel and fuel taxes
|
34,382
|
32,740
|
131,162
|
137,195
|
|||||||
|
Purchased transportation
|
34,323
|
31,002
|
127,949
|
120,076
|
|||||||
|
Depreciation and amortization
|
11,487
|
11,772
|
45,058
|
49,263
|
|||||||
|
Operations and maintenance
|
11,088
|
10,236
|
43,559
|
42,179
|
|||||||
|
Insurance and claims
|
4,983
|
5,356
|
20,556
|
22,501
|
|||||||
|
Operating taxes and licenses
|
1,320
|
1,343
|
5,504
|
5,460
|
|||||||
|
Communications and utilities
|
1,077
|
1,258
|
4,124
|
4,395
|
|||||||
|
Gain on disposal of assets, net
|
(396)
|
(711)
|
(2,151)
|
(3,615)
|
|||||||
|
Other
|
4,447
|
4,716
|
17,590
|
18,065
|
|||||||
|
Total operating expenses and costs
|
138,467
|
132,021
|
535,614
|
532,057
|
|||||||
|
Operating loss
|
(3,696)
|
(5,819)
|
(23,186)
|
(12,649)
|
|||||||
|
Other expenses (income):
|
|||||||||||
|
Interest expense
|
1,009
|
904
|
4,053
|
3,345
|
|||||||
|
Other, net
|
(35)
|
(41)
|
(191)
|
(252)
|
|||||||
|
Total other expenses, net
|
974
|
863
|
3,862
|
3,093
|
|||||||
|
Loss before income taxes
|
(4,670)
|
(6,682)
|
(27,048)
|
(15,742)
|
|||||||
|
Income tax benefit
|
(1,560)
|
(2,328)
|
(9,508)
|
(4,965)
|
|||||||
|
Net loss
|
$
|
(3,110)
|
$
|
(4,354)
|
$
|
(17,540)
|
$
|
(10,777)
|
|||
|
Per share information:
|
|||||||||||
|
Average shares outstanding (Basic)
|
10,313
|
10,297
|
10,310
|
10,302
|
|||||||
|
Basic loss per share
|
$
|
(0.30)
|
$
|
(0.42)
|
$
|
(1.70)
|
$
|
(1.05)
|
|||
|
Average shares outstanding (Diluted)
|
10,313
|
10,297
|
10,310
|
10,302
|
|||||||
|
Diluted loss per share
|
$
|
(0.30)
|
$
|
(0.42)
|
$
|
(1.70)
|
$
|
(1.05)
|
|||
The following table includes key operating results and statistics for our three operating segments:
|
Three Months Ended
|
Twelve Months Ended
|
|||||||||||||
|
December 31,
|
December 31,
|
|||||||||||||
|
2012
|
2011
|
2012
|
2011
|
|||||||||||
|
(UNAUDITED)
|
||||||||||||||
|
Trucking:
|
||||||||||||||
|
Operating loss (in thousands) (1)
|
$
|
(5,371)
|
$
|
(7,113)
|
$
|
(29,762)
|
$
|
(18,762)
|
||||||
|
Operating ratio (2)
|
106.9
|
%
|
109.4
|
%
|
110.0
|
%
|
106.0
|
%
|
||||||
|
Total miles (in thousands) (3)
|
52,968
|
51,810
|
205,776
|
221,765
|
||||||||||
|
Empty mile factor
|
12.0
|
%
|
11.1
|
%
|
11.4
|
%
|
11.0
|
%
|
||||||
|
Weighted average number of tractors (4)
|
2,179
|
2,248
|
2,184
|
2,313
|
||||||||||
|
Average miles per tractor per period
|
24,308
|
23,047
|
94,220
|
95,878
|
||||||||||
|
Average miles per tractor per week
|
1,850
|
1,754
|
1,802
|
1,839
|
||||||||||
|
Average miles per trip
|
556
|
521
|
542
|
532
|
||||||||||
|
Base Trucking revenue per tractor per week
|
$
|
2,720
|
$
|
2,549
|
$
|
2,606
|
$
|
2,664
|
||||||
|
Number of tractors at end of period (4)
|
2,184
|
2,235
|
2,184
|
2,235
|
||||||||||
|
Strategic Capacity Solutions:
|
||||||||||||||
|
Operating income (in thousands) (1)
|
$
|
1,799
|
$
|
1,587
|
$
|
7,788
|
$
|
7,100
|
||||||
|
Gross margin (5)
|
14.4
|
%
|
14.1
|
%
|
13.9
|
%
|
15.1
|
%
|
||||||
|
Intermodal:
|
||||||||||||||
|
Operating loss (in thousands) (1)
|
$
|
(124)
|
$
|
(293)
|
$
|
(1,212)
|
$
|
(987)
|
||||||
|
Gross margin (5)
|
15.1
|
%
|
14.3
|
%
|
17.8
|
%
|
11.5
|
%
|
||||||
(1) Operating (loss) income is calculated by deducting total operating expenses from total revenues.
|
|
(2)
|
Operating ratio is calculated by dividing total operating expenses, net of fuel surcharge, by base revenue.
|
(3) Total miles include both loaded and empty miles.
|
|
(4)
|
Tractors include Company-operated tractors in service plus tractors operated by independent contractors.
|
|
|
(5)
|
Gross margin is calculated by taking total revenue less purchased transportation expense and dividing that amount by total revenue. This calculation includes intercompany revenues and expenses.
|
Financial information in this press release is preliminary and based upon information available to the Company as of the date of this press release. As such, this information remains subject to the completion of normal quarter- and year-end closing and audit procedures which could result in changes, some of which could be material, to the preliminary information provided in this press release.
This press release contains forward-looking statements within the meaning of Section 27A of the Securities Act of 1933, as amended and Section 21E of the Securities Exchange Act of 1934, as amended. These statements generally may be identified by their use of terms or phrases such as “expects,” “estimates,” “anticipates,” “projects,” “believes,” “plans,” “goals,” “intends,” “may,” “will,” “should,” “could,” “potential,” “continue,” “future” and terms or phrases of similar substance. Forward-looking statements are based upon the current beliefs and expectations of our management and are inherently subject to risks and uncertainties, some of which cannot be predicted or quantified, which could cause future events and actual results to differ materially from those set forth in, contemplated by, or underlying the forward-looking statements. Accordingly, actual results may differ from those set forth in the forward-looking statements. Readers should review and consider the factors that may affect future results and other disclosures by the Company in its press releases, Annual Report on Form 10-K and other filings with the Securities and Exchange Commission. We disclaim any obligation to update or revise any forward-looking statements to reflect actual results or changes in the factors affecting the forward-looking information. In light of these risks and uncertainties, the forward-looking events and circumstances discussed in this press release might not occur.
All forward-looking statements attributable to us, or persons acting on our behalf, are expressly qualified in their entirety by this cautionary statement.
References to the “Company,” “we,” “us,” “our” and words of similar import refer to USA Truck, Inc. and its subsidiary.
USA Truck is a dry van truckload carrier transporting general commodities via our General Freight and Dedicated Freight service offerings. We transport commodities throughout the continental United States and into and out of portions of Canada. We also transport general commodities into and out of Mexico by allowing through-trailer service from our terminal in Laredo, Texas. Our Strategic Capacity Solutions and Intermodal operating segments provide customized transportation solutions using our technology and multiple modes of transportation including our assets and the assets of our partner carriers.
This press release and related information will be available to interested parties at our web site, http://www.usa-truck.com under the “News Releases” tab of the “Investors” menu.
-- --
Contact: CLIFF BECKHAM, President and Chief Executive Officer – (479) 471-2633