Attached files
| file | filename |
|---|---|
| 8-K - FORM 8-K - BRINKS CO | form_8k.htm |
| EX-99.1 - EXHIBIT 99.1 - BRINKS CO | exhibit_99-1.htm |

The Brink’s Company
Fourth-Quarter 2012 Earnings
Conference Call
NYSE:BCO
February 1, 2013
Exhibit 99.2

Forward-Looking Statements
These materials contain forward-looking statements. Actual
results could differ materially from projected or estimated
results. Information regarding factors that could cause such
differences is available in today's release and in The Brink’s
Company’s most recent SEC filings.
results could differ materially from projected or estimated
results. Information regarding factors that could cause such
differences is available in today's release and in The Brink’s
Company’s most recent SEC filings.
Information discussed today is representative as of today
only and Brink's assumes no obligation to update any
forward-looking statements. These materials are
copyrighted and may not be used without written permission
from Brink's.
only and Brink's assumes no obligation to update any
forward-looking statements. These materials are
copyrighted and may not be used without written permission
from Brink's.
2

The Brink’s Company
Ed Cunningham
Director - Investor Relations

Today’s Announcements
• 4th Quarter and Full-Year Earnings
• GAAP and non-GAAP
• Europe Divestitures in Discontinued Operations
• $104 Million Revenue
• $16 Million Operating Loss ($.31 per share)
on non-GAAP basis
Note: See reconciliation to GAAP results in Appendix
4

Summary of 2012 Non-GAAP Results
Fourth Quarter
• Non-GAAP EPS $.60 vs $.67
• Revenue up 4% (6% organic increase)
Full Year
• Non-GAAP EPS $2.31 vs $2.32
• Revenue up 2% (7% organic increase)
Impact of Europe Restructure
• Lifts full-year 2012 EPS by $.31; $.09 lift in 4Q
Note: See reconciliation to GAAP results in Appendix
5

The Brink’s Company
Tom Schievelbein
Chairman, President and
Chief Executive Officer

CEO Overview
Fourth Quarter
• North America and Europe profits improve
• Latin America profit down
2013
• Segment Margin Outlook: 6.0% - 6.5% on a non-GAAP basis
• Productivity investments
• Devaluation in Venezuela
7
Note: See reconciliation to GAAP results in Appendix

Strategy Update
• Maximize profits in North America and Europe
• 7% Margin goal achieved in Europe in 2012
• Margin improves in North America to 4.4%
• Grow in Latin America
• 2013 Segment margin rate outlook positive
• Continued productivity investments
• Enter adjacent markets
• Brink’s Money ™ Card, Redetrel Acquisition
• New leadership team in place
8

The Brink’s Company
Joe Dziedzic
Vice President and Chief
Financial Officer
Financial Officer
Review and Outlook
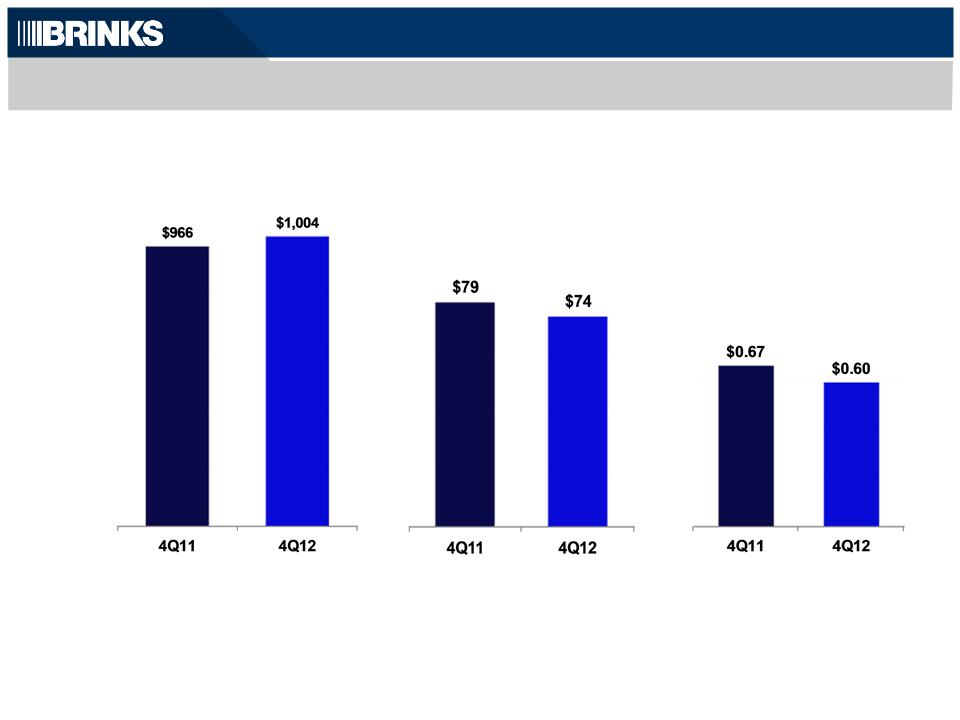
4Q12 Non-GAAP Results
($ millions, except EPS)
Segment
Operating Profit
Operating Profit
Revenue
|
|
|
|
|
|
Margin
|
8.1%
|
|
7.4%
|
EPS
Note: See reconciliation to GAAP results in Appendix
|
Full Year
|
$3,756
|
$3,833
|
|
$267
|
$268
|
|
$2.32
|
$2.31
|
|
|
|
Margin
|
7.1%
|
7.0%
|
|
|
|
10
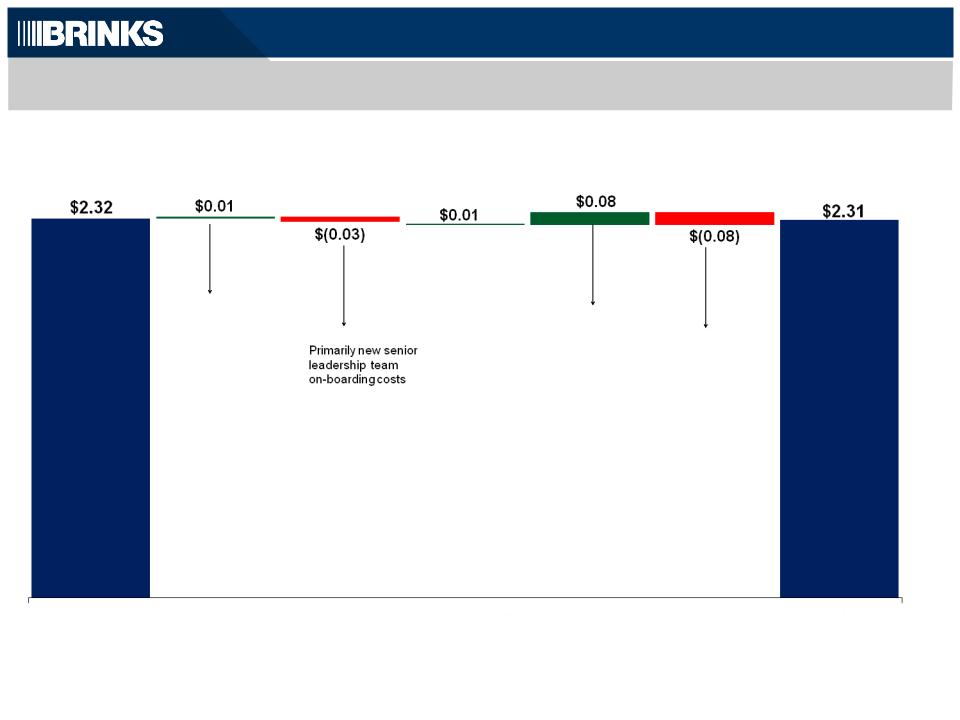
Non-GAAP EPS: 2011 Versus 2012
Segment
Operating
Profit
Operating
Profit
Non-Segment
Expense
Expense
Interest
Expense,
Net
Expense,
Net
Non-
Controlling
Interest
Controlling
Interest
Tax
Rate/Diluted
Shares
Rate/Diluted
Shares
2011
2012
Note: See reconciliation to GAAP results in Appendix
$0.50 Profit increase
excluding items
below
excluding items
below
$(0.20) Foreign
currency
$(0.21) Venezuela
profit decline
$(0.08) Argentina
industry
subsidy
subsidy
termination
Amounts may not add due to rounding
$0.08 Venezuela
$(0.02) Diluted Shares
$(0.06) Tax Rate
11

Full Year 2012 Non-GAAP Segment Results
Revenue
Segment Operating Profit
|
|
|
|
|
|
|
|
Margin
|
|
8.2%
|
7.1%
|
7.0%
|
|
Segment Operating Profit
— 7% Organic growth, 5% unfavorable
currency
currency
— 15% Organic growth in Latin America
— 2% Organic decline in North America
— Unfavorable currency impact of $15
— North America up $6 from cost actions
— International down $6 as Latin America
decline partially offset by Europe
improvement
decline partially offset by Europe
improvement
12
Note: See reconciliation to GAAP results in Appendix

Capital
Expenditures
and Capital
Leases(b)
Expenditures
and Capital
Leases(b)
Non-GAAP Cash Flow, Capital Investment and Net Debt
13
($ millions)
(a) See reconciliation to GAAP results in Appendix
(b) From continuing operations
Non-GAAP
CFOA(a) (b)
CFOA(a) (b)
$203
$235
North
America
America
International
Net Debt (a)
13
$232
$246
$232
$270
2012 Results versus Guidance
— Organic growth 5% to 8%
— Unfavorable currency impact 3%
to 5%
Actual Results
14
Outlook as of February 2, 2012
Revenue
Non-GAAP Segment Margin Rate
— North America 4.5% to 5.5%
— International 7.0% to 8.0%
— Total segment 6.5% to 7.0%
Other Metrics
— Non-segment expense $41
— Interest expense $23 to $26
— Non-controlling interest $24 to $28
— Tax rate 37% to 40%
— 7% Growth driven by Latin America
— 5% Unfavorable from Euro, Brazilian Real & Mexican
Peso
Peso
— 4.4% as price/volume pressure more difficult than planned
— 7.8% Continuing ops, 7.0% including discontinued ops…
negatively impacted by Venezuela & Argentina
Government actions
negatively impacted by Venezuela & Argentina
Government actions
— 7.0% Continuing ops, 6.3% including discontinued ops
— $42 - Slight increase versus estimate
— $24 - Within estimated range
— $19 - Venezuela earnings decline
— 37% - Continuing ops, 40% including discontinued ops
— $203 - Rigorous allocation process, aligned with earnings
Note: See reconciliation to GAAP results in Appendix

2013 Outlook

2013 Outlook
— Organic growth 5% to 8%
— Unfavorable currency impact 1% to 3%
Assumptions
16
February 1, 2013
Revenue
Non-GAAP Segment Margin Rate
— North America 4.0% to 4.5%
— International 7.0% to 7.5%
— Total segment 6.0% to 6.5%
Other Metrics
— Non-segment expense $43
— Interest expense $27 to $29
— Non-controlling interest $17 to $20
— Tax rate 36% to 39%
— Capital expenditures / leases flat at $205
— Growth in Latin America, North America and Europe flat
— Venezuela devaluation 2Q13 impact of $130 million, 3%
of total revenue
of total revenue
— Continued price/volume pressure offset by cost actions
— Decline from productivity spend, Venezuela devaluation
and slight decline in Europe
and slight decline in Europe
— Slight increase
— Increase from recent acquisitions
— Venezuela decrease offset by Colombia growth
— Continued focus on returns
Note: See reconciliation to GAAP results in Appendix

The Brink’s Company
Fourth-Quarter 2012 Earnings
Conference Call
NYSE:BCO
February 1, 2013

Appendix - Legacy Liabilities

Legacy Liabilities
|
|
Estimated Contributions to U.S. Plans
|
|
||||||||||||
|
|
|
2012A
|
2013
|
2014
|
2015
|
2016
|
2017
|
|||||||
|
|
US Pension
|
$ 37
|
|
14
|
|
29
|
|
42
|
|
44
|
|
38
|
|
|
|
|
UMWA
|
0
|
|
0
|
|
0
|
|
0
|
|
0
|
|
0
|
|
|
|
|
Black Lung/Other
|
7
|
|
5
|
|
5
|
|
5
|
|
4
|
|
4
|
|
|
|
|
Total
|
$ 44
|
|
19
|
|
34
|
|
47
|
|
48
|
|
42
|
|
|
($ millions)
$275
Under-
funding
Under-
funding
Note: Above amounts based on actuarial assumptions at December 31, 2012.
19

(a) Under GAAP, the funded status of a benefit plan is reduced by the fair market value of plan assets at the balance sheet date, and the present value
of the projected earnings on plan assets does not reduce the funded status at the balance sheet date. The non-GAAP measure presented above
additionally reduces the funded status as computed under GAAP by the present value of projected earnings of plan assets using the expected return
on asset assumptions of the respective plan.
(b) For the primary U.S. pension plan, we are required by ERISA regulations to maintain minimum funding levels, and as a result, we estimate we will
be required to make minimum required contributions from 2012 to 2021. We have estimated that we will achieve the required funded ratio after the
2021 contribution.
be required to make minimum required contributions from 2012 to 2021. We have estimated that we will achieve the required funded ratio after the
2021 contribution.
(c) There are no minimum funding requirements for the UMWA plans because they are not covered by ERISA funding regulations. Using assumptions
at the end of 2012, we project that the plan assets plus expected earnings on those investments will cover the benefit payments for these plans until
2022. We project that Brink’s will be required to contribute cash to the plan beginning in 2022 to pay beneficiaries.
at the end of 2012, we project that the plan assets plus expected earnings on those investments will cover the benefit payments for these plans until
2022. We project that Brink’s will be required to contribute cash to the plan beginning in 2022 to pay beneficiaries.
Discounted cash flows at plan discount rates are supplemental financial measures that are not required by, or presented in accordance with GAAP. The
purpose of the discounted cash flows at plan discount rate is to present our retirement obligations after giving effect to the benefit of earning a return on
purpose of the discounted cash flows at plan discount rate is to present our retirement obligations after giving effect to the benefit of earning a return on
plan assets. We believe this measure is helpful in assessing the present value of future funding requirements of the company in order to meet plan
benefit obligations. Discounted cash flows at plan discount rates should not be considered as an alternative to the funded status of the U.S. retirement
plans at December 31, 2012, as determined in accordance with GAAP and should be read in conjunction with our consolidated balance sheets.
Non-GAAP Reconciliations - U.S. Retirement Plans Obligation
|
DISCOUNTED CASH FLOWS AT PLAN DISCOUNT RATES - RECONCILED TO AMOUNTS REPORTED UNDER U.S. GAAP
|
|||||||||||
|
|
|
|
December 31, 2012
|
||||||||
|
|
|
|
|
|
Primary U.S.
pension plan (b) |
|
UMWA plans
(c) |
|
Other unfunded
U.S. plans |
|
Total
|
|
|
|
|
|
|
|
|
|
|
|
|
|
|
|
Funded status of U.S. retirement plans - GAAP
|
|
$
|
263
|
|
257
|
|
65
|
|
585
|
|
|
|
Present value of projected earnings of plan assets (a)
|
|
|
(65)
|
|
(15)
|
|
-
|
|
(80)
|
|
|
|
|
|
|
|
|
|
|
|
|
|
|
|
|
|
Discounted cash flows at plan discount rates - Non-GAAP
|
|
$
|
198
|
|
242
|
|
65
|
|
505
|
|
|
|
|
|
|
|
|
|
|
|
|
|
|
|
|
Plan discount rate
|
|
|
4.20%
|
|
3.90%
|
|
|
|
|
|
|
|
Expected return of assets
|
|
|
8.00%
|
|
8.25%
|
|
|
|
|
20

Appendix
Non-GAAP Reconciliations
Non-GAAP Reconciliations

GAAP
Basis
Basis
Additional
European
Operations
to be
Exited (a)
European
Operations
to be
Exited (a)
Gains on
Acquisitions
and Asset
Dispositions (b)
Acquisitions
and Asset
Dispositions (b)
Employee Benefit
Settlement &
Severance Losses (c)
Settlement &
Severance Losses (c)
U.S.
Retirement
Plans (d)
Retirement
Plans (d)
Tax Benefit on Change
in Health Care Funding
Strategy(e)
in Health Care Funding
Strategy(e)
Adjust
Income Tax
Rate (f)
Income Tax
Rate (f)
Non-
GAAP
Basis
GAAP
Basis
First Quarter 2012
Revenue:
Latin America
$
386.3
−
−
−
−
−
−
386.3
EMEA
280.4
(2.4)
−
−
−
−
−
278.0
Asia Pacific
37.6
−
−
−
−
−
−
37.6
International
704.3
(2.4)
−
−
−
−
−
701.9
North America
236.4
−
−
−
−
−
−
236.4
Revenues
$
940.7
(2.4)
−
−
−
−
−
938.3
Operating profit:
International
$
65.2
0.6
−
0.8
−
−
−
66.6
North America
5.8
−
−
−
2.2
−
−
8.0
Segment operating profit
71.0
0.6
−
0.8
2.2
−
−
74.6
Non-segment
(24.3)
−
−
−
14.7
−
−
(9.6)
Operating profit
$
46.7
0.6
−
0.8
16.9
−
−
65.0
Amounts attributable to Brink’s:
Income from continuing operations
$
20.9
0.7
(1.2)
0.6
10.2
−
0.8
32.0
Diluted EPS - continuing operations
0.43
0.01
(0.02)
0.01
0.21
−
0.02
0.66
Non-GAAP Reconciliations - 1Q12
Amounts may not add due to rounding. See page 27 for notes.
22

GAAP
Basis
Basis
Additional
European
Operations
to be
Exited (a)
European
Operations
to be
Exited (a)
Gains on
Acquisitions
and Asset
Dispositions (b)
Acquisitions
and Asset
Dispositions (b)
Employee Benefit
Settlement &
Severance Losses (c)
Settlement &
Severance Losses (c)
U.S.
Retirement
Plans (d)
Retirement
Plans (d)
Tax Benefit on Change
in Health Care Funding
Strategy(e)
in Health Care Funding
Strategy(e)
Adjust
Income Tax
Rate (f)
Income Tax
Rate (f)
Non-
GAAP
Basis
GAAP
Basis
Second Quarter 2012
Revenue:
Latin America
$
375.9
−
−
−
−
−
−
375.9
EMEA
289.4
(2.2)
−
−
−
−
−
287.2
Asia Pacific
38.5
−
−
−
−
−
−
38.5
International
703.8
(2.2)
−
−
−
−
−
701.6
North America
237.6
−
−
−
−
−
−
237.6
Revenues
$
941.4
(2.2)
−
−
−
−
−
939.2
Operating profit:
International
$
40.5
0.7
−
0.3
−
−
−
41.5
North America
11.4
−
−
−
2.2
−
−
13.6
Segment operating profit
51.9
0.7
−
0.3
2.2
−
−
55.1
Non-segment
(21.3)
−
(0.9)
−
10.5
−
−
(11.7)
Operating profit
$
30.6
0.7
(0.9)
0.3
12.7
−
−
43.4
Amounts attributable to Brink’s:
Income from continuing operations
$
33.8
0.7
(0.9)
0.2
7.6
(20.9)
2.4
22.9
Diluted EPS - continuing operations
0.69
0.01
(0.02)
−
0.16
(0.43)
0.05
0.47
Non-GAAP Reconciliations - 2Q12
Amounts may not add due to rounding. See page 27 for notes.
23

GAAP
Basis
Basis
Additional
European
Operations
to be
Exited (a)
European
Operations
to be
Exited (a)
Gains on
Acquisitions
and Asset
Dispositions (b)
Acquisitions
and Asset
Dispositions (b)
Employee Benefit
Settlement &
Severance Losses (c)
Settlement &
Severance Losses (c)
U.S.
Retirement
Plans (d)
Retirement
Plans (d)
Tax Benefit on Change
in Health Care Funding
Strategy(e)
in Health Care Funding
Strategy(e)
Adjust
Income Tax
Rate (f)
Income Tax
Rate (f)
Non-
GAAP
Basis
GAAP
Basis
Third Quarter 2012
Revenue:
Latin America
$
385.2
−
−
−
−
−
−
385.2
EMEA
294.6
(2.3)
−
−
−
−
−
292.3
Asia Pacific
39.1
−
−
−
−
−
−
39.1
International
718.9
(2.3)
−
−
−
−
−
716.6
North America
234.6
−
−
−
−
−
−
234.6
Revenues
$
953.5
(2.3)
−
−
−
−
−
951.2
Operating profit:
International
$
56.9
2.1
(7.2)
2.0
−
−
−
53.8
North America
8.3
−
−
−
2.2
−
−
10.5
Segment operating profit
65.2
2.1
(7.2)
2.0
2.2
−
−
64.3
Non-segment
(22.0)
−
0.1
−
11.5
−
−
(10.4)
Operating profit
$
43.2
2.1
(7.1)
2.0
13.7
−
−
53.9
Amounts attributable to Brink’s:
Income from continuing operations
$
19.5
2.2
(3.0)
1.4
8.2
−
(0.3)
28.0
Diluted EPS - continuing operations
0.40
0.04
(0.06)
0.03
0.17
−
(0.01)
0.58
Non-GAAP Reconciliations - 3Q12
Amounts may not add due to rounding. See page 27 for notes.
24

Non-GAAP Reconciliations - 4Q12
GAAP
Basis
Basis
Additional
European
Operations
to be
Exited (a)
European
Operations
to be
Exited (a)
Gains on
Acquisitions
and Asset
Dispositions (b)
Acquisitions
and Asset
Dispositions (b)
Employee Benefit
Settlement &
Severance Losses (c)
Settlement &
Severance Losses (c)
U.S.
Retirement
Plans (d)
Retirement
Plans (d)
Tax Benefit on Change
in Health Care Funding
Strategy(e)
in Health Care Funding
Strategy(e)
Adjust
Income Tax
Rate (f)
Income Tax
Rate (f)
Non-
GAAP
Basis
GAAP
Basis
Fourth Quarter 2012
Revenue:
Latin America
$
432.0
−
−
−
−
−
−
432.0
EMEA
294.0
(2.3)
−
−
−
−
−
291.7
Asia Pacific
43.7
−
−
−
−
−
−
43.7
International
769.7
(2.3)
−
−
−
−
−
767.4
North America
236.8
−
−
−
−
−
−
236.8
Revenues
$
1,006.5
(2.3)
−
−
−
−
−
1,004.2
Operating profit:
International
$
65.0
0.2
(1.3)
0.8
−
−
−
64.7
North America
7.0
−
−
−
2.2
−
−
9.2
Segment operating profit
72.0
0.2
(1.3)
0.8
2.2
−
−
73.9
Non-segment
(21.3)
−
−
−
10.7
−
−
(10.6)
Operating profit
$
50.7
0.2
(1.3)
0.8
12.9
−
−
63.3
Amounts attributable to Brink’s:
Income from continuing operations
$
32.6
0.3
(8.9)
0.6
7.8
(0.2)
(2.9)
29.3
Diluted EPS - continuing operations
0.67
0.01
(0.18)
0.01
0.16
−
(0.06)
0.60
Amounts may not add due to rounding. See page 27 for notes.
25

Non-GAAP Reconciliations FY 2012
GAAP
Basis
Basis
Additional
European
Operations
to be
Exited (a)
European
Operations
to be
Exited (a)
Gains on
Acquisitions
and Asset
Dispositions (b)
Acquisitions
and Asset
Dispositions (b)
Employee Benefit
Settlement &
Severance Losses (c)
Settlement &
Severance Losses (c)
U.S.
Retirement
Plans (d)
Retirement
Plans (d)
Tax Benefit on Change
in Health Care Funding
Strategy(e)
in Health Care Funding
Strategy(e)
Adjust
Income Tax
Rate (f)
Income Tax
Rate (f)
Non-
GAAP
Basis
GAAP
Basis
Full Year 2012
Revenue:
Latin America
$
1,579.4
−
−
−
−
−
−
1,579.4
EMEA
1,158.4
(9.2)
−
−
−
−
−
1,149.2
Asia Pacific
158.9
−
−
−
−
−
−
158.9
International
2,896.7
(9.2)
−
−
−
−
−
2,887.5
North America
945.4
−
−
−
−
−
−
945.4
Revenues
$
3,842.1
(9.2)
−
−
−
−
−
3,832.9
Operating profit:
International
$
227.6
3.6
(8.5)
3.9
−
−
−
226.6
North America
32.5
−
−
−
8.8
−
−
41.3
Segment operating profit
260.1
3.6
(8.5)
3.9
8.8
−
−
267.9
Non-segment
(88.9)
−
(0.8)
−
47.4
−
−
(42.3)
Operating profit
$
171.2
3.6
(9.3)
3.9
56.2
−
−
225.6
Amounts attributable to Brink’s:
Income from continuing operations
$
106.8
3.9
(14.0)
2.8
33.8
(21.1)
−
112.2
Diluted EPS - continuing operations
2.20
0.08
(0.29)
0.06
0.70
(0.43)
−
2.31
Amounts may not add due to rounding. See page 27 for notes.
26

Non-GAAP Reconciliations - 2012 Footnotes
27
(a) To eliminate results of additional European operations we intend to exit in 2013. Operations do not currently meet
requirements to be classified as discontinued operations.
requirements to be classified as discontinued operations.
(b) To eliminate:
• Gains related to the sale of investments in mutual fund securities ($1.9 million in the first quarter and $0.5 million in
the third quarter). Proceeds from the sales were used to fund the settlement of pension obligations related to our
former chief executive officer and chief administrative officer.
the third quarter). Proceeds from the sales were used to fund the settlement of pension obligations related to our
former chief executive officer and chief administrative officer.
• Gains and losses related to business acquisitions and dispositions. A $0.9 million gain was recognized in the second
quarter and a $0.1 million loss was recognized in the third quarter. In the fourth-quarter of 2012, tax expense
included a benefit of $7.5 million related to a reduction in an income tax accrual established as part of the 2010
acquisition of subsidiaries in Mexico, and pretax income included a $2.1 million favorable adjustment to the local
profit sharing accrual as a result of the change in tax expectation.
• Third quarter gain on the sale of real estate in Venezuela ($7.2 million).
• Selling costs related to certain operations expected to be sold in the near term and cost related to an acquisition
completed in first quarter 2013. A $0.8 million loss was recognized in the fourth quarter.
completed in first quarter 2013. A $0.8 million loss was recognized in the fourth quarter.
(c) To eliminate employee benefit settlement and acquisition-related severance losses (Mexico and Argentina). Employee
termination benefits in Mexico are accounted for under FASB ASC Topic 715, Compensation - Retirement Benefits.
termination benefits in Mexico are accounted for under FASB ASC Topic 715, Compensation - Retirement Benefits.
(d) To eliminate expenses related to U.S. retirement plans.
(e) To eliminate tax benefit related to change in retiree health care funding strategy.
(f) To adjust effective income tax rate in the interim period to be equal to the full-year non-GAAP effective income tax rate.
The full-year non-GAAP effective tax rate for 2012 is 36.6%.
The full-year non-GAAP effective tax rate for 2012 is 36.6%.

Non-GAAP Reconciliations - 4Q11 and FY 2011
28
Amounts may not add due to rounding. See page 29 for notes.
GAAP
Basis
Basis
Additional European
Operations to be
Exited(a)
Operations to be
Exited(a)
Gains on
Acquisitions and
Asset
Dispositions(b)
Acquisitions and
Asset
Dispositions(b)
Mexico Employee
Benefit Settlement
Losses (c)
Benefit Settlement
Losses (c)
CEO Retirement
Costs (d)
Costs (d)
U.S.
Retirement
Plans (e)
Retirement
Plans (e)
Adjust
Income Tax
Rate (f)
Income Tax
Rate (f)
Non-GAAP
Basis
Basis
Fourth Quarter 2011
Revenue:
Latin America
$
392.8
−
−
−
−
−
−
392.8
EMEA
291.6
(2.7)
−
−
−
−
−
288.9
Asia Pacific
40.0
−
−
−
−
−
−
40.0
International
724.4
(2.7)
−
−
−
−
−
721.7
North America
243.9
−
−
−
−
−
−
243.9
Revenues
$
968.3
(2.7)
−
−
−
−
−
965.6
Operating Profit:
International
$
71.3
0.4
−
0.4
−
−
−
72.1
North America
5.5
−
−
−
−
0.9
−
6.4
Segment operating profit
76.8
0.4
−
0.4
−
0.9
−
78.5
Non-segment
(21.0)
−
−
−
4.1
6.2
−
(10.7)
Operating profit
$
55.8
0.4
−
0.4
4.1
7.1
−
67.8
Amounts attributable to Brink’s:
Income from continuing operations
$
23.3
0.5
−
0.3
2.6
4.5
0.9
32.1
Diluted EPS - continuing operations
0.48
0.01
−
0.01
0.05
0.09
0.02
0.67
Full Year 2011
Revenue:
Latin America
$
1,460.7
−
−
−
−
−
−
1,460.7
EMEA
1,177.7
(10.8)
−
−
−
−
−
1,166.9
Asia Pacific
153.7
−
−
−
−
−
−
153.7
International
2,792.1
(10.8)
−
−
−
−
−
2,781.3
North America
974.2
−
−
−
−
−
−
974.2
Revenues
$
3,766.3
(10.8)
−
−
−
−
−
3,755.5
Operating Profit:
International
$
227.9
2.6
−
2.1
−
−
−
232.6
North America
31.4
−
−
−
−
3.2
−
34.6
Segment operating profit
259.3
2.6
−
2.1
−
3.2
−
267.2
Non-segment
(59.8)
−
(9.7)
−
4.1
24.8
−
(40.6)
Operating profit
$
199.5
2.6
(9.7)
2.1
4.1
28.0
−
226.6
Amounts attributable to Brink’s:
Income from continuing operations
$
96.5
2.9
(9.6)
1.5
2.6
17.7
−
111.6
Diluted EPS - continuing operations
2.01
0.06
(0.20)
0.03
0.05
0.37
−
2.32

Non-GAAP Reconciliations - 2011 Footnotes
(c) To eliminate employee benefit settlement loss related to Mexico. Portions of Brink’s Mexican subsidiaries’ accrued employee
termination benefit were paid in the second and third quarters of 2011. The employee termination benefit is accounted for under
FASB ASC Topic 715, Compensation - Retirement Benefits. Accordingly, the severance payments resulted in settlement losses.
termination benefit were paid in the second and third quarters of 2011. The employee termination benefit is accounted for under
FASB ASC Topic 715, Compensation - Retirement Benefits. Accordingly, the severance payments resulted in settlement losses.
(d) To eliminate the costs related to the retirement of the former chief executive officer.
(e) To eliminate expenses related to U.S. retirement liabilities.
(f) To adjust effective income tax rate to be equal to the full-year non-GAAP effective income tax rate. The non-GAAP effective tax rate
for 2011 is 35.1%.
for 2011 is 35.1%.
(a) To eliminate results of additional European operations we intend to exit in 2013. Operations do not currently meet requirements to be
classified as discontinued operations.
classified as discontinued operations.
(b) To eliminate gains as follows:
|
|
|
|
Full Year 2011
|
|
||
|
|
|
|
Operating
|
|
EPS
|
|
|
|
Sale of U.S. Document Destruction business
|
$
|
(6.7)
|
|
(0.09)
|
|
|
|
Gains on available-for-sale equity and debt securities
|
|
−
|
|
(0.05)
|
|
|
|
Acquisition of controlling interests
|
|
(2.5)
|
|
(0.05)
|
|
|
|
Sale of former operating assets
|
|
(0.5)
|
|
(0.01)
|
|
|
|
|
$
|
(9.7)
|
|
(0.20)
|
|
29
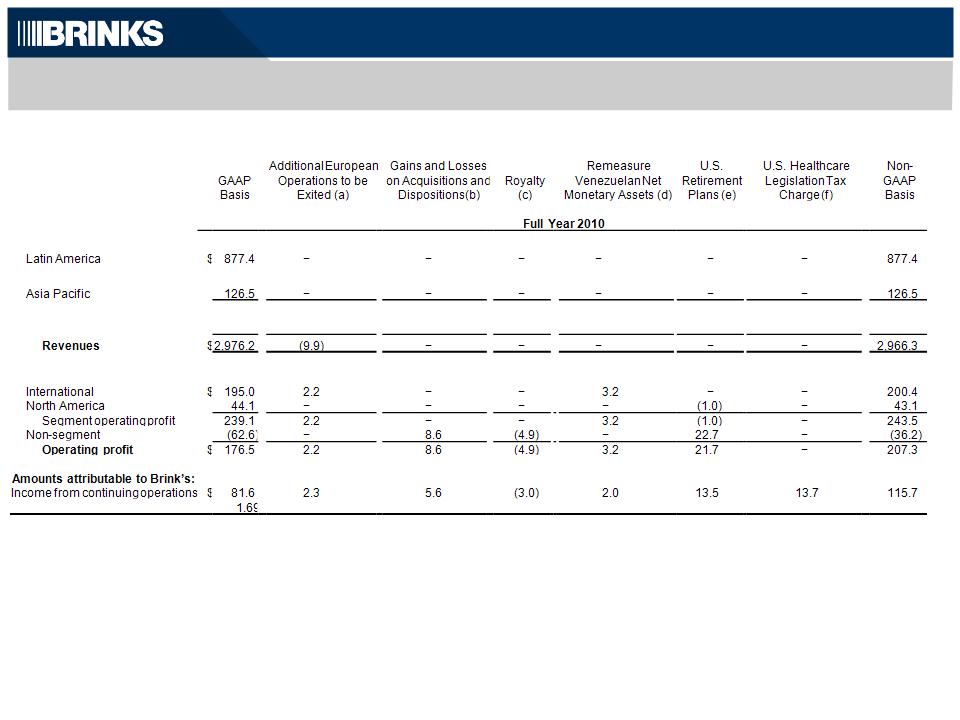
Non-GAAP Reconciliations - Full Year 2010
30
Amounts may not add due to rounding. See page 31 for notes.
Revenue:
EMEA
1,054.5
(9.9)
−
−
−
−
−
1,044.6
International
2,058.4
(9.9)
−
−
−
−
−
2,048.5
North America
917.8
−
−
−
−
−
−
917.8
Operating profit:
Diluted EPS - continuing operations
0.05
0.12
(0.06)
0.04
0.28
0.29
2.39

Non-GAAP Reconciliations - 2010 Footnotes
31
(a) To eliminate results of additional European operations we intend to exit in 2013. Operations do not currently meet
requirements to be classified as discontinued operations.
requirements to be classified as discontinued operations.
(b) To eliminate:
• Loss recognized related to acquisition of controlling interest in subsidiary previously accounted for as cost method
investment and bargain purchase gain in Mexico.
investment and bargain purchase gain in Mexico.
• Exchange of marketable equity securities.
(c) To eliminate royalty income from former home security business.
(d) To reverse remeasurement gains and losses in Venezuela. For accounting purposes, Venezuela is considered a highly
inflationary economy. Under U.S. GAAP, subsidiaries that operate in Venezuela record gains and losses in earnings for the
remeasurement of bolivar fuerte-denominated net monetary assets.
inflationary economy. Under U.S. GAAP, subsidiaries that operate in Venezuela record gains and losses in earnings for the
remeasurement of bolivar fuerte-denominated net monetary assets.
(e) To eliminate expenses related to U.S. retirement liabilities.
(f) To eliminate $13.7 million of tax expense related to the reversal of a deferred tax asset as a result of U.S. healthcare
legislation.
legislation.

Non-GAAP Reconciliations - Cash Flows
32
(a) To the change in the balance of customer obligations related to cash received and processed in certain of our secure cash logistics
operations. The title to this cash transfers to us for a short period of time. The cash is generally credited to customers’ accounts the following
day and we do not consider it as available for general corporate purposes in the management of our liquidity and capital resources.
operations. The title to this cash transfers to us for a short period of time. The cash is generally credited to customers’ accounts the following
day and we do not consider it as available for general corporate purposes in the management of our liquidity and capital resources.
(b) To eliminate cash flows related to our discontinued operations.
Non-GAAP cash flows from operating activities are supplemental financial measures that are not required by, or presented in accordance with
GAAP. The purpose of the non-GAAP cash flows from operating activities is to report financial information excluding the impact of cash received
GAAP. The purpose of the non-GAAP cash flows from operating activities is to report financial information excluding the impact of cash received
and processed in certain of our secure cash logistics operations and without cash flows from discontinued operations. Brink’s believes these
measures are helpful in assessing cash flows from operations, enable period-to-period comparability and are useful in predicting future operating
cash flows. Non-GAAP cash flows from operating activities should not be considered as an alternative to cash flows from operating activities
determined in accordance with GAAP and should be read in conjunction with our consolidated statements of cash flows.
|
NON-GAAP CASH FLOWS FROM OPERATING ACTIVITIES - RECONCILED TO AMOUNTS REPORTED UNDER U.S. GAAP
|
||||||
|
|
|
|
2012
|
|
|
2011
|
|
Cash flows from operating activities - GAAP
|
$
|
250.5
|
|
$
|
247.0
|
|
|
Decrease (increase) in certain customer obligations (a)
|
|
(15.7)
|
|
|
11.7
|
|
|
Discontinued operations (b)
|
|
11.3
|
|
|
11.4
|
|
|
|
|
|
|
|
|
|
|
|
Cash flows from operating activities - Non-GAAP
|
$
|
246.1
|
|
$
|
270.1
|

|
NET DEBT RECONCILED TO GAAP
|
|
|
December 31,
|
|||||
|
|
|
|
2012
|
|
2011
|
|||
|
Debt:
|
|
|
|
|
||||
|
|
Short-term debt
|
|
$
|
26.7
|
|
25.4
|
||
|
|
Long-term debt
|
|
|
362.6
|
|
364.0
|
||
|
|
|
|
|
|
||||
|
Less:
|
|
|
|
|
|
|
||
|
Cash and cash equivalents
|
|
|
201.7
|
|
182.9
|
|||
|
|
|
|
||||||
|
|
|
|
Cash and cash equivalents available for general corporate purposes
|
|
|
157.7
|
|
157.8
|
|
|
|
|
|
|
|
|
|
|
|
|
|
Net Debt
|
|
$
|
231.6
|
|
231.6
|
|
(a) Title to cash received and processed in certain of our secure cash logistics operations transfers to us for a short period of time. The cash is
generally credited to customers’ accounts the following day and we do not consider it as available for general corporate purposes in the
management of our liquidity and capital resources and in our computation of Net Debt.
Net Debt is a supplemental financial measure that is not required by, or presented in accordance with GAAP. We use Net Debt as a measure of
our financial leverage. We believe that investors also may find Net Debt to be helpful in evaluating our financial leverage. Net Debt should not be
our financial leverage. We believe that investors also may find Net Debt to be helpful in evaluating our financial leverage. Net Debt should not be
considered as an alternative to Debt determined in accordance with GAAP and should be reviewed in conjunction with our consolidated balance
sheets. Set forth above is a reconciliation of Net Debt, a non-GAAP financial measure, to Debt, which is the most directly comparable financial
measure calculated and reported in accordance with GAAP. Net Debt excluding cash and debt in Venezuelan operations was $280 million at
December 31, 2012, and $242 million at December 31, 2011.
Non-GAAP Reconciliations - Net Debt
33