Attached files
| file | filename |
|---|---|
| EX-99.2 - TRANSCRIPT OF EARNINGS CONFERENCE CALL - AUTOLIV INC | d476777dex992.htm |
| EX-99.1 - PRESS RELEASE - AUTOLIV INC | d476777dex991.htm |
| 8-K - FORM 8-K - AUTOLIV INC | d476777d8k.htm |
 ©
Autoliv Inc., All Rights Reserved
Teleconference
4
th
Quarter Financial Earnings
January 31, 2013
Driven for Life
Exhibit 99.3 |
 ALV
Q4’12
Financial
Earnings
Report
-
2
This report contains statements that are not historical facts but rather
forward-looking statements within the meaning of the Private Securities
Litigation Reform Act of 1995 (PSLRA). All such statements are based upon
our current expectations and various assumptions, and apply only as of the
date of this report. Our expectations and beliefs are expressed in good
faith and we believe there is a reasonable basis for them. However, there
can be no assurance that forward-looking statements will materialize or prove to be
correct. Because such statements involve risks and uncertainties, the outcome could
differ materially from those set out in the statements. For a summary
of such risk factors, please refer to our latest 10-K and 10-Q filed
with the SEC. Except for our ongoing obligation to disclose
information under law, we undertake no obligation to update publicity any
forward-looking statements whether as a result of new information or future
events. For any forward-looking statements contained in this or any other
document, we claim the protection of the safe harbor for forward-looking
statements contained in the PSLRA.
Safe Harbor Statement *
(*) Non-US GAAP reconciliations are disclosed in our 8-K/10-K/10-Q
filings available at www.sec.gov or www.autoliv.com |
 Highlights
-
Solid performance in a challenging environment
(*) Excludes legal costs & other charges related to the on-going
anti-trust investigations and alignment costs Sales guidance met
•
organic sales growth 1.5%
Margin* guidance slightly exceeded
•
EBIT margin 9.4%
EPS* $1.58
•
partly driven by lower tax rate and financial net
Cash flow as expected
•
~ $0.25B operating cash flow
ALV Q4’12 Financial Earnings Report
-
3 |
 ALV
Q4’12
Financial
Earnings
Report
-
4
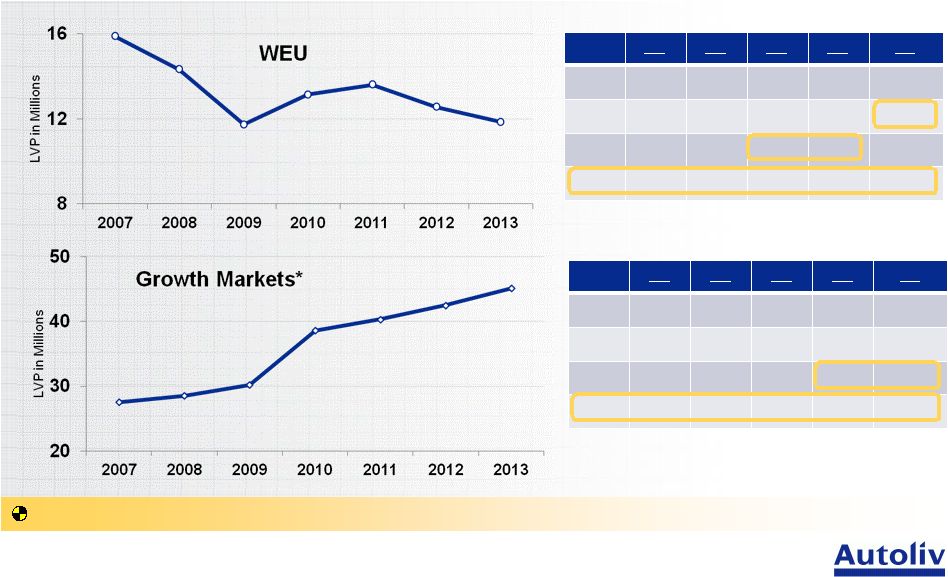
Mixed Market Conditions
-
The tale of two cities
(*) Growth Markets excludes WEU, North America & Japan, CPV (Content per
Vehicle),
(LVP) Light Vehicle Production according
to IHS @ January 16, 2013. 2013 LVP in WEU similar to Q4’12
run rate 000’s
Q1
Q2
Q3
Q4
FY
2008
4,141
4.178
3,250
2.749
14,318
2009
2,471
3,024
2,968
3,271
11,734
2012
3,555
3.230
2,792
2,978
12,554
2013
3,076
3.069
2,642
3,060
11,847
•
LVP declining back to 2009 levels
•
CPV ~ $400
000’s
Q1
Q2
Q3
Q4
FY
2008
7,332
7694
6,890
6,312
28,229
2009
6,022
7,323
7,744
8,853
29,942
2012
10,493
10,630
10,203
11,193
42,519
2013
10,807
11,213
11,217
11,935
45,173
•
LVP setting new record levels
•
CPV ~ $200 |
 ALV
Q4’12
Financial
Earnings
Report
-
5
Continued Strategy Execution
-
In a challenging environment
Capacity alignment activities while investing in growth markets
Record order intake
Continued investments in technology and growth markets
Capacity alignment progressing
Strong balance sheet for;
•
growth opportunities
•
uncertain environment |
 ALV
Q4’12 Financial Earnings Report -
6
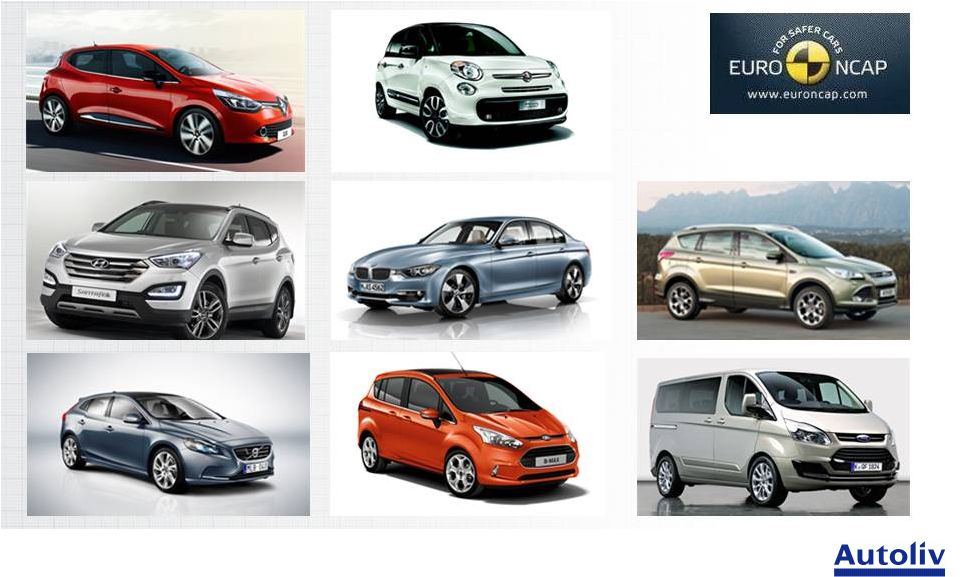
Renault Clio
Ford B-Max
Euro NCAP Today
-
2012 Best in Class 5 Star Models
BMW 3-Series
Hyundai Santa Fe
Fiat 500L
Ford Transit
Ford Kuga
Volvo V40 |
 ALV
Q4’12 Financial Earnings Report -
7
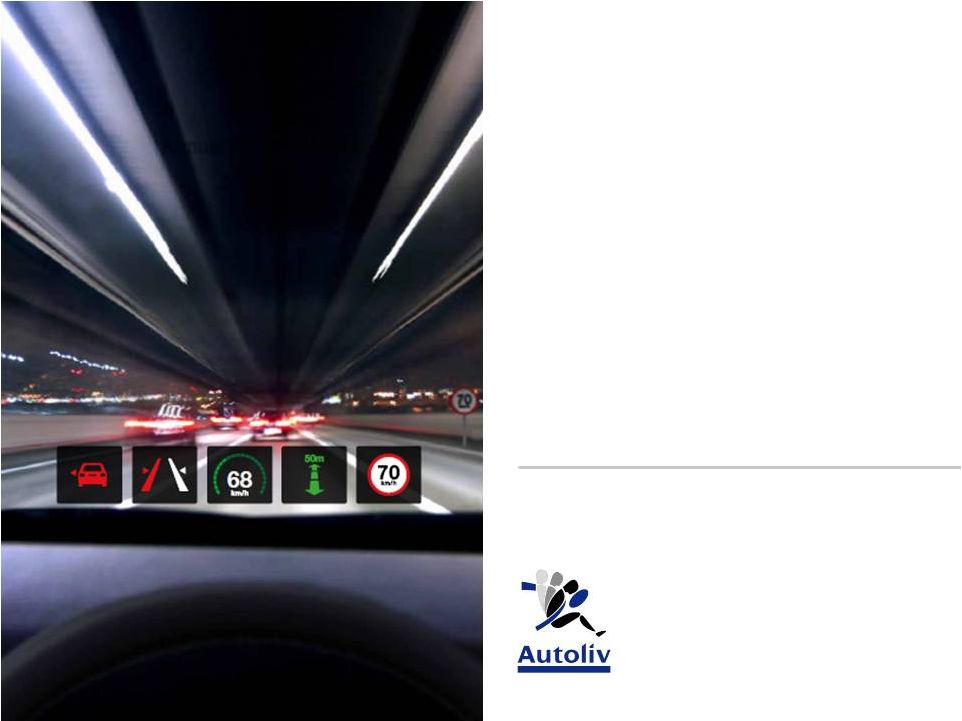
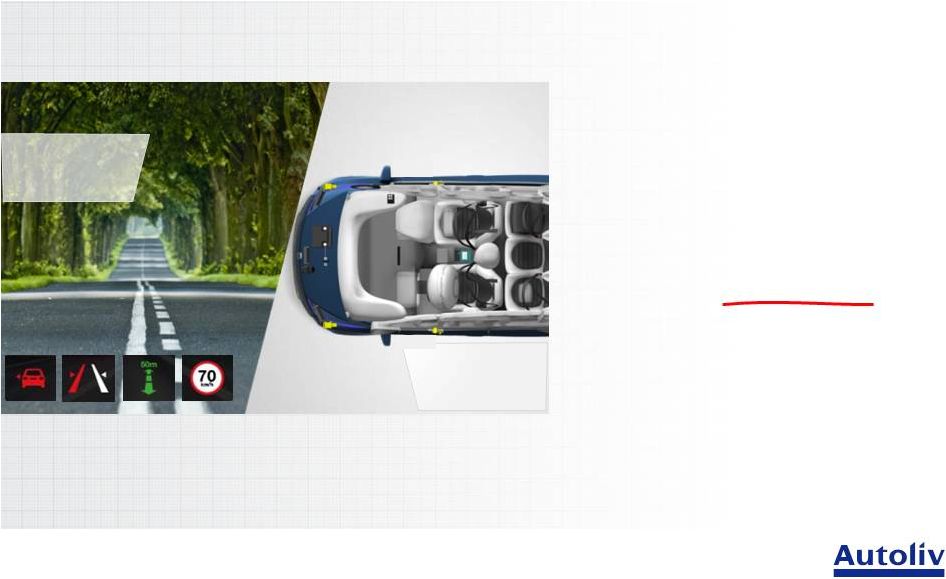
Euro NCAP in the Future
-
Migration towards Active Safety
2014
•
Active Safety weighting increases from 10% to 20%
•
Active Safety required to achieve 5 Star
•
Euro NCAP points of focus for Active Safety
•
Lane Departure Warning, Autonomous Braking
•
Intelligent Speed Assist (50% urban)
2017
•
Active Safety required to achieve 4 Star
•
Euro NCAP points of focus for Active Safety
•
Lane Departure Warning, Autonomous Braking
•
Intelligent Speed Assist (100% urban)
Active Safety technologies are under evaluation by NHTSA for the new US NCAP
|
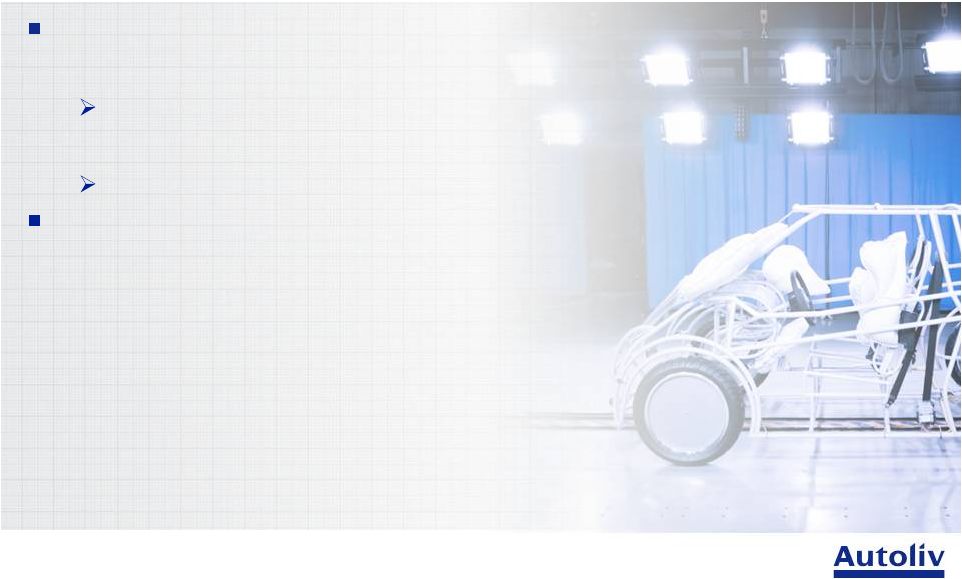
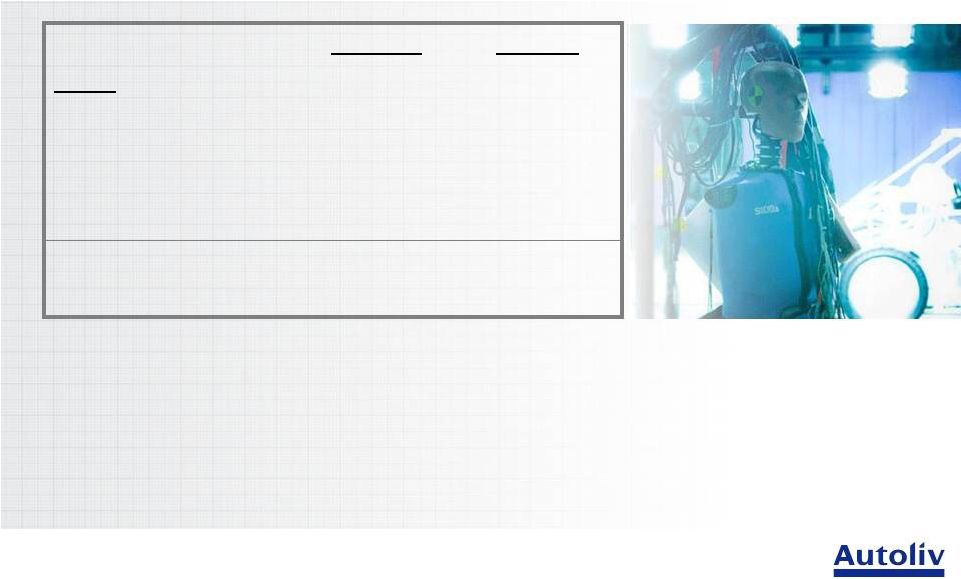
 Investments for Growth
-
Active and Passive Safety Technologies
ACTIVE
SAFETY
NIGHT VISION
Automatic Animal Detection
Dynamic Spot Light
Sensor Fusion NIR / FIR
STEREO VISION
Pedestrian Detection
RADAR
LRR Narrow Band
Multi-Mode
PASSIVE
SAFETY
BAG-IN-BELT
KNEE AIRBAG
ACTIVE SEATBELT
PEDESTRIAN AIRBAG
DUAL PRETENSIONING
Estimate ~ 5% CAGR in our automotive safety market from 2012
thru 2015
ALV Q4’12 Financial Earnings Report
-
8
SAFETY DOMAIN CONTROLLER Brake Controls
Integration with Airbag ECU
|
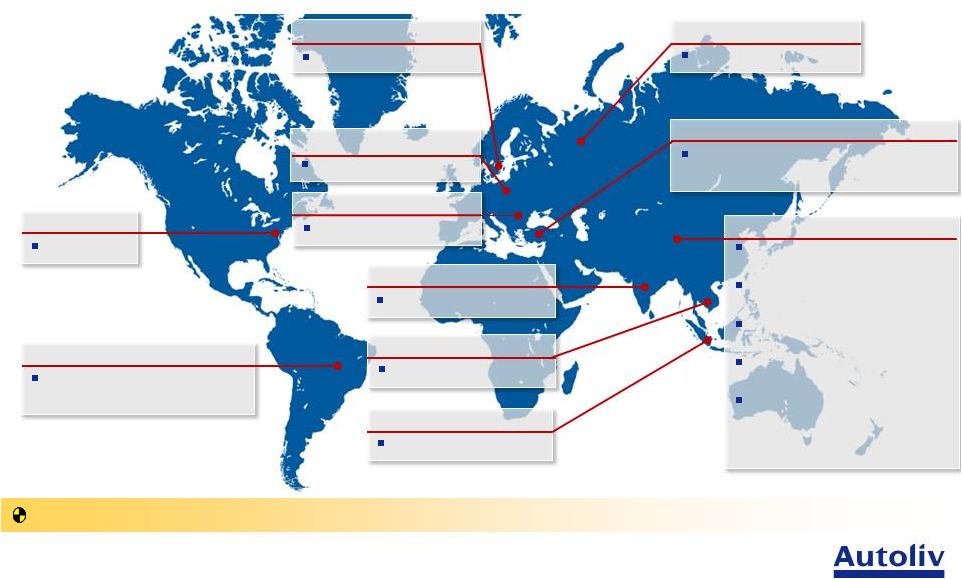 Investments for Growth
-
Facility expansions
China
Jintan
(propellant)
Changchun
Guangzhou
Nanjing
Shanghai
India
Webbing
Thailand
Cushion cut&sewn
Sweden
Radar
U.S.
Radar
Romania
Steering Wheel
Indonesia
Seatbelt & Airbag
Russia
Seatbelt & Airbag
Investing ~ $0.5BM on growth initiatives in 2011 and 2012
Poland
Airbag
Turkey
Airbags, Seatbelts, Steering
Wheel, Component Manufacturing
Brazil
Airbags, Seatbelts, Steering
Wheel, Webbing
ALV Q4’12 Financial Earnings Report
-
9
(seatbelts & airbags)
(seatbelts & airbags)
(seatbelts)
(ECU’s & crash sensors, Tech
Center) |
 ALV Q4’12 Financial Earnings Report
-
10
(*) Non US GAAP and restated for ASC 810-10-45.
Cash Flow
-
Investments for growth in CapEx and RD&E
(US $ Mil’s unless specified)
Q4
2012
Q4
2011
FY
2012
FY
2011
FY
2010
FY
2009
Net Income
140
160
486
627
596
13
Depreciation & Amortization
69
70
273
268
282
314
Other, net
(4)
1
10
38
57
(41)
Change in operating WC
36
62
(80)
(175)
(11)
207
Operating cash flow
241
293
689
758
924
493
Capital Expenditures, net
(99)
(100)
(360)
(357)
(224)
(130)
Free cash flow *
142
193
329
401
700
363
Dividend payment
48
40
178
154
58
15
Strong operating cash flow and dividend payment increased YoY
|
 Dividend Trend
-
Per share and cash payments*
Dividend per share
Dividend Payments
Dividend Payments
* Estimated
dividend
payment
for
Q1
2013
based
on
share
count
at
end
of
4
quarter
2012
Annualized payment to shareholders ~ $190M based on $2.00 per
share
0.5
0.4
0.3
0.2
0.1
0
60
40
20
0
ALV
Q4’12
Financial
Earnings
Report
-
11
th
1997
98
99
2000
01
02
03
04
05
06
07
08
09
2010
11
12
13 |
 FY
Financial Overview -
Record sales and dividend per share
Solid result despite LVP decline YoY in WEU ~ 8%
(*) Non
US
GAAP
Earnings
Before
Interest
and
Taxes,
Earnings
per
share,
Return
on
Capital
Employed,
Return
on
Equity
(**) US
GAAP
reported,
Dividend
per
share
(***)
IHS
Global
Light
Vehicle
Production
(US $ Mil’s unless specified)
2012
2011
Sales
$8,267
$8,232
Gross Profit
$1,646
19.9%
$1,728
21.0%
EBIT *
$803
9.7%
$908
11.0%
EPS *
(assuming dilution)
$5.82
$6.80
RoCE *
24%
28%
RoE *
15%
20%
Operating Cash flow
$689
$758
DPS **
$1.89
$1.73
GLVP ***
~ 80M
~ 75M
ALV
Q4’12
Financial
Earnings
Report
-
12 |
 (*) Light
Vehicle
Production,
Source
IHS
January
16,
2013,
TRIAD
(WEU,
North
America,
Japan),
(**)
Includes
Acquisitions
Autoliv Production**
-
FY2012
Maintaining ~ 36% global passive safety market share
Units in Millions (unless specified)
2012
Change vs.’11
Seatbelts
139.1
5%
•
Pretensioners
(of which)
[54.9]
[3%]
•
Active Seatbelts
(of which)
1.6
40%
Frontal airbags
35.1
8%
Knee airbags
2.5
89%
Side airbags
72.0
7%
•
Chest (Thorax)
37.3
7%
•
Head (Curtain)
34.7
8%
Steering Wheels
12.9
4%
Electronic Control Units
13.6
1%
Active Safety Units
1.6
79%
LVP* TRIAD
37.2
8%
LVP* GLOBAL
79.7
7%
ALV
Q4’12
Financial
Earnings
Report
-
13 |
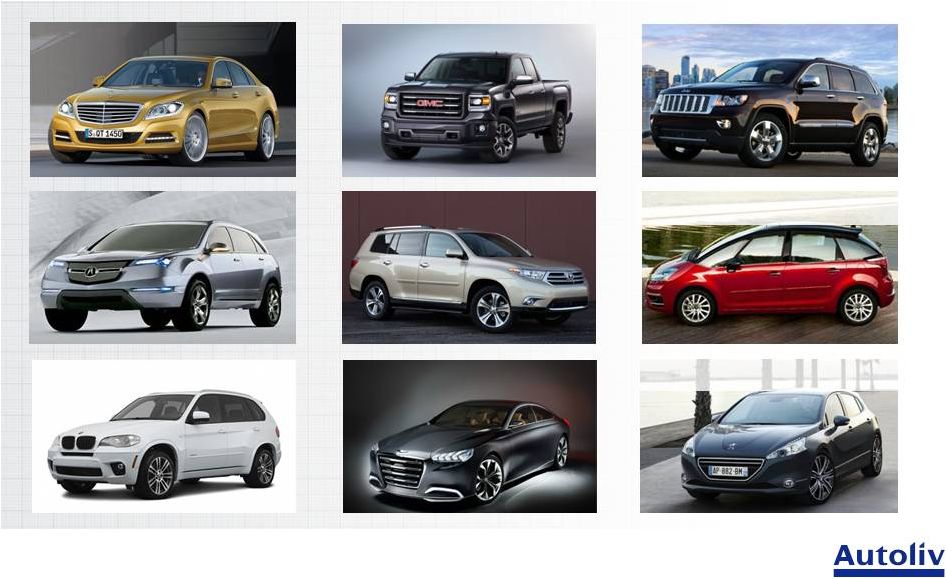 Mercedes S-Class
Hyundai Genesis
Toyota Highlander
Acura MDX
GMC Sierra
Citroën C4 Picasso
Jeep Cherokee
BMW X5
Peugeot 309
* Images may not reflect new model
Major Platform Launches
-
FY2013
ALV
Q4’12
Financial
Earnings
Report
-
14 |
 Looking Ahead
-
Q1 2013
(*) Earnings Before Interest & Taxes excludes legal costs & other charges
related to the on-going anti-trust investigations & alignment costs
Sales
•
YoY organic sales decline ~ (4%)
EBIT* Margin ~ 8%
•
Sequential change is mainly due to lower engineering income
mainly related to the sharp LVP decline in WEU and Japan
mainly related to Q4 launches
ALV
Q4’12
Financial
Earnings
Report
-
15
•
Sequentially organic sales up slightly
•
YoY change is mainly due to organic sales drop
|
 •
2 half improvement due to organic sales growth in active safety,
launches and underlying LVP improvement
•
1
half lower due to higher RD&E and continued low level LVP in WEU
Early Indication
-
FY2013
Sales
EBIT* Margin ~ 9%
•
YoY organic sales effect offset by higher RD&E and temporary margin
effect from increasing vertical integration and growth
H1 vs. H2
(*) Earnings Before Interest & Taxes excludes legal costs & other charges
related to the on-going anti-trust investigations & alignment costs
strong
growth
in
Active
Safety
&
China
favorable launch mix
partially offset by lower LVP in WEU & Japan
st
nd
ALV
Q4’12
Financial
Earnings
Report
-
16
+
1
to
3%
•
YoY
organic
sales
growth |
 Financial Outlook
Q1 2013
FY2013
Sales
Organic
(4%)
1 to 3%
Acquisitions /
(Divestitures)
~ (0.4%)
~ (0.2%)
Fx**
~ 0.1%
~ 1.1%
Consolidated Sales
~ (4%)
2 to 4 %
EBIT Margin *
~ 8 %
~ 9 %
(*) Excludes legal costs & other charges related to the on-going
anti-trust investigations and alignment costs
(**) 1 Euro = 1.33 US$, 1 US$ = 89JPY for Q1’13 & FY2013
ALV
Q4’12
Financial
Earnings
Report
-
17 |
 Autoliv
Every year, Autoliv’s products
save over 25,000 lives
Passive
Safety
Active
Safety
Autoliv -
Safety Systems
Thank you!
ALV
Q4’12
Financial
Earnings
Report
-
18 |