Attached files
| file | filename |
|---|---|
| 8-K - FORM 8-K - OCCIDENTAL PETROLEUM CORP /DE/ | form8k-20130131.htm |
| EX-99.2 - EXHIBIT 99.2 - OCCIDENTAL PETROLEUM CORP /DE/ | ex99_2-20130131.htm |
| EX-99.1 - EXHIBIT 99.1 - OCCIDENTAL PETROLEUM CORP /DE/ | ex99_1-20130131.htm |
| EX-99.3 - EXHIBIT 99.3 - OCCIDENTAL PETROLEUM CORP /DE/ | ex99_3-20130131.htm |
| EX-99.5 - EXHIBIT 99.5 - OCCIDENTAL PETROLEUM CORP /DE/ | ex99_5-20130131.htm |
EXHIBIT 99.4

Occidental Petroleum Corporation
Fourth Quarter 2012 Earnings Conference Call
January 31, 2013
1

Fourth Quarter 2012 Earnings - Highlights
• Core Income - $1.5 billion in 4Q12 vs. $1.6 billion in
4Q11 or $1.4 billion in 3Q12.
4Q11 or $1.4 billion in 3Q12.
– EPS $1.83 (diluted) vs. $2.02 (diluted) in 4Q11 or $1.70 in 3Q12.
– The improvement from 3Q12 reflected the effect of higher liquids
production, higher realized NGL and domestic gas prices and
reduced operating expenses in the oil and gas business,
partially offset by lower earnings in the midstream segment.
production, higher realized NGL and domestic gas prices and
reduced operating expenses in the oil and gas business,
partially offset by lower earnings in the midstream segment.
• Pre-tax charges of $1.8 billion, representing $1.1 billion
after-tax or $1.41 per diluted share.
after-tax or $1.41 per diluted share.
– Almost all of the charges were for impairments in the Oil and
Gas Midcontinent business units, over 90% of which was related
to natural gas properties, which were acquired more than four
years ago on average.
Gas Midcontinent business units, over 90% of which was related
to natural gas properties, which were acquired more than four
years ago on average.
2
2

Fourth Quarter 2012 Earnings - Highlights
• Pre-tax charges of $1.8 billion (cont’d):
– While the performance of the properties was generally as expected,
natural gas prices have declined by ~50% since the acquisitions.
natural gas prices have declined by ~50% since the acquisitions.
– Natural gas and NGL prices used for reserve calculations in 2012 were
significantly lower than prices used in 2011, resulting in declines in
economically feasible reserves in these properties.
significantly lower than prices used in 2011, resulting in declines in
economically feasible reserves in these properties.
– In addition, despite the recent modest increase in gas prices, drilling in
many gassy areas remains uneconomical.
many gassy areas remains uneconomical.
– As a result, we continue to operate at minimal levels in these areas.
– The charges related to the natural gas properties reflect the impairment
of such properties to approximate fair value.
of such properties to approximate fair value.
• Net income after the 4Q12 charge was $336 million, or
$0.42 per diluted share.
$0.42 per diluted share.
3
3
4
Fourth Quarter 2012 Earnings - Oil & Gas Segment
Variance Analysis - 4Q12 vs. 3Q12
Variance Analysis - 4Q12 vs. 3Q12
Fourth Quarter 2012 Earnings - Oil & Gas Segment
Variance Analysis - 4Q12 vs. 3Q12
Variance Analysis - 4Q12 vs. 3Q12
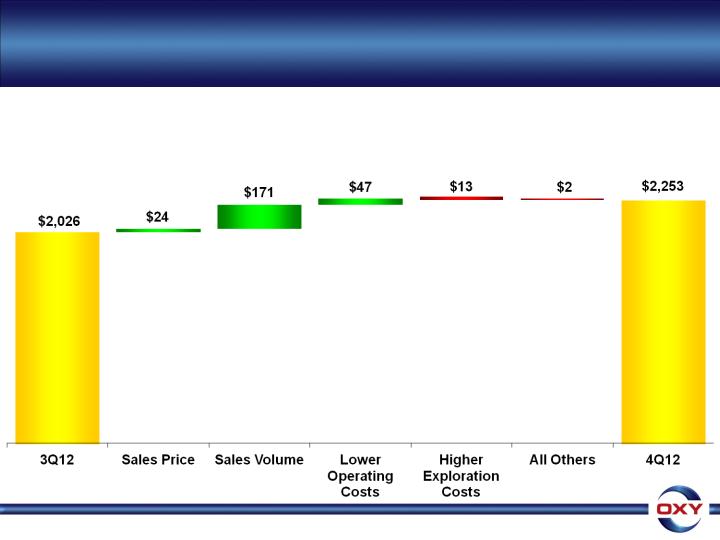
• Core Results for 4Q12 of $2.3 B vs. $2.0 B in 3Q12 or $2.5 B in 4Q11
– We delivered a quarter-over-quarter improvement, despite the decline in WTI prices, as a
result of higher liquids production, higher realized NGL and domestic gas prices and,
importantly, lower operating expenses.
result of higher liquids production, higher realized NGL and domestic gas prices and,
importantly, lower operating expenses.
($ in millions)
4

5
• 4Q12 production costs were $14.95 per barrel, which
was $1.04 per barrel lower than 3Q12.
was $1.04 per barrel lower than 3Q12.
– These reductions occurred during the course of the quarter and
our year-end exit rate on a per barrel basis was lower than the
4Q11 average and well below the 4Q12 level, giving us
confidence as we begin 2013.
our year-end exit rate on a per barrel basis was lower than the
4Q11 average and well below the 4Q12 level, giving us
confidence as we begin 2013.
• Oil and gas production costs were $14.99 per barrel for
the twelve months of 2012, compared with $12.84 per
barrel for the full year of 2011.
the twelve months of 2012, compared with $12.84 per
barrel for the full year of 2011.
Fourth Quarter 2012 Earnings - Oil & Gas Segment
Production Costs
Production Costs
Fourth Quarter 2012 Earnings - Oil & Gas Segment
Production Costs
Production Costs
5

6
4Q12 4Q11 3Q12
• Oil and Gas Production (mboe/d) 779 748 766
• 4Q12 production of 779 mboe/d increased 4% from 4Q11, and a new
company record;
company record;
• ~6 mboe/d, or almost half of the total sequential increase in quarterly
production came from domestic operations, mainly in California and
Permian, almost all of which was attributable to higher oil production.
production came from domestic operations, mainly in California and
Permian, almost all of which was attributable to higher oil production.
• Domestic production was 475 mboe/d, an increase of 6 mboe/d from 3Q12
and the ninth consecutive quarterly domestic volume record for the
company.
and the ninth consecutive quarterly domestic volume record for the
company.
– Production was 6% higher than 4Q11.
– All of the net sequential quarterly increase came from oil production in California
and Permian.
and Permian.
– Domestic gas production was down slightly from 3Q12, which was offset by higher
liquids production resulting from higher yields from our new Elk Hills gas plant.
liquids production resulting from higher yields from our new Elk Hills gas plant.
Fourth Quarter 2012 Earnings - Oil & Gas Segment
Production Volumes
Production Volumes
Details regarding country-specific production levels available in the IR Supplemental Schedules
6

7
• Latin America volumes were 32 mboe/d, which was flat
compared to 3Q12 and the same period in 2011.
compared to 3Q12 and the same period in 2011.
• In the Middle East, volumes were 272 mboe/d, an increase
of 7 mboe/d from 3Q12.
of 7 mboe/d from 3Q12.
– Higher spending levels in Iraq and Oman resulted in 8 mboe/d higher
production.
production.
– Dolphin production was lower due to the full cost recovery of pre-
startup capital.
startup capital.
• Other factors affecting production sharing and similar
contracts, including oil prices, did not significantly impact this
quarter’s production volumes compared to 4Q11 or 3Q12.
contracts, including oil prices, did not significantly impact this
quarter’s production volumes compared to 4Q11 or 3Q12.
Fourth Quarter 2012 Earnings - Oil & Gas Segment
Production Volumes
Production Volumes
Fourth Quarter 2012 Earnings - Oil & Gas Segment
Production Volumes
Production Volumes
Details regarding country specific production levels available in the IR Supplemental Schedules
7

8
Fourth Quarter 2012 Earnings - Oil & Gas Segment
4Q12 4Q11
Reported Segment Income ($mm) $522 $2,537
WTI Oil Price ($/bbl) $88.18 $94.06
Brent Oil Price ($/bbl) $110.08 $109.07
NYMEX Gas Price ($/mcf) $3.37 $3.68
Oxy’s Realized Prices
Worldwide Oil ($/bbl) $96.19 $99.62
-3% year-over-year
Worldwide NGLs ($/bbl) $45.08 $55.25
-18% year-over-year
US Natural Gas ($/mcf) $3.09 $3.59
-14% year-over-year
8

9
• Realized oil prices for 4Q12 represented 109% of the average
WTI price and 87% of the average Brent price.
WTI price and 87% of the average Brent price.
• Realized NGL prices were 51% of the average WTI price and
realized domestic gas prices were 92% of the average NYMEX
price.
realized domestic gas prices were 92% of the average NYMEX
price.
• At current global prices, a $1 p/bbl change in oil prices affects
our quarterly earnings before income taxes by $37 mm and
$7 mm for a $1 p/bbl change in NGL prices.
our quarterly earnings before income taxes by $37 mm and
$7 mm for a $1 p/bbl change in NGL prices.
• A change in domestic gas prices of 50 cents per mmBTUs
affects quarterly pre-tax earnings by about $30 mm.
affects quarterly pre-tax earnings by about $30 mm.
• These price change sensitivities include the impact of
production-sharing and similar contract volume changes.
production-sharing and similar contract volume changes.
Fourth Quarter 2012 Earnings - Oil & Gas Segment
Realized Prices
Realized Prices
Fourth Quarter 2012 Earnings - Oil & Gas Segment
Realized Prices
Realized Prices
9

10
• Taxes other than on income, which are generally related to
product prices, were $2.39 per boe for the full year of 2012,
compared with $2.21 per boe for the full year of 2011.
product prices, were $2.39 per boe for the full year of 2012,
compared with $2.21 per boe for the full year of 2011.
• 4Q12 exploration expense was $82 mm.
– We expect 1Q13 exploration expense to be about $90 mm for seismic
and drilling in our exploration programs.
and drilling in our exploration programs.
• Our 4Q12 DD&A rate was $14.47 per boe and we expect the
full year 2013 rate to be ~$17 per barrel.
full year 2013 rate to be ~$17 per barrel.
Fourth Quarter 2012 Earnings - Oil & Gas Segment
Taxes, Exploration Expense and DD&A
Taxes, Exploration Expense and DD&A
Fourth Quarter 2012 Earnings - Oil & Gas Segment
Taxes, Exploration Expense and DD&A
Taxes, Exploration Expense and DD&A
10

11
Fourth Quarter 2012 Earnings - Chemical Segment
Variance Analysis - 4Q12 vs. 3Q12
Variance Analysis - 4Q12 vs. 3Q12
Fourth Quarter 2012 Earnings - Chemical Segment
Variance Analysis - 4Q12 vs. 3Q12
Variance Analysis - 4Q12 vs. 3Q12
• Core Results in 4Q12 of $180 mm vs. $162 mm in 3Q12 and $144 mm in 4Q11
– The sequential quarterly improvement reflected higher caustic soda and PVC prices, partially
offset by higher energy and feedstock costs. The year-over-year increase reflected higher
export volumes for caustic soda and VCM and lower feedstock costs.
offset by higher energy and feedstock costs. The year-over-year increase reflected higher
export volumes for caustic soda and VCM and lower feedstock costs.
($ in millions)
* Higher energy and feedstock costs
11

12
• Chemical segment 1Q13 earnings are expected to be
~$150 mm.
~$150 mm.
– Typical weak seasonal demand, particularly in the construction
and agricultural market segments combined with the recent
increases in ethylene and natural gas costs may, however,
tighten margins in the first quarter.
and agricultural market segments combined with the recent
increases in ethylene and natural gas costs may, however,
tighten margins in the first quarter.
Fourth Quarter 2012 Earnings - Chemical Segment
Fourth Quarter 2012 Earnings - Chemical Segment
12
13
Fourth Quarter 2012 Earnings - Midstream
Segment Variance Analysis - 4Q12 vs. 3Q12
Segment Variance Analysis - 4Q12 vs. 3Q12
Fourth Quarter 2012 Earnings - Midstream
Segment Variance Analysis - 4Q12 vs. 3Q12
Segment Variance Analysis - 4Q12 vs. 3Q12
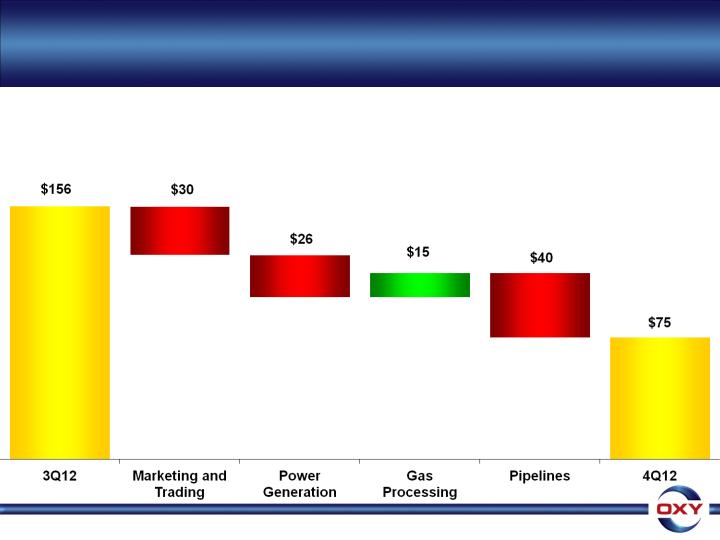
• Core Results for 4Q12 were $75 mm vs. $156 mm in 3Q12 and $70 mm in 4Q11
– The 2012 sequential quarterly decrease in earnings was caused by lower marketing and trading,
foreign pipeline and power generation earnings.
foreign pipeline and power generation earnings.
($ in millions)
13

14
• The worldwide effective tax rate on core income was 37% for
the 4Q12.
the 4Q12.
• The rate was lower than the prior quarter and our guidance,
largely due to a higher proportion of domestic income in
4Q12 than foreign income.
largely due to a higher proportion of domestic income in
4Q12 than foreign income.
• Our 4Q12 U.S. and foreign tax rates are included in the
Investor Relations Supplemental Schedules.
Investor Relations Supplemental Schedules.
• We expect our combined worldwide tax rate in 1Q13 to
increase to about 40%.
increase to about 40%.
Fourth Quarter 2012 Earnings - Income Taxes
Fourth Quarter 2012 Earnings - Income Taxes
14
15
Fourth Quarter 2012 Earnings - 2012 Cash Flow
Fourth Quarter 2012 Earnings - 2012 Cash Flow
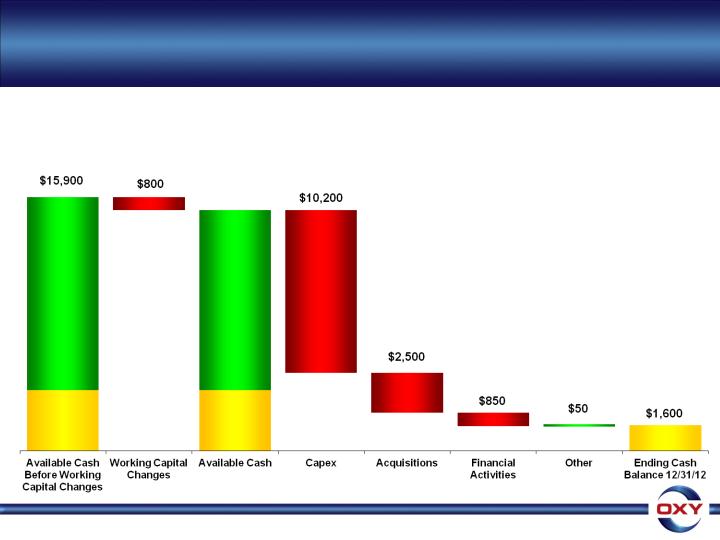
• In 2012, we generated $12.1 billion of cash flow from continuing operations before
changes in working capital. Working capital changes reduced our full year cash flow
from operations by ~$800 mm to $11.3 billion.
changes in working capital. Working capital changes reduced our full year cash flow
from operations by ~$800 mm to $11.3 billion.
($ in millions)
Cash Flow
From
Operations
before
Working
Capital
changes
From
Operations
before
Working
Capital
changes
$12,100
Beginning
Cash
$3,800
12/31/11
Cash
$3,800
12/31/11
Cash Flow
From
Operations
$11,300
From
Operations
$11,300
$15,100
Beginning
Cash
$3,800
12/31/11
Cash
$3,800
12/31/11
15

16
• Capital expenditures for 2012 were $10.2 billion, of which $2.5
billion was spent in 4Q12.
billion was spent in 4Q12.
– 4Q12 capital spend was ~$100 million lower than 3Q12 driven by an ~12% reduction
in oil and gas spending, partially offset by increases in the chemical and midstream
segments.
in oil and gas spending, partially offset by increases in the chemical and midstream
segments.
– The higher capital at chemicals was related to the construction of a new membrane
chlor-alkali plant in Tennessee, expected to be completed by 4Q13.
chlor-alkali plant in Tennessee, expected to be completed by 4Q13.
– Midstream capital was higher mainly due to the Al Hosn gas project.
• Total year capital expenditures by segment were 80% in oil and
gas, 15% in midstream and the remainder in chemicals.
gas, 15% in midstream and the remainder in chemicals.
• Acquisitions for 2012 were $2.5 billion, of which $1.3 billion was
spent in 4Q12 on domestic oil and gas properties.
spent in 4Q12 on domestic oil and gas properties.
• Financial activities, which included five quarterly dividends
paid, stock buybacks and a $1.74 billion borrowing earlier this
year, resulted in a net use of cash of $850 million.
paid, stock buybacks and a $1.74 billion borrowing earlier this
year, resulted in a net use of cash of $850 million.
• These and other net cash flows resulted in a $1.6 billion cash
balance at 12/31/12.
balance at 12/31/12.
Fourth Quarter 2012 Earnings - 2012 Cash Flow
Fourth Quarter 2012 Earnings - 2012 Cash Flow
16

17
Fourth Quarter 2012 Earnings -
Shares Outstanding, Debt/Capital, ROE & ROCE
Shares Outstanding, Debt/Capital, ROE & ROCE
• During the year, we bought ~7.5 million of our own shares at a cost of
about $580 million. Approximately 5 million of the shares were
purchased in 4Q12 at an average price of $76.15.
about $580 million. Approximately 5 million of the shares were
purchased in 4Q12 at an average price of $76.15.
Shares Outstanding (mm) FY2012 12/31/12
Weighted Average Basic 809.3
Weighted Average Diluted 810.0
Shares Outstanding 805.5
FY2012 12/31/12
Debt/Capital 16%
Return on Equity* 14.6%
Return on Capital Employed* 12.6%
Note: See attached GAAP reconciliation
*Using core results
17

18
Fourth Quarter 2012 Earnings -
Key Performance Metrics - Production
Key Performance Metrics - Production
Fourth Quarter 2012 Earnings -
Key Performance Metrics - Production
Key Performance Metrics - Production
• Occidental’s domestic oil and gas segment produced record
volumes for the ninth consecutive quarter and continued to execute
on our oil production growth strategy.
volumes for the ninth consecutive quarter and continued to execute
on our oil production growth strategy.
• 4Q12 domestic production of 475 mboe/d, consisting of 342 mboe/d
of liquids and 800 mmcf/d of gas, an increase of 6 mboe/d vs. 3Q12.
of liquids and 800 mmcf/d of gas, an increase of 6 mboe/d vs. 3Q12.
• The increase was almost entirely in oil, which grew from 260 mb/d
to 265 mb/d.
to 265 mb/d.
− Gas production declined 12 mmcf/d on a sequential quarterly basis mainly in the
Midcontinent, which reflects the reduction in gas-directed drilling we have
mentioned over the past couple of quarters.
Midcontinent, which reflects the reduction in gas-directed drilling we have
mentioned over the past couple of quarters.
− Higher natural gas liquids volumes, resulting from better yields from our new Elk
Hills gas plant, offset the decline in the gas production.
Hills gas plant, offset the decline in the gas production.
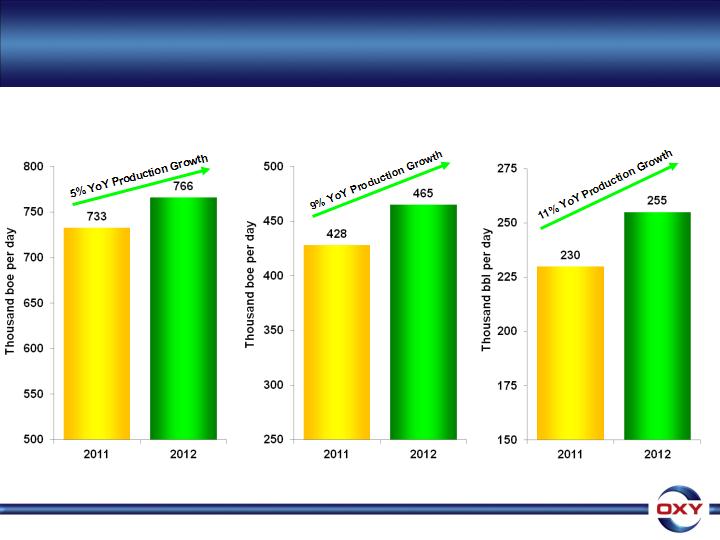
• Total year domestic production grew from 428 mboe/d in 2011 to
465 mboe/d in 2012, or about 9%.
465 mboe/d in 2012, or about 9%.
• Total year domestic oil production grew by 11% from 230 mb/d in
2011 to 255 mb/d in 2012.
2011 to 255 mb/d in 2012.
18
Fourth Quarter 2012 Earnings -
Key Performance Metrics - Production
Key Performance Metrics - Production
Fourth Quarter 2012 Earnings -
Key Performance Metrics - Production
Key Performance Metrics - Production
+33 mboe/d
production
growth
production
growth
Total Company
Total Domestic
Total Domestic Oil
+36 mboe/d
production
growth
production
growth
+25 mb/d
production
growth
production
growth
19
19

20
Fourth Quarter 2012 Earnings - Capital Efficiency &
Operating Cost Reduction Program
Operating Cost Reduction Program
Fourth Quarter 2012 Earnings - Capital Efficiency &
Operating Cost Reduction Program
Operating Cost Reduction Program
• We have embarked on an aggressive plan to improve our
operational efficiencies over all cost categories, including
capital - with a view toward achieving an appreciable reduction
in our operating expenses and drilling costs to at least 2011
levels in order to create higher margins from our production.
operational efficiencies over all cost categories, including
capital - with a view toward achieving an appreciable reduction
in our operating expenses and drilling costs to at least 2011
levels in order to create higher margins from our production.
• With regard to driving efficiencies in our cash operating costs,
we are running well ahead of plan.
we are running well ahead of plan.
– All of our business units stepped up to the challenge of reducing our
costs and involved their personnel at all levels, from business unit
management all the way to field level personnel, to generate ideas to
improve cost efficiency, and our employees responded.
costs and involved their personnel at all levels, from business unit
management all the way to field level personnel, to generate ideas to
improve cost efficiency, and our employees responded.
– The business units generated many good ideas, large numbers of which
were generated by field level personnel. Many of these ideas have already
been implemented, and the results are apparent through reductions
already realized in operating expenses.
were generated by field level personnel. Many of these ideas have already
been implemented, and the results are apparent through reductions
already realized in operating expenses.
20

21
• In 4Q12, total company production costs were $1.04 p/bbl
lower than 3Q12.
lower than 3Q12.
− Improvements were realized across most business units, most notably
in the Permian and Elk Hills.
in the Permian and Elk Hills.
− The reductions resulted from efficiencies achieved across most cost
categories including savings in surface operations, reductions in the
use of outside contractors, curtailment of uneconomic down-hole
maintenance and workover activity as well as related overhead.
categories including savings in surface operations, reductions in the
use of outside contractors, curtailment of uneconomic down-hole
maintenance and workover activity as well as related overhead.
• In 2013, we expect to realize further improvements in all of
these categories.
these categories.
− We expect our production costs to be under $14 p/boe in 2013, which
is significantly lower than the 2012 average costs.
is significantly lower than the 2012 average costs.
− Many of the steps already taken during 4Q12, which are only partially
reflected in the quarter's average costs, along with additional
measures being implemented early in the year, should result in
meaningful additional cost reductions in 2013 and beyond.
reflected in the quarter's average costs, along with additional
measures being implemented early in the year, should result in
meaningful additional cost reductions in 2013 and beyond.
Fourth Quarter 2012 Earnings - Capital Efficiency &
Operating Cost Reduction Program
Operating Cost Reduction Program
Fourth Quarter 2012 Earnings - Capital Efficiency &
Operating Cost Reduction Program
Operating Cost Reduction Program
21

22
• We are seeing strong early results from our efforts
toward improving drilling efficiency and cutting our well
costs through the simplification of our well design,
focusing our activities on fewer geologic play types and
favoring higher return conventional activity.
toward improving drilling efficiency and cutting our well
costs through the simplification of our well design,
focusing our activities on fewer geologic play types and
favoring higher return conventional activity.
• Our goal for 2013 is to reduce our U.S. drilling costs by
15% compared to 2012 and we are approximately halfway
toward that target with further improvements expected
during the next couple of quarters.
15% compared to 2012 and we are approximately halfway
toward that target with further improvements expected
during the next couple of quarters.
Fourth Quarter 2012 Earnings - Capital Efficiency &
Operating Cost Reduction Program
Operating Cost Reduction Program
Fourth Quarter 2012 Earnings - Capital Efficiency &
Operating Cost Reduction Program
Operating Cost Reduction Program
22

23
Fourth Quarter 2012 Earnings - Dividends
Fourth Quarter 2012 Earnings - Dividends
• We have increased our dividends at a compounded annual
rate of 15.8% over the last 10 years through 11 dividend
increases.
rate of 15.8% over the last 10 years through 11 dividend
increases.
• We expect to announce a further dividend increase after
the meeting of the Board of Directors in the second week
of February.
the meeting of the Board of Directors in the second week
of February.
• As a result of our consistent long-term record of growing
our dividend, we are proud to have been selected for
inclusion in Mergent’s Dividend Achievers indices for
2013.
our dividend, we are proud to have been selected for
inclusion in Mergent’s Dividend Achievers indices for
2013.
− This is a highly regarded series of indices that track companies with
strong long-term dividend growth.
strong long-term dividend growth.
23

24
Fourth Quarter 2012 Earnings - Oil & Gas Reserves
Fourth Quarter 2012 Earnings - Oil & Gas Reserves
• Based on our preliminary estimates of our year-end 2012
reserve levels:
reserve levels:
• We produced ~280 mmboe in 2012.
• Our total company reserve replacement ratio from all
categories, including revisions, was about 143%, or
~400 mm boe.
categories, including revisions, was about 143%, or
~400 mm boe.
− Depressed domestic gas prices and changes in our plans for drilling on
gas properties resulted in negative revisions in domestic gas reserves.
gas properties resulted in negative revisions in domestic gas reserves.
− Natural gas reserve revisions represented ~60% of the total revisions.
If gas prices recover in the future, a portion of these reserves will be
reinstated. Additionally, we experienced some negative revisions due
to reservoir performance.
If gas prices recover in the future, a portion of these reserves will be
reinstated. Additionally, we experienced some negative revisions due
to reservoir performance.
24
25
Fourth Quarter 2012 Earnings - Oil & Gas Reserves
Fourth Quarter 2012 Earnings - Oil & Gas Reserves
• Our 2012 development program, excluding acquisitions
and revisions, replaced ~175% of our production with
~490 mmboe of reserve additions.
and revisions, replaced ~175% of our production with
~490 mmboe of reserve additions.
• Our 2012 program, including acquisitions but excluding
revisions of prior year estimates, replaced 209% of our
production.
revisions of prior year estimates, replaced 209% of our
production.
− We believe these latter two approaches are an appropriate way of
evaluating the progress of our overall program.
evaluating the progress of our overall program.
• At year end, we estimate that 72% of our total proved
reserves were liquids. Of the total reserves, ~73% were
proved developed reserves.
reserves were liquids. Of the total reserves, ~73% were
proved developed reserves.
25

26
Fourth Quarter 2012 Earnings -
2013 Production Outlook
2013 Production Outlook
Fourth Quarter 2012 Earnings -
2013 Production Outlook
2013 Production Outlook
• Domestically, we expect oil production for all of 2013 to
grow by about 8% to 10% from the 2012 average.
grow by about 8% to 10% from the 2012 average.
− With lower drilling on gas properties, we expect gas and NGL
production to decline somewhat.
production to decline somewhat.
− Planned plant turnarounds in the Permian CO2 business will cause
additional volatility to production in the first half of the year.
additional volatility to production in the first half of the year.
• Internationally, at current prices we expect production to
be lower in 1Q13 due to a planned turnaround in Qatar.
be lower in 1Q13 due to a planned turnaround in Qatar.
− Production should be relatively flat the rest of the year compared
to 4Q12.
to 4Q12.
26
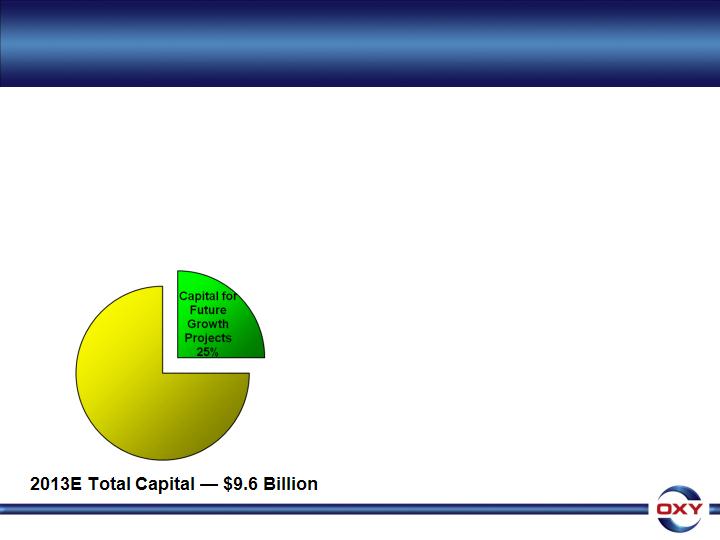
• Capital for future growth projects:
− The Al Hosn gas project.
− Construction has begun on the
BridgeTex pipeline, which we
expect will start operations in 2014.
BridgeTex pipeline, which we
expect will start operations in 2014.
• Pipeline is designed to deliver
crude oil from West TX to
Houston area refineries, which
will open up additional markets
for our oil from the Permian
region and improve our
margins.
crude oil from West TX to
Houston area refineries, which
will open up additional markets
for our oil from the Permian
region and improve our
margins.
− Gas and CO2 processing plants
and pipelines to expand the
capacity of these facilities to
handle future production growth
and pipelines to expand the
capacity of these facilities to
handle future production growth
− A new chlor-alkali plant in the
chemical business.
chemical business.
27
Fourth Quarter 2012 Earnings -
Fourth Quarter 2012 Earnings -
2013 Capital Outlook
2013 Capital Outlook
• We are currently in an investing phase
in many of our businesses where a
higher than normal portion of our
capital is spent on longer-term projects.
in many of our businesses where a
higher than normal portion of our
capital is spent on longer-term projects.
• In 2013, we expect to spend ~25% of our
total capital expenditures on projects
that will make a significant contribution
to our earnings and cash flow over the
next several years.
total capital expenditures on projects
that will make a significant contribution
to our earnings and cash flow over the
next several years.
27
Fourth Quarter Earnings - Capital Spending
2012 Actual & 2013 Estimate
2012 Actual & 2013 Estimate
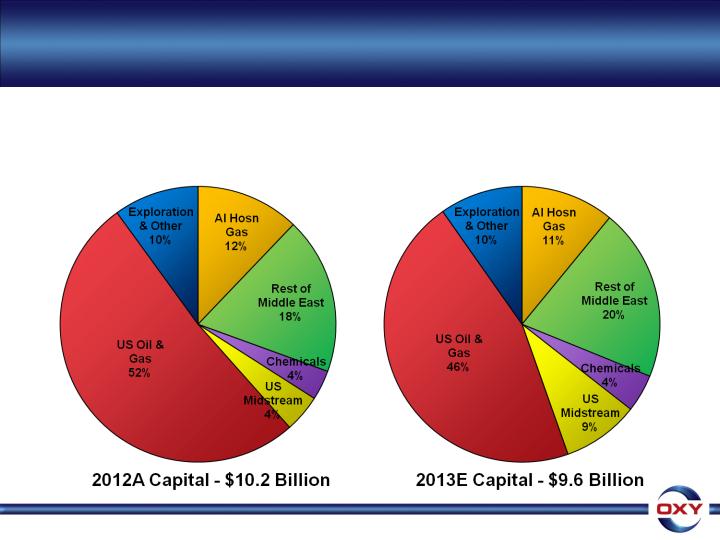
• Capital spending is expected to decline by ~6% in 2013 to
$9.6 billion from the $10.2 billion we spent in 2012.
$9.6 billion from the $10.2 billion we spent in 2012.
28
28

• Our overall capital spending is expected to decline by ~6%
in 2013 to $9.6 billion from the $10.2 billion we spent in 2012.
in 2013 to $9.6 billion from the $10.2 billion we spent in 2012.
• The reduction in capital will come entirely from the oil and
gas business where the 4Q12 spend rate was already close
to the level planned for all of 2013.
gas business where the 4Q12 spend rate was already close
to the level planned for all of 2013.
– Almost all of the reductions will be made in domestic operations.
– Midstream capital spending will increase mainly for the BridgeTex
pipeline.
pipeline.
• The 2013 program breakdown is expected to be about 75% in
Oil and Gas, 11% in the Al Hosn gas project, 9% in the
domestic Midstream and the remainder in Chemical.
Oil and Gas, 11% in the Al Hosn gas project, 9% in the
domestic Midstream and the remainder in Chemical.
Fourth Quarter 2012 Earnings -
Fourth Quarter 2012 Earnings -
2013 Capital Outlook
2013 Capital Outlook
29
29
64
Fourth Quarter 2012 Earnings -
2013 Capital Outlook - Domestic Oil & Gas
55
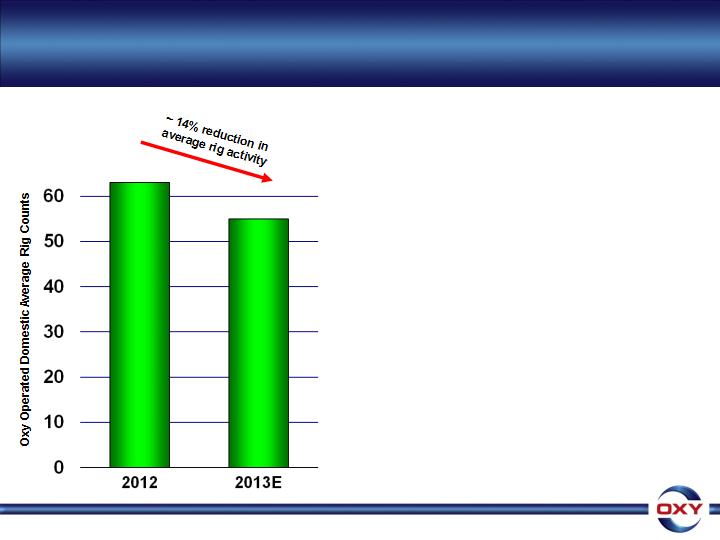
• In domestic oil and gas,
development capital will be
about 46% of our total capital
program.
development capital will be
about 46% of our total capital
program.
– We expect our average operated rig
count in the United States to be about
55 rigs during 2013 compared to 64
rigs in 2012.
count in the United States to be about
55 rigs during 2013 compared to 64
rigs in 2012.
– We have eliminated our less
productive rigs to improve our returns.
productive rigs to improve our returns.
• Our total domestic oil and gas
capital is expected to decrease
~$900 million compared to 2012.
capital is expected to decrease
~$900 million compared to 2012.
30
30

• Permian capital should remain flat.
• We expect to reduce California capital about $500 million
from 2012, which represents ongoing well cost reductions
and efficiencies, a modest shift toward more conventional
drilling opportunities and the constraints of the current
environment.
from 2012, which represents ongoing well cost reductions
and efficiencies, a modest shift toward more conventional
drilling opportunities and the constraints of the current
environment.
• To improve the efficiency of our capital spending in
California, we have planned our 2013 program level based
on what we know we can execute with our existing and
conservatively anticipated permits.
California, we have planned our 2013 program level based
on what we know we can execute with our existing and
conservatively anticipated permits.
• We may revise our program during the course of the year
if we can gain more certainty about the environment.
if we can gain more certainty about the environment.
31
Fourth Quarter 2012 Earnings -
2013 Capital Outlook - Domestic Oil & Gas
31

• In the Midcontinent, we expect to reduce spending about
$400 million from 2012.
$400 million from 2012.
• We have reduced our activity in higher cost unconventional
oil plays, specifically in the Williston and in lower return gas
properties, mainly in the Midcontinent and Rockies.
oil plays, specifically in the Williston and in lower return gas
properties, mainly in the Midcontinent and Rockies.
• The modest decline in rig levels, combined with well cost
reductions, will lead to a decline in overall U.S. oil and gas
capital spending compared with 2012.
reductions, will lead to a decline in overall U.S. oil and gas
capital spending compared with 2012.
• However, as a result of planned efficiencies we expect to
drill a similar number of wells as we did in 2012.
drill a similar number of wells as we did in 2012.
• Compared to the 2012 split, we will spend a higher percentage
of our 2013 capital on oil projects, and as a result we expect
our U.S. oil production to continue to grow this year.
of our 2013 capital on oil projects, and as a result we expect
our U.S. oil production to continue to grow this year.
32
Fourth Quarter 2012 Earnings -
2013 Capital Outlook - Domestic Oil & Gas
32

• Our total Al Hosn gas project capital will decline modestly
from the 2012 levels, and will make up about 11% of our
total capital program for the year.
from the 2012 levels, and will make up about 11% of our
total capital program for the year.
• While Iraq’s spending levels continue to be difficult to predict
reliably, capital in the rest of the Middle East region is
expected to be comparable to the 2012 levels.
reliably, capital in the rest of the Middle East region is
expected to be comparable to the 2012 levels.
• Exploration capital should decrease about 15% from the 2012
spending levels and represent about 5% of the total capital
program.
spending levels and represent about 5% of the total capital
program.
– The focus of the program domestically will be in the Permian basin and California, with
additional international drilling in Oman.
additional international drilling in Oman.
33
Fourth Quarter 2012 Earnings -
2013 Capital Outlook - International & Exploration
33

• The U.S. Midstream capital will increase by about $400 million
due to the BridgeTex pipeline project.
due to the BridgeTex pipeline project.
• Chemical segment capital will be about $425 million, which
includes the construction of a new 182,500 ton per year
membrane chlor-alkali plant in New Johnsonville, Tennessee
that we expect will start operating in 4Q13.
includes the construction of a new 182,500 ton per year
membrane chlor-alkali plant in New Johnsonville, Tennessee
that we expect will start operating in 4Q13.
34
Fourth Quarter 2012 Earnings -
2013 Capital Outlook - Chemical & Midstream
34

35
Fourth Quarter 2012 Earnings - Summary
Fourth Quarter 2012 Earnings - Summary
• Assuming similar realized oil and gas prices to 2012 and our
expectation of comparable chemical and midstream segment
earnings, we expect that our 2013 program will:
expectation of comparable chemical and midstream segment
earnings, we expect that our 2013 program will:
− Generate cash flow from operations of about $12.7 billion; and
− Invest about $9.6 billion in capital spending.
• In 2012, we returned $2.3 billion in total cash to shareholders,
in the form of dividends and share repurchases, excluding the
4Q12 accelerated payout.
in the form of dividends and share repurchases, excluding the
4Q12 accelerated payout.
• Our dividends (excluding the 4Q12 accelerated payout) were
$1.7 billion.
$1.7 billion.
– We expect this amount to increase in 2013, on an annualized basis, by an
amount comparable to our recent dividend growth rate.
amount comparable to our recent dividend growth rate.
• We expect that a $5 p/bbl change in our realized oil prices will
change cash flow from operations by about $450 million.
change cash flow from operations by about $450 million.
35

Fourth Quarter 2012 Earnings Conference Call
Q&A
36