Attached files
| file | filename |
|---|---|
| 8-K - FORM 8-K - Blackstone Group Inc | d475721d8k.htm |
| EX-99.1 - PRESS RELEASE OF THE BLACKSTONE GROUP L.P. - Blackstone Group Inc | d475721dex991.htm |
 Blackstone’s Full Year and Fourth Quarter
2012 Earnings
January 31, 2013
Exhibit 99.2 |
 Blackstone
1
Blackstone’s Full Year and Fourth Quarter 2012 Highlights
Economic
Net
Income
(“ENI”)
was
up
30%
in
2012
to
nearly
$2
billion,
or
$1.77
per
unit,
the
highest
full
year total since going public, on strong revenue growth to over
$4 billion.
•
Fourth
quarter
ENI
of
$670
million
was
driven
by
sustained
performance
in
Real
Estate
and
strong
growth
in
Private
Equity,
Credit
and
Hedge
Fund
Solutions,
as
valuation
gains
and
realization
activity
increased considerably.
GAAP
Revenues
were
$4
billion
for
the
year
while
GAAP
Net
Income
was
$219
million
due
to certain non-
cash IPO and transaction related expenses and the exclusion of net income
attributable to insiders. Distributable
Earnings
(“DE”)
surged
48%
in
2012
to
over
$1
billion,
or
$0.85
per
common
unit,
on
a sharp
increase in Fee Related Earnings (“FRE”) and an improving environment
for Realized Performance Fees across all of Blackstone’s investment
businesses. •
Full year Fee Related Earnings of $700 million were up 28% from 2011 on continued
strong inflows which drove Base Management Fees up 24% to $1.6 billion,
Blackstone’s best ever full year total. •
Full
year
Realized
Performance
Fees
of
$629
million
were
up
176%
from
2011,
as
market
levels
and
fund
performance created realization opportunities across the investment
businesses. Total AUM reached a record $210 billion, up $44 billion or 26%
from the prior year, as all of Blackstone’s investment businesses
continued to see net inflows and carrying value appreciation. •
Full year gross inflows were $47 billion including $19 billion in new fund
strategies as Blackstone innovated more ways to find and create fund
investor value. •
Total capital invested was $15.6 billion in 2012, the second highest full year
total in Blackstone’s history. •
Blackstone’s funds returned $18.5 billion of capital to investors during the
year. |
 Blackstone
2
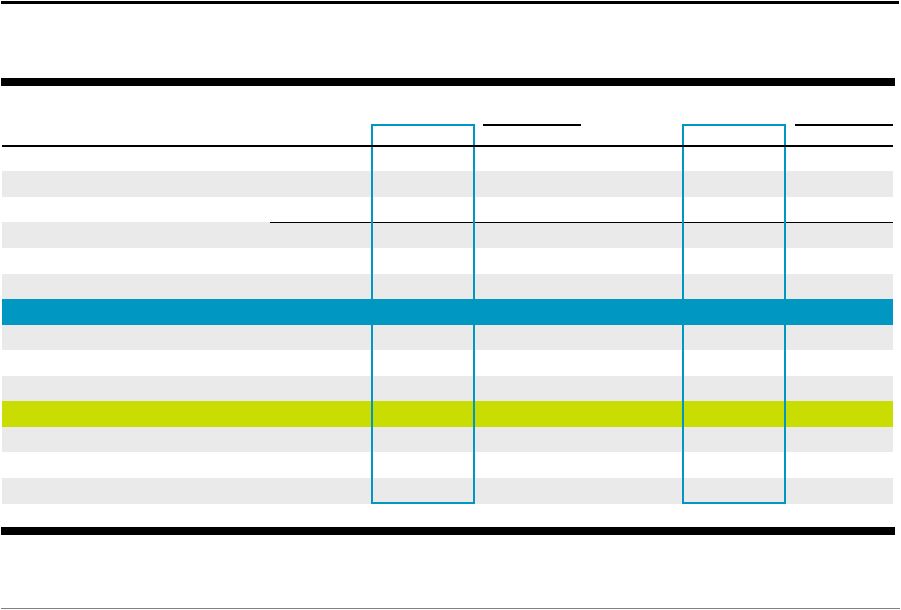
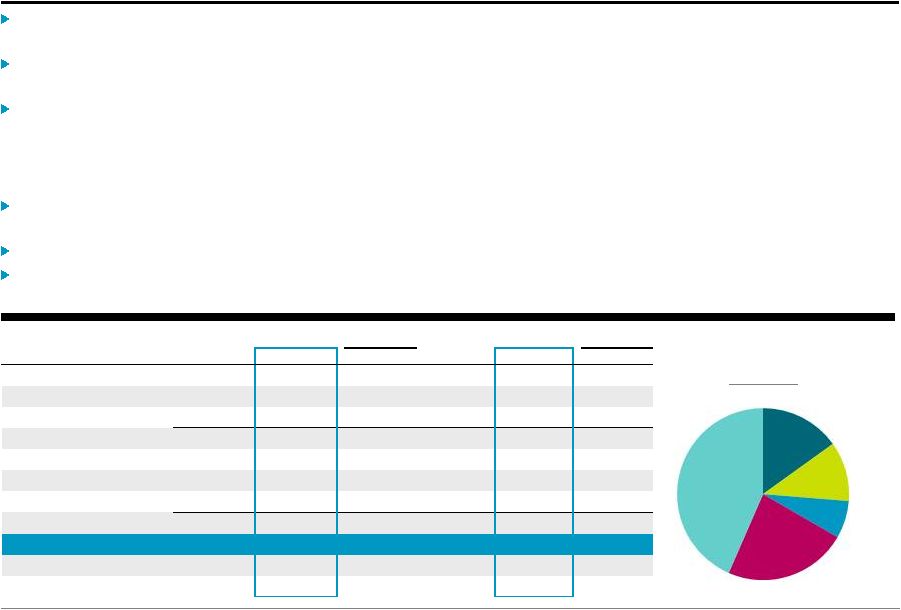
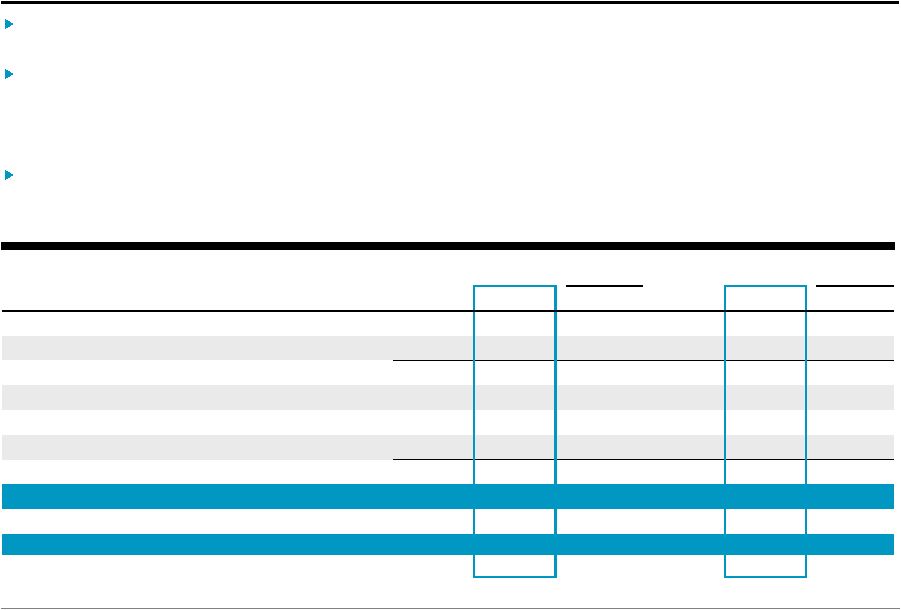
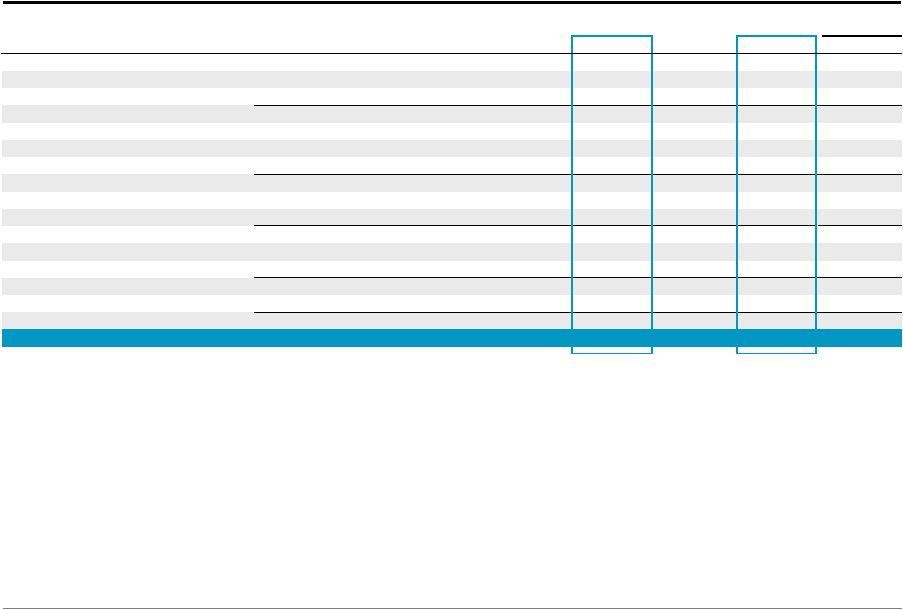
Blackstone’s Fourth Quarter and Full Year 2012 Earnings
(a)
(b)
(c)
% Change
% Change
(Dollars in Thousands, Except per Unit Data)
4Q'11
4Q'12
vs. 4Q'11
FY'11
FY'12
vs. FY'11
Fee Revenues
511,335
$
646,903
$
27%
1,923,804
$
2,186,765
$
14%
Performance Fees
357,950
470,173
31%
1,174,526
1,593,765
36%
Investment Income
55,725
111,670
100%
185,264
286,244
55%
Total Revenues
925,010
$
1,228,746
$
33%
3,283,594
$
4,066,774
$
24%
Total Expenses
442,238
542,733
23%
1,698,623
2,025,767
19%
Taxes
14,618
16,032
10%
45,763
45,708
(0)%
Economic Net Income ("ENI")
(a)
468,154
$
669,981
$
43%
1,539,208
$
1,995,299
$
30%
ENI per Unit
(b)
0.42
$
0.59
$
40%
1.38
$
1.77
$
28%
GAAP Net Income (Loss)
(22,677)
$
106,413
$
n/m
(168,303)
$
218,598
$
n/m
Fee Related Earnings ("FRE")
166,096
$
272,604
$
64%
546,493
$
700,313
$
28%
Distributable Earnings ("DE")
178,186
$
493,765
$
177%
696,724
$
1,033,925
$
48%
DE per Common Unit
(c)
0.16
$
0.39
$
144%
0.60
$
0.85
$
42%
Total Assets Under Management
166,228,504
$
210,219,960
$
26%
166,228,504
$
210,219,960
$
26%
Fee-Earning Assets Under Management
136,756,753
$
167,880,440
$
23%
136,756,753
$
167,880,440
$
23%
Economic Net Income, a segment measure, has been redefined as Economic Income after current
taxes (“Taxes”); it no longer deducts the implied provision for income taxes.
ENI per Unit is based on the Weighted-Average ENI Adjusted Units.
DE per Common Unit equals DE Attributable to Common Unitholders divided by Total GAAP Common
Units Outstanding. Note: Prior period amounts on all pages have been adjusted to conform
to the current period presentation and definitions. See Appendix – Definitions. |
 Blackstone
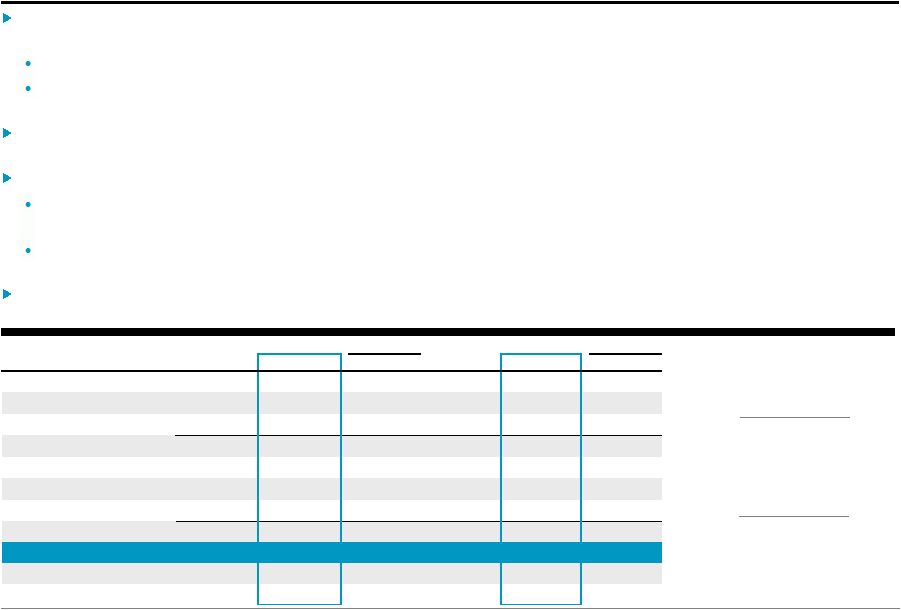
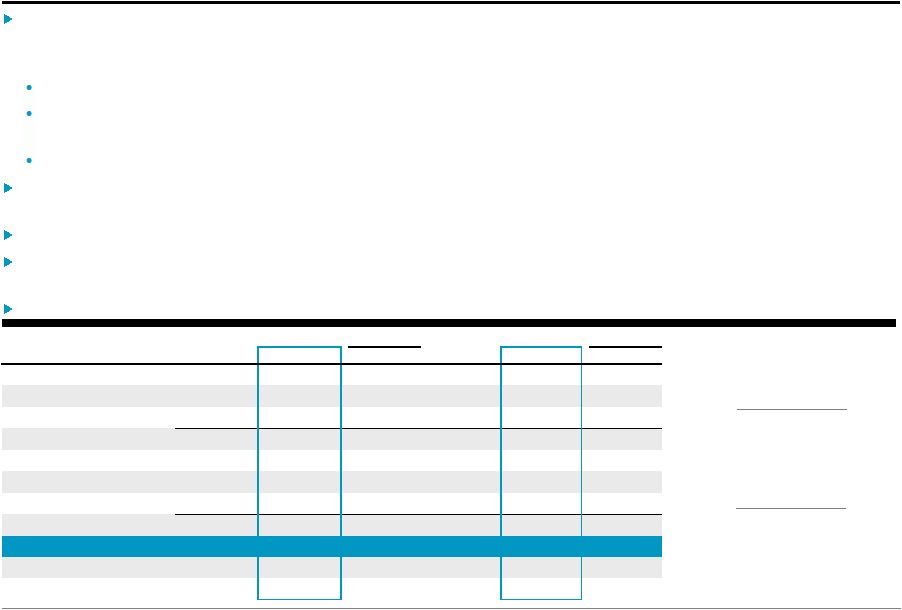
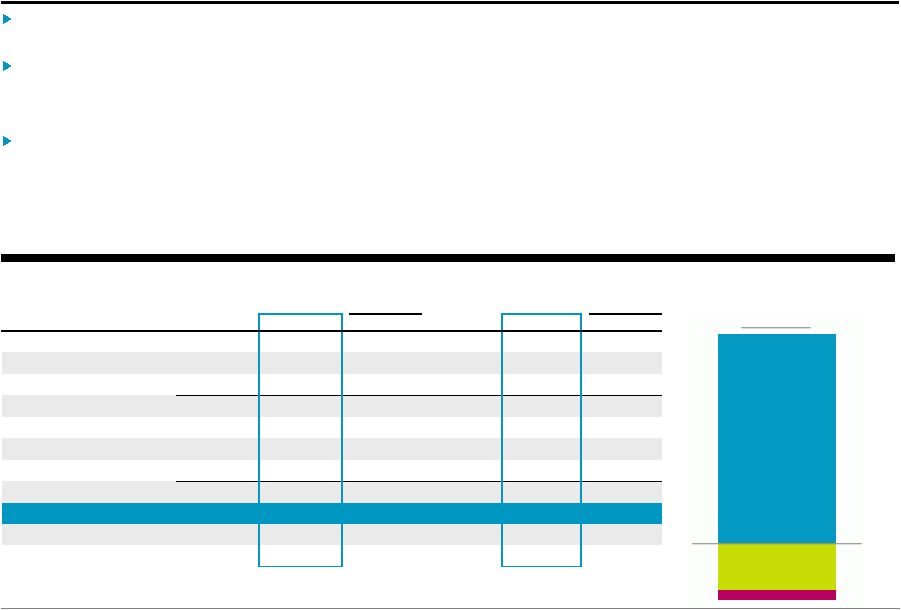
3
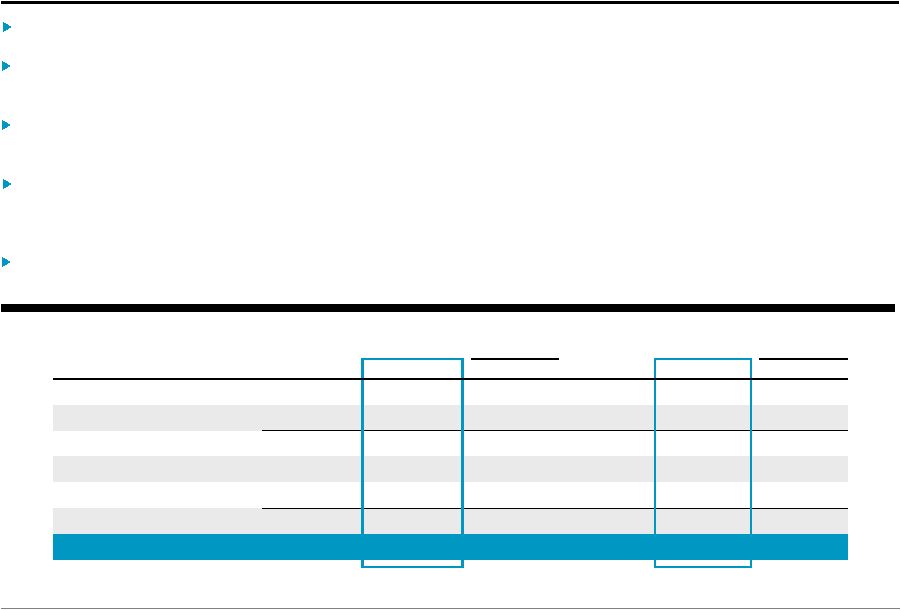
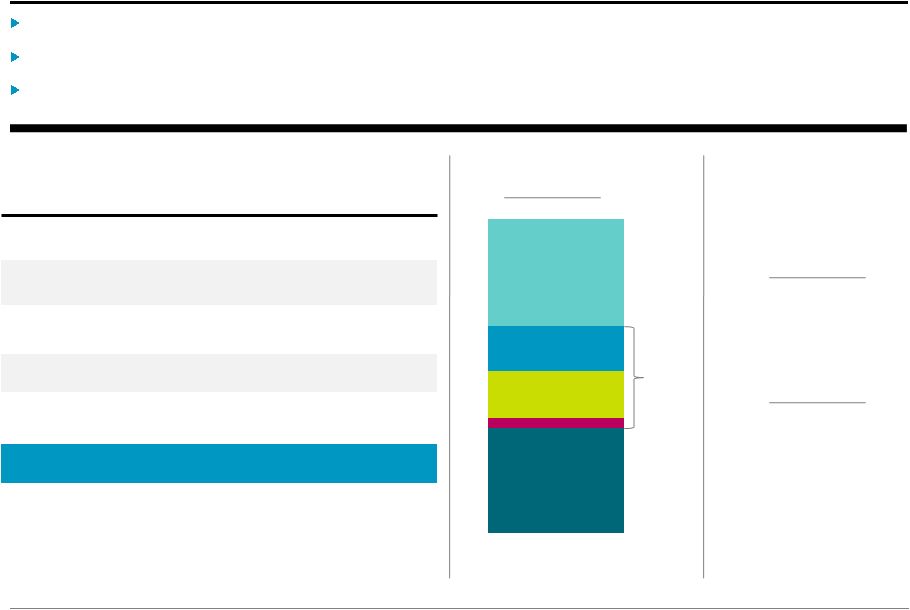
Walkdown of Financial Metrics
4Q'12
FY'12
(Dollars in Thousands, Except per Unit Data)
Results
Per Unit
(a)
Results
Per Unit
(a)
Base Management Fees
416,465
$
1,591,403
$
Advisory Fees
128,248
357,417
Transaction and Other Fees, Net
94,069
227,119
Management Fee Offsets
(11,476)
(40,953)
Interest Income and Other Revenue
24,287
77,548
Compensation
(247,559)
(1,030,776)
Other Operating Expenses
(131,430)
(481,445)
Fee Related Earnings
272,604
$
0.24
$
700,313
$
0.62
$
Net Realized Incentive Fees
147,115
161,422
Net Realized Carried Interest
115,595
230,989
Net Realized Investment Income
31,004
73,526
Taxes and Related Payables
(72,553)
(132,325)
Distributable Earnings
493,765
$
0.39
$
1,033,925
$
0.85
$
Net Unrealized Incentive Fees
(92,542)
15,217
Net Unrealized Carried Interest
136,261
672,591
Net Unrealized Investment Income
75,976
186,949
Add Back: Related Payables
56,521
86,617
Economic Net Income
669,981
$
0.59
$
1,995,299
$
1.77
$
See Appendix - Calculation of Certain Non-GAAP Financial Metric Components for the
calculation of the amounts presented herein that are not the respective captions from the
Total Segment information.
(a)
Fee Related Earnings per Unit is based on DE Units Outstanding; DE per Unit equals DE per
Common Unit; and ENI per Unit is based on Weighted-Average ENI Adjusted Units (See
Appendix - Unit Rollforward). |
 Blackstone
4
Private Equity
14.3%
FY’12
Increase
in
Fund
Carrying
Value
(a)
$644 million
Net Accrued Performance Fees at 4Q’12
11%
2012 Increase in Total AUM
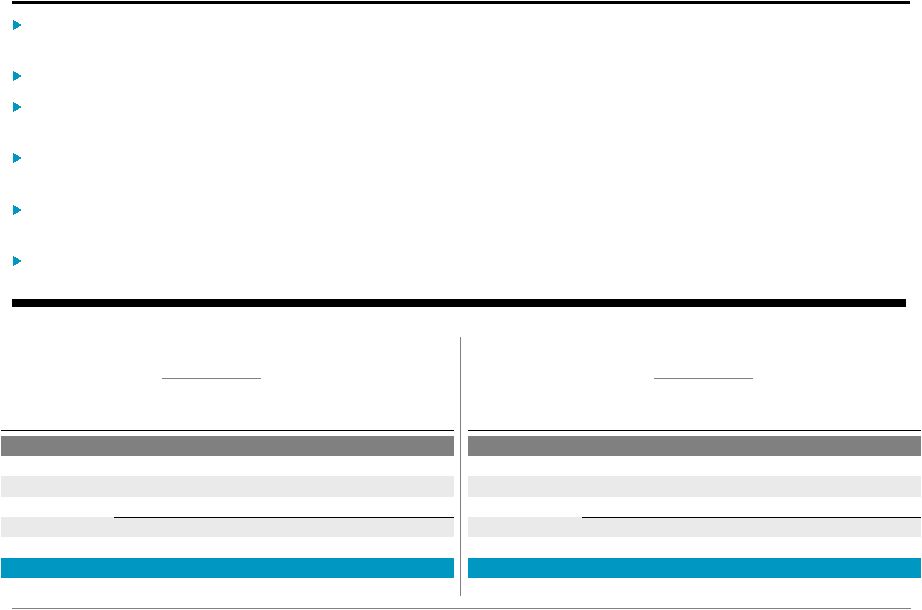
Revenues were up 43% to $828 million in 2012 driven by sharp increases in
Performance Fees and Investment Income, resulting in $412 million of
Economic Income, up 71% from 2011. Overall
carrying
value
of
segment
portfolio
assets
(a)
was
up
7.0%
for
the
quarter
and
14.3%
for
the
full
year.
Public holdings appreciated 9.6% for the quarter while private holdings increased
6.0% driven by operating performance
in
the
energy
and
hospitality/leisure
sectors
of
the
portfolios.
Invested $1.9 billion of total capital with an additional $611 million committed
but not yet invested during the quarter, bringing the full year total
capital invested and committed to $5.0 billion, up 9% from 2011 levels.
Returned
$3.5
billion
to
investors
during
the
year
at
an
average
2.1x
Multiple
of
Invested
Capital
(“MOIC”).
Exits occurred through public markets, strategic sales and recapitalizations, as
the environment for exits at attractive valuations continued to
improve. Completed successful initial public offering of PBF Energy at a
robust valuation of 4.7x invested capital as well as a number of secondary
sales in TeamHealth at an average MOIC of 3.9x. Total Assets Under
Management reached a record $51 billion, reflecting the final close for our first energy fund and
closings for our tactical opportunities investment vehicles, which have raised
$1.7 billion through year end. % Change
% Change
(Dollars in Thousands)
4Q'11
4Q'12
vs. 4Q'11
FY'11
FY'12
vs. FY'11
Fee Revenues
106,897
$
134,857
$
26%
453,487
$
458,721
$
1%
Performance Fees
55,385
118,968
115%
70,883
258,178
264%
Investment Income
28,603
64,856
127%
54,464
111,160
104%
Total Revenues
190,885
318,681
67%
578,834
828,059
43%
Compensation
45,611
53,963
18%
217,556
222,709
2%
Performance Fee Compensation
4,094
26,145
n/m
(764)
62,234
n/m
Other Operating Expenses
34,493
40,499
17%
120,918
130,845
8%
Total Expenses
84,198
120,607
43%
337,710
415,788
23%
Economic Income
106,687
$
198,074
$
86%
241,124
$
412,271
$
71%
Total AUM
45,863,673
$
51,002,973
$
11%
45,863,673
$
51,002,973
$
11%
Fee-Earning AUM
37,237,791
$
37,050,167
$
(1)%
37,237,791
$
37,050,167
$
(1)%
(a)
BCP portfolio, BCOM, BEP, Tactical Opportunities and Other Funds (including fee-paying
co-invest). |
 Blackstone
5
Real Estate
14.4%
FY’12
Increase
in
Fund
Carrying
Value
(a)
$1.3 billion
Net Accrued Performance Fees at 4Q’12
32%
2012 Increase in Total AUM
(a)
BREP portfolio (including fee-paying co-invest).
(b)
Excludes Capital Trust drawdown funds.
(c)
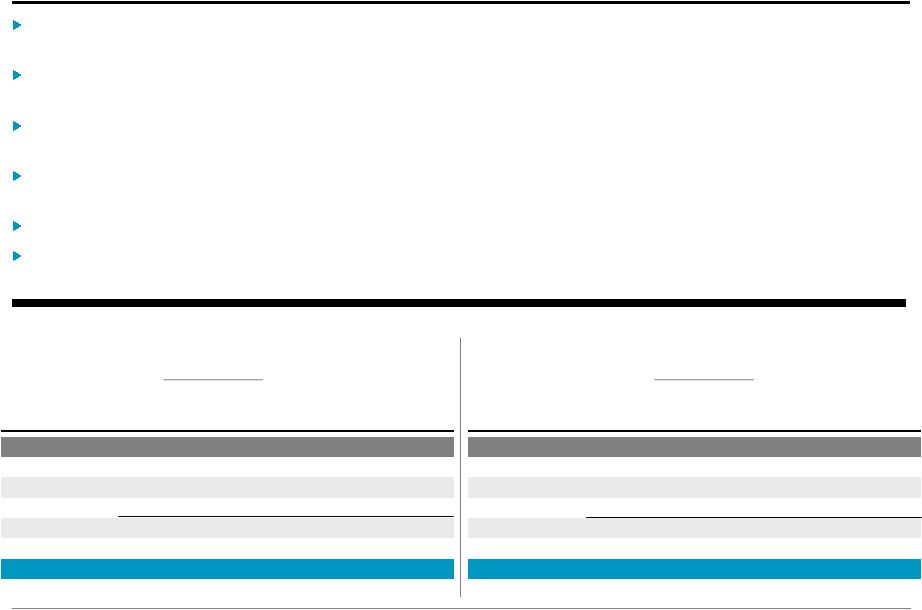
Revenues for the year were up 3% from 2011 driven by a 22% increase in Fee
Revenues resulting primarily from Base
Management
Fees
generated
by
the
final
close
for
our
latest
global
fund,
which
reached
$13.3
billion
in
total
fund commitments.
BREP investments
(a)
were up 3.7% for the quarter and 14.4% for the full year.
Debt
Strategies
drawdown
funds
(b)
were
up
2.9%
for
the
quarter
and
13.0%
for
the
full
year,
while
the
credit
hedge funds were up 3.7% for the quarter and 18.1% for the full year.
Performance fees were $874 million for the year generated primarily by BREP V,
VI, VII and BREP Europe III. Invested $8.5 billion of total capital during
the year with an additional $923 million committed but not yet invested at
the end of 2012, bringing the full year total capital invested and committed to a record $9.4 billion.
Returned $1.7 billion of capital to investors during the quarter, bringing the
full year amount to over $3.7 billion. Completed the acquisition of Capital
Trust’s investment management business, adding an experienced team with
expertise
in
debt
origination
and
special
servicing,
as
well
as
$2.3
billion
of
Total
AUM
as
of
year
end.
Total Assets Under Management rose 32% during the year to a record $56.7
billion. % Change
% Change
(Dollars in Thousands)
4Q'11
4Q'12
vs. 4Q'11
FY'11
FY'12
vs. FY'11
Fee Revenues
122,639
$
167,924
37%
511,179
$
623,736
$
22%
Performance Fees
243,430
201,527
(17)%
949,549
874,415
(8)%
Investment Income
26,316
34,442
31%
120,620
136,177
13%
Total Revenues
392,385
403,893
3%
1,581,348
1,634,328
3%
Compensation
53,507
54,201
1%
236,771
271,122
15%
Performance Fee Compensation
59,038
66,727
13%
238,913
240,377
1%
Other Operating Expenses
29,027
36,946
27%
103,859
123,714
19%
Total Expenses
141,572
157,874
12%
579,543
635,213
10%
Economic Income
250,813
$
246,019
$
(2)%
1,001,805
$
999,115
$
(0)%
Total AUM
42,852,669
$
56,695,645
$
32%
42,852,669
$
56,695,645
$
32%
Fee-Earning AUM
31,236,540
$
41,931,339
$
34%
31,236,540
$
41,931,339
$
34%
(c)
FY’11 Performance Fees included $248 million due to the impact of the profit allocation
“catch-up” provisions for BREP V and VI. |
 Blackstone
6
Hedge Fund Solutions
$24 billion
4Q’12 Incentive Fee-Earning AUM
(b)
Revenues were up 36% for the year driven by a substantial increase in Performance
Fees due to strong fund performance as investors sought stable
risk-adjusted returns. Composite returns
(a)
were up 2.2% net for the quarter and up 8.6% net for the full year.
•
As of year-end, $18.6 billion or 78% of Incentive Fee-Earning AUM was
estimated above its respective High Water
Mark
and/or
Hurdle,
up
from
just
$1.6
billion
or
8%
a
year
ago.
Fee-Earning AUM grew 15% during the year to a record $43.5 billion, driven by
strong net inflows into customized investment products and market
appreciation. •
51% is currently invested in customized portfolios up from 39% five years
ago. •
Fee-Earning net inflows were $2.4 billion for the year.
•
January
1
subscriptions
of
$370
million
are
not
included
in
year-end
Fee-Earning
AUM.
(a)
Represents the BAAM Composite which is the asset-weighted performance of BAAM’s
investments, net of all fees, excluding BAAM's long-only platforms, seed funds and
advisory relationships.
(b)
Represents currently invested incentive fee eligible AUM above or below High Water Mark or
Relevant Benchmark. Totals may not add due to rounding. Above
HWM /
Hurdle
0-5% Below
> 5% Below
% Change
% Change
(Dollars in Thousands)
4Q'11
4Q'12
vs. 4Q'11
FY'11
FY'12
vs. FY'11
Fee Revenues
90,029
$
96,801
$
8%
327,608
$
350,939
$
7%
Performance Fees
2,089
36,524
n/m
12,246
92,475
n/m
Investment Income (Loss)
(750)
3,784
n/m
(1,309)
15,787
n/m
Total Revenues
91,368
137,109
50%
338,545
459,201
36%
Compensation
38,525
28,113
(27)%
128,959
119,731
(7)%
Performance Fee Compensation
(177)
9,766
n/m
3,732
24,397
n/m
Other Operating Expenses
21,568
16,491
(24)%
65,072
57,809
(11)%
Total Expenses
59,916
54,370
(9)%
197,763
201,937
2%
Economic Income
31,452
$
82,739
$
163%
140,782
$
257,264
$
83%
Total AUM
40,534,768
$
46,092,505
$
14%
40,534,768
$
46,092,505
$
14%
Fee-Earning AUM
37,819,636
$
43,478,791
$
15%
37,819,636
$
43,478,791
$
15%
$0.9B / 4%
$4.2B / 18%
$18.6B / 78%
st |
 Blackstone
7
Credit
$56 billion
4Q’12 Total AUM
Customized
Credit Strategies
(c)
Rescue
Lending
Mezzanine
Funds
Hedge Fund
Strategies
CLOs
Economic Income for the year was up 130% to a record $325 million reflecting
substantial increases in Fee Revenues and Performance Fees as inflows and
returns continued to outperform the market. Total AUM grew 53% during the
year to a record $56.4 billion, driven by new product launches, strong net
inflows, market appreciation and the Harbourmaster acquisition in the first
quarter. Fund returns remained strong across the platform:
•
Hedge Funds
(a)
were up 3.8% net for the quarter and 13.4% net for the full year.
•
Mezzanine Funds
(a)
were up 7.3% net for the quarter and 26.2% net for the full year.
•
Rescue Lending Funds
(a)
were up 3.1% net for the quarter and 15.7% net for the full year.
Invested
$349
million
of
total
capital
with
an
additional
$566
million
committed
but
not
yet
invested
in
4Q’12,
bringing 2012 total capital invested and committed to $3.5 billion as deployment
opportunities remained strong. Priced
third
CLO
of
the
year
at
$515
million,
bringing
full
year
CLO
AUM
raised
to
nearly
$1.6
billion.
Held
first
close
for
our
most
recent
rescue
lending
fund
with
$2.5
billion
(b)
at
year-end
and
closed
on
an
additional
$810 million in January.
% Change
% Change
(Dollars in Thousands)
4Q'11
4Q'12
vs. 4Q'11
FY'11
FY'12
vs. FY'11
Fee Revenues
66,919
$
117,081
$
75%
242,553
$
389,304
$
61%
Performance Fees
57,046
113,154
98%
141,848
368,697
160%
Investment Income
1,144
8,043
n/m
10,591
20,380
92%
Total Revenues
125,109
238,278
90%
394,992
778,381
97%
Compensation
25,435
51,853
104%
128,588
182,077
42%
Performance Fee Compensation
31,773
61,106
92%
74,831
186,538
149%
Other Operating Expenses
13,162
18,116
38%
49,955
84,488
69%
Total Expenses
70,370
131,075
86%
253,374
453,103
79%
Economic Income
54,739
$
107,203
$
96%
141,618
$
325,278
$
130%
Total AUM
36,977,394
$
56,428,837
$
53%
36,977,394
$
56,428,837
$
53%
Fee-Earning AUM
30,462,786
$
45,420,143
$
49%
30,462,786
$
45,420,143
$
49%
$24.5
$8.5
$6.3
$4.0
$13.1
Totals may not add due to rounding. (a) Represents weighted average returns for the onshore and offshore
funds (if applicable) for the respective flagship funds.
(b)
Represents total commitments, which are included in Total AUM as of year end 2012, but none of
which are included in Fee-Earning AUM.
(c)
Includes business development companies (“BDCs”), closed-end funds, commingled
funds and separately managed accounts. |
 Blackstone
8
Financial Advisory
Collectively, the firm’s advisory businesses outperformed the broader market
which saw sharp declines in 2012. Revenues for the quarter were up 4% from
the same period a year ago and were down 6% for the year primarily from
delays in deal closings, particularly in our Park Hill placement services business, despite a steady backlog.
Restructuring
kept
its
#1
ranking
for
U.S.
completed
restructurings
(a)
,
earned
2012
revenue
above
2011
levels
and
won the prestigious 2012 International Financing Review award for Restructuring
House of the Year. Blackstone Advisory Partners had a record level of
revenue in the fourth quarter driven by a significant number of
transaction
closings
prior
to
year end.
Overall,
2012
revenue
was
modestly
lower
vs.
2011,
however
the
2013
pipeline for deal activity is higher than the same time last year with several
high profile mandates in process. Park Hill’s pipeline remains solid
as challenging fundraising market conditions are driving demand for placement
services; revenues were down year-over-year reflecting timing more than
recurring activity levels. (a)
Source: 2012 Thomson Reuters U.S. Distressed Debt & Bankruptcy Restructuring
Rankings. % Change
% Change
(Dollars in Thousands)
4Q'11
4Q'12
vs. 4Q'11
FY'11
FY'12
vs. FY'11
Fee Revenues
124,851
$
130,240
$
4%
388,977
$
364,065
$
(6)%
Investment Income
412
545
32%
898
2,740
205%
Total Revenues
125,263
130,785
4%
389,875
366,805
(6)%
Compensation
62,360
59,429
(5)%
248,695
235,137
(5)%
Other Operating Expenses
23,822
19,378
(19)%
81,538
84,589
4%
Total Expenses
86,182
78,807
(9)%
330,233
319,726
(3)%
Economic Income
39,081
$
51,978
$
33%
59,642
$
47,079
$
(21)% |
 Blackstone
9
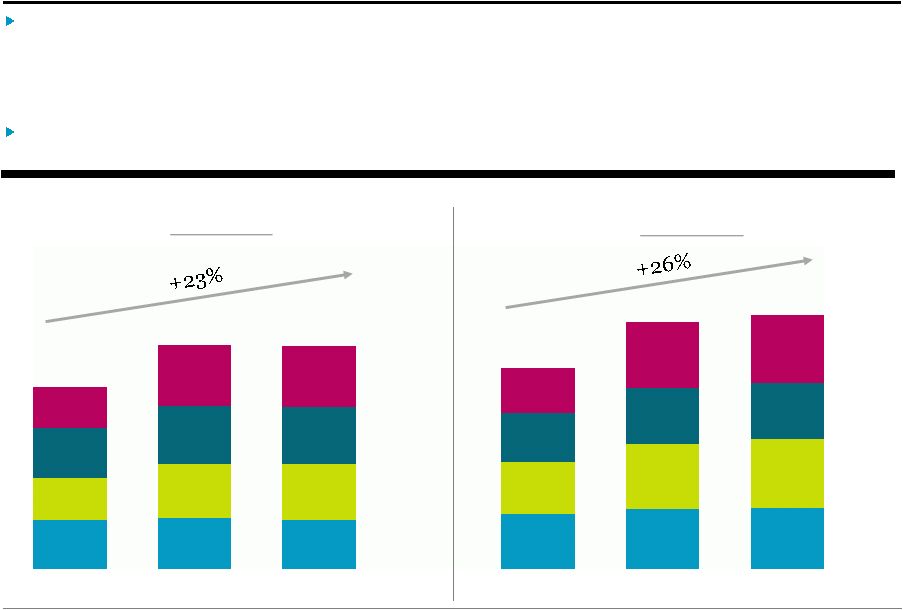
Assets Under Management
Fee-Earning
AUM
was
up
23%
in
2012
to
$168
billion,
as
$42.7
billion
of
gross
inflows
and
$4.8
billion
of
market
appreciation more than offset $16.4
billion of outflows and realizations.
•
Including
commitments,
not
yet
earning
fees,
Fee-Earning
AUM
was
$180
billion,
up
32%
from
2011.
•
The
slight
decrease
from
last
quarter
end
was
driven
primarily
by
an
increase
in
realization
activity.
Total
AUM
increased
26%
in
2012
to
a
record
$210
billion
driven
by
strong
organic
net
inflows
and
market
appreciation
across
all
investment
businesses,
each
of
which
are
at
or
near
record
levels
of
AUM.
Fee-Earning AUM by Segment
$136.8
$168.6
$167.9
Total AUM by Segment
$166.2
$204.6
$210.2
Credit
Hedge Fund
Solutions
Real
Estate
Private
Equity
Credit
Hedge Fund
Solutions
Real
Estate
Private
Equity
Totals may not add due to rounding.
$37.2
$38.5
$37.1
$31.2
$40.6
$
41.9
$37.8
$43.6
$43.5
$30.5
$45.9
$45.4
4Q'11
3Q'12
4Q'12
$45.9
$50.2
$51.0
$42.9
$53.5
$56.7
$40.5
$46.2
$46.1
$37.0
$54.6
$56.4
4Q'11
3Q'12
4Q'12
(Dollars in Billions)
(Dollars in Billions) |
 Blackstone
10
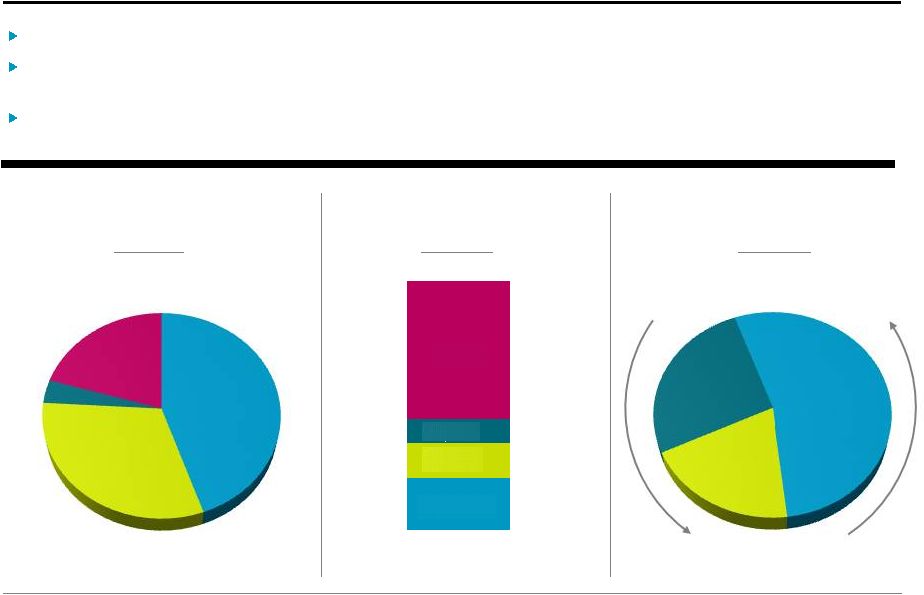
4Q’12 Available Capital Summary
$35 billion Dry Powder
(a)
Credit
Hedge Fund
Solutions
Private
Equity
Real
Estate
Currently Earning
Performance Fees
Invested/Committed Not Yet
Earning Performance Fees
To Be Invested
$12 billion Not Yet Earning
Base Management Fees
(b)
$127 billion Performance
Fee Eligible AUM
(c)
Maintained
substantial
levels
of
committed
undrawn
capital
(“dry
powder”)
with
$35
billion
at
year
end.
$12 billion of Total AUM was not yet earning Base Management Fees at year end due
largely to fund structures with fees that are triggered by the investment
of capital. Performance Fee Eligible AUM was $127 billion at year end,
including over $68 billion ($81 billion at fair value) currently earning
Performance Fees. Credit
Hedge Fund
Solutions
Real
Estate
Private
Equity
$15.7
$11.0
$1.3
$7.2
$68.3
$25.3
$33.7
$1.8
$6.9
$1.2
$2.6
(a)
Represents illiquid drawdown funds only; excludes marketable vehicles; includes both
Fee-Earning (third party) capital and GP/employee commitments which do not earn fees. Amounts reduced by
outstanding commitments to invest, but for which capital has not been called.
(b)
Represents (i) committed uninvested capital of our Private Equity and Real Estate drawdown
funds with closed investment periods, and (ii) committed uninvested capital for our Real Estate debt
strategies drawdown funds, our Credit Mezzanine and Rescue Lending funds and our Hedge Fund
Solutions Strategic Alliance Fund. (c)
Represents invested and to be invested capital, including closed commitments for funds whose
investment period has not yet commenced, on which performance fees could be earned if certain
hurdles are met.
|
 Blackstone
11
Distribution Calculation
Earned $0.39 of Distributable Earnings per common unit during the fourth quarter,
bringing full year Distributable Earnings to $0.85 per common unit, up 42%
year-over-year. Declared a quarterly distribution of $0.42 per
common unit to record holders as of February 11, 2013; payable on February
19, 2013. •
Quarterly
record
and
payment
dates
reflect
a
timing
acceleration
relative
to
historic
practice,
which
will
be
effective prospectively.
For 2013, Blackstone intends to increase its base quarterly distribution to $0.12
per unit, up 20% from $0.10 per unit. Any excess Net Cash Available for
Distribution to Common Unitholders will also be distributed each quarter
as earned.
(a)
(a)
A detailed description of Blackstone’s distribution policy can be found in Appendix
– Distribution Policy.
(b)
DE before Certain Payables represents Distributable Earnings before the deduction for Payable
under the Tax Receivable Agreement and tax expense (benefit) of wholly-owned subsidiaries.
(c)
Per Unit calculations are based Total Common Units Outstanding (see Appendix – Unit
Rollforward); actual distributions are paid to applicable unitholders as of the record date.
(d)
Retained capital is withheld pro-rata from common and Blackstone Partnership
unitholders. Common unitholders’ share was $26.8 million for 4Q’12 and $68.5 million for the full year.
% Change
% Change
(Dollars in Thousands, Except per Unit Data)
4Q'11
4Q'12
vs. 4Q'11
FY'11
FY'12
vs. FY'11
Distributable Earnings ("DE")
178,186
$
493,765
$
177%
696,724
$
1,033,925
$
48%
Add: Other Payables Attributable to Common Unitholders
5,859
61,237
n/m
30,154
91,633
204%
DE
before
Certain
Payables
(b)
184,045
555,002
202%
726,878
1,125,558
55%
Percent to Common Unitholders
45%
51%
44%
49%
DE before Certain Payables Attributable to Common Unitholders
82,596
281,207
240%
317,656
550,360
73%
Less: Other Payables Attributable to Common Unitholders
(5,859)
(61,237)
n/m
(30,154)
(91,633)
(204)%
DE Attributable to Common Unitholders
76,737
219,970
187%
287,502
458,727
60%
DE
per
Common
Unit
(c)
0.16
$
0.39
$
144%
0.60
$
0.85
$
42%
Less:
Retained
Capital
per
Unit
(d)
(0.02)
$
(0.05)
$
(150)%
(0.08)
$
(0.13)
$
(63)%
Net
Cash
Available
for
Distribution
per
Common
Unit
(c)
0.14
$
0.34
$
143%
0.52
$
0.72
$
38%
Actual
Distribution
per
Common
Unit
(c)
0.22
$
0.42
$
91%
0.52
$
0.72
$
38% |
 Blackstone
12
Balance Sheet Highlights
(a)
At December 31, 2012, Blackstone had $2.3 billion in total cash and liquid
investments. In total, Blackstone had $6.7 billion or $5.95 per unit in cash
and investments at quarter end. There are currently no borrowings
outstanding against the $1.1 billion revolving credit facility. (a)
Preliminary, excludes the consolidated Blackstone funds. Totals
may not add due to rounding.
(b)
Primarily Blackstone investments in Hedge Fund Solutions and non-drawdown Credit.
(c)
Illiquids include Blackstone investments in all drawdown funds in Private Equity, Real Estate
and Credit. (d)
Senior notes of $600 million issued August 2009 maturing on August 15, 2019 (6.625% coupon),
$400 million issued September 2010 maturing on March 15, 2021 (5.875% coupon), $400 million issued August 2012 maturing on
February
15,
2023
(4.750%
coupon)
and
$250
million
issued
August
2012
maturing
on
August
15,
2042
(6.250%
coupon),
net
of
$15
million
held
by
Blackstone.
(Dollars in Millions)
4Q’12
Cash and Cash Equivalents
$
710
Treasury Cash Management Strategies
1,407
Liquid Investments
(b)
135
Illiquid Investments
(c)
2,186
Net Performance Fees
2,238
Total Net Value
$
6,676
Outstanding Bonds (at par)
(d)
$
1,635
A/A+
rated by S&P / Fitch
$1.1 billion
undrawn credit revolver
$2.3 billion
total cash and liquid investments
$5.95
Net Performance
Fees
Total Cash
and Liquids
Private Equity
Real Estate
Other
Cash and Investments per Unit
$1.95
Illiquids
$6.7 billion
Total Net Value
$1.99
$0.19
$0.92
$0.84
$2.01 |
 Blackstone
13
GAAP Statement of Operations
% Change
% Change
(Dollars in Thousands, Except per Unit Data) (Unaudited)
4Q'11
4Q'12
vs. 4Q'11
FY'11
FY'12
vs. FY'11
Revenues
Management and Advisory Fees, Net
475,779
$
601,860
$
26%
1,811,750
$
2,030,693
$
12%
Performance Fees
Realized Carried Interest
12,387
174,168
n/m
138,907
327,422
136%
Realized Incentive Fees
52,048
273,304
n/m
90,099
301,801
235%
Unrealized Carried Interest
311,162
207,639
(33)%
971,518
994,190
2%
Unrealized Incentive Fees
(17,495)
(185,372)
n/m
(17,864)
(30,361)
(70)%
Total Performance Fees
358,102
469,739
31%
1,182,660
1,593,052
35%
Investment Income
Realized
9,860
53,311
n/m
87,542
93,963
7%
Unrealized
55,665
74,325
34%
125,781
256,231
104%
Total Investment Income
65,525
127,636
95%
213,323
350,194
64%
Interest and Dividend Revenue
10,004
13,173
32%
37,427
40,354
8%
Other
5,695
4,705
(17)%
7,416
5,148
(31)%
Total Revenues
915,105
1,217,113
33%
3,252,576
4,019,441
24%
Expenses
Compensation and Benefits
Compensation
568,319
559,781
(2)%
2,421,712
2,091,698
(14)%
Performance Fee Compensation
Realized Carried Interest
13,206
58,573
n/m
43,615
96,433
121%
Realized Incentive Fees
33,524
125,758
275%
55,912
140,042
150%
Unrealized Carried Interest
62,399
71,378
14%
237,945
321,599
35%
Unrealized Incentive Fees
(14,401)
(91,965)
n/m
(20,759)
(44,528)
(114)%
Total Compensation and Benefits
663,047
723,525
9%
2,738,425
2,605,244
(5)%
General, Administrative and Other
185,880
131,063
(29)%
566,313
548,738
(3)%
Interest Expense
16,051
25,505
59%
57,824
72,870
26%
Fund Expenses
6,462
5,586
(14)%
25,507
33,829
33%
Total Expenses
871,440
885,679
2%
3,388,069
3,260,681
(4)%
Other Income (Loss)
Reversal of Tax Receivable Agreement Liability
197,816
-
(100)%
197,816
-
(100)%
Net Gains (Losses) from Fund Investment Activities
464,179
(144,267)
n/m
14,935
256,145
n/m
Income Before Provision for Taxes
705,660
$
187,167
$
(73)%
77,258
$
1,014,905
$
n/m
Provision for Taxes
250,299
65,696
(74)%
345,711
185,023
(46)%
Net Income (Loss)
455,361
$
121,471
$
(73)%
(268,453)
$
829,882
$
n/m
Net Income (Loss) Attributable to Redeemable Non-Controlling Interests in Consolidated
Entities 111
25,151
n/m
(24,869)
103,598
n/m
Net Income (Loss) Attributable to Non-Controlling Interests in Consolidated Entities
456,706
(180,011)
n/m
7,953
99,959
n/m
Net Income (Loss) Attributable to Non-Controlling Interests in Blackstone Holdings
21,221
169,918
n/m
(83,234)
407,727
n/m
Net Income (Loss) Attributable to The Blackstone Group L.P.
(22,677)
$
106,413
$
n/m
(168,303)
$
218,598
$
n/m
Net Income (Loss) per Common Unit, Basic and Diluted
(0.05)
$
0.19
$
n/m
(0.35)
$
0.41
$
n/m |
 Appendix |
 Blackstone
15
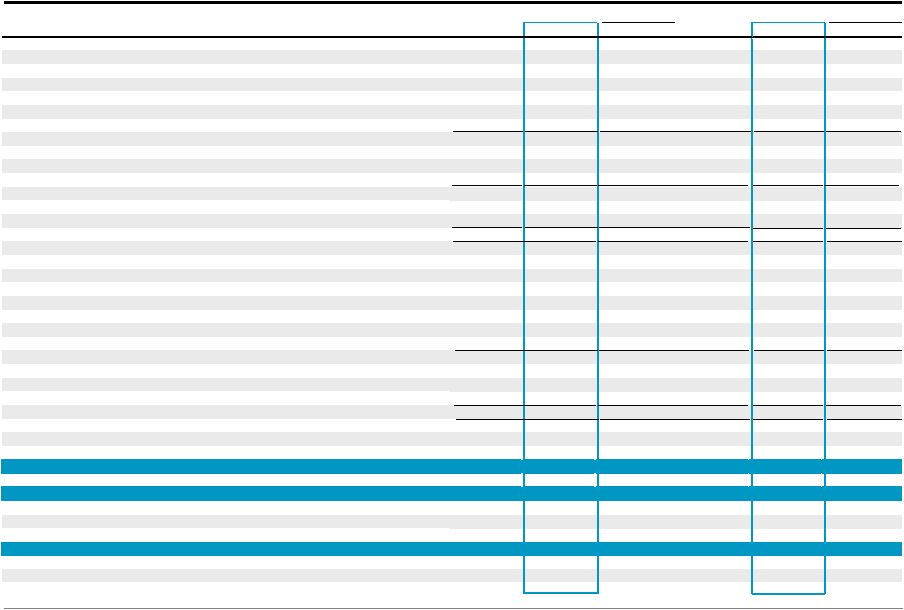
Total Segments
(a)
Transaction and Other Fees, Net, are net of amounts, if any, shared with limited partners
including, for Private Equity, broken deal expenses. (b)
Primarily placement fees.
% Change
(Dollars in Thousands)
4Q'11
1Q'12
2Q'12
3Q'12
4Q'12
FY'11
FY'12
vs. FY'11
Revenues
Management and Advisory Fees, Net
Base Management Fees
336,753
$
395,506
$
381,344
$
398,088
$
416,465
$
1,281,185
$
1,591,403
$
24%
Advisory Fees
123,567
75,846
93,372
59,951
128,248
382,240
357,417
(6)%
Transaction and Other Fees, Net
(a)
43,796
38,471
49,453
45,126
94,069
247,513
227,119
(8)%
Management Fee Offsets
(b)
(8,479)
(13,050)
(7,973)
(8,454)
(11,476)
(33,393)
(40,953)
(23)%
Total Management and Advisory Fees, Net
495,637
496,773
516,196
494,711
627,306
1,877,545
2,134,986
14%
Performance Fees
Realized Carried Interest
12,387
13,560
55,929
83,765
174,168
138,907
327,422
136%
Realized Incentive Fees
51,837
5,279
11,692
11,620
272,873
89,029
301,464
239%
Unrealized Carried Interest
311,162
298,796
84,290
403,465
207,639
971,518
994,190
2%
Unrealized Incentive Fees
(17,436)
68,121
(17,074)
104,149
(184,507)
(24,928)
(29,311)
(18)%
Total Performance Fees
357,950
385,756
134,837
602,999
470,173
1,174,526
1,593,765
36%
Investment Income (Loss)
Realized
16,697
23,492
9,360
25,098
37,448
102,575
95,398
(7)%
Unrealized
39,028
59,914
(25,624)
82,334
74,222
82,689
190,846
131%
Total Investment Income (Loss)
55,725
83,406
(16,264)
107,432
111,670
185,264
286,244
55%
Interest Income and Dividend Revenue
10,003
9,345
10,391
12,004
14,890
38,844
46,630
20%
Other
5,695
(1,207)
(828)
2,477
4,707
7,415
5,149
(31)%
Total Revenues
925,010
974,073
644,332
1,219,623
1,228,746
3,283,594
4,066,774
24%
Expenses
Compensation
225,438
254,772
268,884
259,561
247,559
960,569
1,030,776
7%
Performance Fee Compensation
Realized Carried Interest
13,206
7,938
7,899
22,023
58,573
43,615
96,433
121%
Realized Incentive Fees
33,524
4,252
5,575
4,457
125,758
55,912
140,042
150%
Unrealized Carried Interest
62,399
84,543
36,815
128,863
71,378
237,944
321,599
35%
Unrealized Incentive Fees
(14,401)
12,779
(9,596)
44,254
(91,965)
(20,759)
(44,528)
(114)%
Total Compensation and Benefits
320,166
364,284
309,577
459,158
411,303
1,277,281
1,544,322
21%
Other Operating Expenses
122,072
109,521
113,038
127,456
131,430
421,342
481,445
14%
Total Expenses
442,238
473,805
422,615
586,614
542,733
1,698,623
2,025,767
19%
Economic Income
482,772
$
500,268
$
221,717
$
633,009
$
686,013
$
1,584,971
$
2,041,007
$
29%
Economic Net Income
468,154
$
491,217
$
212,349
$
621,752
$
669,981
$
1,539,208
$
1,995,299
$
30%
Fee Related Earnings
166,096
$
146,928
$
145,729
$
135,052
$
272,604
$
546,493
$
700,313
$
28%
Distributable Earnings
178,186
$
162,121
$
188,404
$
189,635
$
493,765
$
696,724
$
1,033,925
$
48%
Total Assets Under Management
166,228,504
$
190,074,167
$
190,267,831
$
204,551,572
$
210,219,960
$
166,228,504
$
210,219,960
$
26%
Fee-Earning Assets Under Management
136,756,753
$
156,261,446
$
157,646,521
$
168,630,082
$
167,880,440
$
136,756,753
$
167,880,440
$
23%
Weighted Average Fee-Earning AUM
136,876,758
$
154,354,070
$
156,426,744
$
162,377,631
$
168,328,454
$
129,473,025
$
160,130,295
$
24%
LP Capital Invested
3,406,264
$
2,719,433
$
2,403,623
$
3,085,441
$
5,690,474
$
13,529,766
$
13,898,971
$
3%
Total Capital Invested
3,992,488
$
3,134,385
$
2,525,648
$
3,754,061
$
6,200,755
$
14,664,407
$
15,614,849
$
6% |
 Blackstone
16
Private Equity
(a)
Transaction and Other Fees, Net, are net of amounts, if any, shared with limited partners
including, for Private Equity, broken deal expenses. (b)
Primarily placement fees.
% Change
(Dollars in Thousands)
4Q'11
1Q'12
2Q'12
3Q'12
4Q'12
FY'11
FY'12
vs. FY'11
Revenues
Management Fees, Net
Base Management Fees
84,231
$
85,789
$
87,475
$
86,136
$
89,194
$
331,997
$
348,594
$
5%
Transaction
and
Other
Fees,
Net
(a)
23,879
18,097
14,951
25,693
41,339
133,004
100,080
(25)%
Management
Fee
Offsets
(b)
(5,057)
(3,782)
(672)
(767)
(705)
(27,073)
(5,926)
78%
Total Management Fees, Net
103,053
100,104
101,754
111,062
129,828
437,928
442,748
1%
Performance Fees
Realized Carried Interest
(28,392)
3,933
28,781
31,592
45,491
37,393
109,797
194%
Unrealized Carried Interest
83,777
34,051
(87,893)
128,746
73,477
33,490
148,381
n/m
Total Performance Fees
55,385
37,984
(59,112)
160,338
118,968
70,883
258,178
264%
Investment Income (Loss)
Realized
3,512
13,911
(6,195)
7,189
10,918
44,988
25,823
(43)%
Unrealized
25,091
16,469
(28,337)
43,267
53,938
9,476
85,337
n/m
Total Investment Income (Loss)
28,603
30,380
(34,532)
50,456
64,856
54,464
111,160
104%
Interest Income and Dividend Revenue
3,651
2,420
3,114
3,413
4,609
13,749
13,556
(1)%
Other
193
(215)
562
1,650
420
1,810
2,417
34%
Total Revenues
190,885
170,673
11,786
326,919
318,681
578,834
828,059
43%
Expenses
Compensation
45,611
52,547
53,775
62,424
53,963
217,556
222,709
2%
Performance Fee Compensation
Realized Carried Interest
(3,859)
320
804
1,048
1,507
1,465
3,679
151%
Unrealized Carried Interest
7,953
(1,052)
(8,259)
43,228
24,638
(2,229)
58,555
n/m
Total Compensation and Benefits
49,705
51,815
46,320
106,700
80,108
216,792
284,943
31%
Other Operating Expenses
34,493
28,881
30,521
30,944
40,499
120,918
130,845
8%
Total Expenses
84,198
80,696
76,841
137,644
120,607
337,710
415,788
23%
Economic Income (Loss)
106,687
$
89,977
$
(65,055)
$
189,275
$
198,074
$
241,124
$
412,271
$
71%
Total Assets Under Management
45,863,673
$
47,624,013
$
46,633,552
$
50,222,312
$
51,002,973
$
45,863,673
$
51,002,973
$
11%
Fee-Earning Assets Under Management
37,237,791
$
37,323,635
$
37,159,452
$
38,505,497
$
37,050,167
$
37,237,791
$
37,050,167
$
(1)%
Weighted Average Fee-Earning AUM
37,147,118
$
37,491,735
$
37,434,520
$
38,096,139
$
38,507,697
$
36,119,173
$
38,126,640
$
6%
LP Capital Invested
1,093,745
$
643,044
$
102,899
$
1,015,605
$
1,461,987
$
3,848,954
$
3,223,535
$
(16)%
Total Capital Invested
1,563,912
$
680,035
$
108,977
$
1,427,871
$
1,860,738
$
4,465,030
$
4,077,621
$
(9)% |
 Blackstone
17
Real Estate
(a)
Transaction and Other Fees, Net, are net of amounts, if any, shared with limited
partners. (b)
Primarily placement fees.
% Change
(Dollars in Thousands)
4Q'11
1Q'12
2Q'12
3Q'12
4Q'12
FY'11
FY'12
vs. FY'11
Revenues
Management Fees, Net
Base Management Fees
103,947
$
147,802
$
127,817
$
135,659
$
140,044
$
394,778
$
551,322
$
40%
Transaction and Other Fees, Net
(a)
19,128
14,412
25,151
14,937
31,181
109,510
85,681
(22)%
Management Fee Offsets
(b)
(2,820)
(8,627)
(5,357)
(6,034)
(8,591)
(4,950)
(28,609)
n/m
Total Management Fees, Net
120,255
153,587
147,611
144,562
162,634
499,338
608,394
22%
Performance Fees
Realized Carried Interest
3,538
8,617
13,539
51,845
91,113
22,844
165,114
n/m
Realized Incentive Fees
202
(1)
7,766
4,879
13,012
9,629
25,656
166%
Unrealized Carried Interest
237,884
221,500
144,510
207,695
110,059
913,418
683,764
(25)%
Unrealized Incentive Fees
1,806
7,914
(1,526)
6,150
(12,657)
3,658
(119)
n/m
Total Performance Fees
243,430
238,030
164,289
270,569
201,527
949,549
874,415
(8)%
Investment Income
Realized
6,346
7,812
9,067
10,324
18,099
27,972
45,302
62%
Unrealized
19,970
25,912
14,944
33,676
16,343
92,648
90,875
(2)%
Total Investment Income
26,316
33,724
24,011
44,000
34,442
120,620
136,177
13%
Interest Income and Dividend Revenue
3,430
2,552
3,277
3,581
5,038
12,902
14,448
12%
Other
(1,046)
(709)
(590)
1,941
252
(1,061)
894
n/m
Total Revenues
392,385
427,184
338,598
464,653
403,893
1,581,348
1,634,328
3%
Expenses
Compensation
53,507
68,889
76,576
71,456
54,201
236,771
271,122
15%
Performance Fee Compensation
Realized Carried Interest
1,713
4,077
3,401
19,822
35,118
10,103
62,418
n/m
Realized Incentive Fees
91
2
3,871
2,570
6,617
4,564
13,060
186%
Unrealized Carried Interest
57,866
54,275
31,677
47,940
31,590
221,140
165,482
(25)%
Unrealized Incentive Fees
(632)
3,768
(629)
2,876
(6,598)
3,106
(583)
n/m
Total Compensation and Benefits
112,545
131,011
114,896
144,664
120,928
475,684
511,499
8%
Other Operating Expenses
29,027
28,924
26,560
31,284
36,946
103,859
123,714
19%
Total Expenses
141,572
159,935
141,456
175,948
157,874
579,543
635,213
10%
Economic Income
250,813
$
267,249
$
197,142
$
288,705
$
246,019
$
1,001,805
$
999,115
$
(0)%
Total Assets Under Management
42,852,669
$
48,322,760
$
50,225,950
$
53,546,023
$
56,695,645
$
42,852,669
$
56,695,645
$
32%
Fee-Earning Assets Under Management
31,236,540
$
36,647,462
$
38,476,123
$
40,609,286
$
41,931,339
$
31,236,540
$
41,931,339
$
34%
Weighted Average Fee-Earning AUM
31,474,333
$
35,983,336
$
36,882,087
$
38,947,049
$
40,164,238
$
28,377,319
$
37,730,563
$
33%
LP Capital Invested
995,643
$
1,143,555
$
1,855,108
$
1,342,811
$
3,876,701
$
6,141,416
$
8,218,175
$
34%
Total Capital Invested
1,064,690
$
1,172,883
$
1,954,731
$
1,397,249
$
3,990,620
$
6,500,464
$
8,515,483
$
31% |
 Blackstone
18
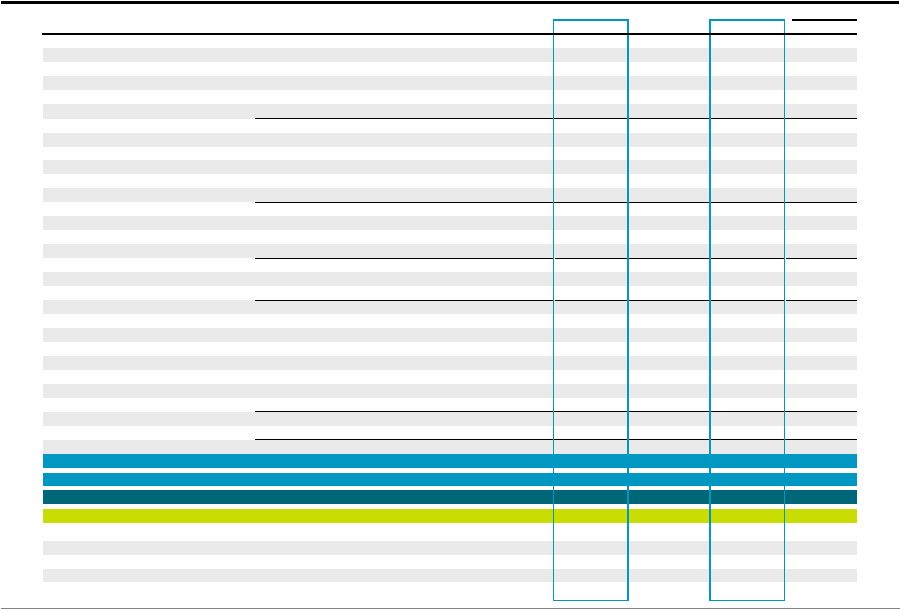
Hedge Fund Solutions
(a)
Transaction and Other Fees, Net, are net of amounts, if any, shared with limited
partners. (b)
Primarily placement fees.
% Change
(Dollars in Thousands)
4Q'11
1Q'12
2Q'12
3Q'12
4Q'12
FY'11
FY'12
vs. FY'11
Revenues
Management Fees, Net
Base Management Fees
81,606
$
81,821
$
84,278
$
87,334
$
92,777
$
315,863
$
346,210
$
10%
Transaction
and
Other
Fees,
Net
(a)
470
92
65
4
27
2,798
188
(93)%
Management
Fee
Offsets
(b)
(402)
(335)
(375)
(382)
(322)
(980)
(1,414)
(44)%
Total Management Fees, Net
81,674
81,578
83,968
86,956
92,482
317,681
344,984
9%
Performance Fees
Realized Incentive Fees
4,148
3,298
1,175
2,637
76,323
11,472
83,433
n/m
Unrealized Incentive Fees
(2,059)
23,187
(10,981)
36,635
(39,799)
774
9,042
n/m
Total Performance Fees
2,089
26,485
(9,806)
39,272
36,524
12,246
92,475
n/m
Investment Income (Loss)
Realized
2,503
503
929
637
5,201
17,722
7,270
(59)%
Unrealized
(3,253)
8,371
(3,636)
5,199
(1,417)
(19,031)
8,517
n/m
Total Investment Income (Loss)
(750)
8,874
(2,707)
5,836
3,784
(1,309)
15,787
n/m
Interest Income and Dividend Revenue
537
386
495
540
718
2,025
2,139
6%
Other
7,818
(127)
27
315
3,601
7,902
3,816
(52)%
Total Revenues
91,368
117,196
71,977
132,919
137,109
338,545
459,201
36%
Expenses
Compensation
38,525
28,233
34,559
28,826
28,113
128,959
119,731
(7)%
Performance Fee Compensation
Realized Incentive Fees
688
1,378
(345)
1,062
20,985
3,498
23,080
n/m
Unrealized Incentive Fees
(865)
7,294
(2,820)
8,062
(11,219)
234
1,317
n/m
Total Compensation and Benefits
38,348
36,905
31,394
37,950
37,879
132,691
144,128
9%
Other Operating Expenses
21,568
13,934
14,506
12,878
16,491
65,072
57,809
(11)%
Total Expenses
59,916
50,839
45,900
50,828
54,370
197,763
201,937
2%
Economic Income
31,452
$
66,357
$
26,077
$
82,091
$
82,739
$
140,782
$
257,264
$
83%
Total Assets Under Management
40,534,768
$
43,351,275
$
42,888,946
$
46,218,618
$
46,092,505
$
40,534,768
$
46,092,505
$
14%
Fee-Earning Assets Under Management
37,819,636
$
40,543,772
$
40,161,179
$
43,601,541
$
43,478,791
$
37,819,636
$
43,478,791
$
15%
Weighted Average Fee-Earning AUM
38,452,740
$
39,904,474
$
40,528,701
$
42,005,752
$
43,709,019
$
37,372,569
$
41,698,402
$
12%
LP Capital Invested
288,237
$
4,661
$
-
$
196,180
$
-
$
889,259
$
200,841
$
(77)%
Total Capital Invested
304,500
$
5,502
$
-
$
207,250
$
-
$
943,327
$
212,752
$
(77)% |
 Blackstone
19
Credit
(a)
Transaction and Other Fees, Net, are net of amounts, if any, shared with limited
partners. (b)
Primarily placement fees.
% Change
(Dollars in Thousands)
4Q'11
1Q'12
2Q'12
3Q'12
4Q'12
FY'11
FY'12
vs. FY'11
Revenues
Management Fees, Net
Base Management Fees
66,969
$
80,094
$
81,774
$
88,959
$
94,450
$
238,547
$
345,277
$
45%
Transaction and Other Fees, Net
(a)
312
5,725
9,184
4,486
21,480
1,880
40,875
n/m
Management Fee Offsets
(b)
(200)
(306)
(1,569)
(1,271)
(1,858)
(390)
(5,004)
n/m
Total Management Fees, Net
67,081
85,513
89,389
92,174
114,072
240,037
381,148
59%
Performance Fees
Realized Carried Interest
37,241
1,010
13,609
328
37,564
78,670
52,511
(33)%
Realized Incentive Fees
47,487
1,982
2,751
4,104
183,538
67,928
192,375
183%
Unrealized Carried Interest
(10,499)
43,245
27,673
67,024
24,103
24,610
162,045
n/m
Unrealized Incentive Fees
(17,183)
37,020
(4,567)
61,364
(132,051)
(29,360)
(38,234)
(30)%
Total Performance Fees
57,046
83,257
39,466
132,820
113,154
141,848
368,697
160%
Investment Income (Loss)
Realized
4,021
683
5,638
6,697
2,593
11,299
15,611
38%
Unrealized
(2,877)
9,211
(9,156)
(736)
5,450
(708)
4,769
n/m
Total Investment Income (Loss)
1,144
9,894
(3,518)
5,961
8,043
10,591
20,380
92%
Interest Income and Dividend Revenue
610
2,425
1,752
2,673
2,480
3,369
9,330
177%
Other
(772)
(238)
(787)
(678)
529
(853)
(1,174)
(38)%
Total Revenues
125,109
180,851
126,302
232,950
238,278
394,992
778,381
97%
Expenses
Compensation
25,435
37,143
42,845
50,236
51,853
128,588
182,077
42%
Performance Fee Compensation
Realized Carried Interest
15,352
3,541
3,694
1,153
21,948
32,047
30,336
(5)%
Realized Incentive Fees
32,745
2,872
2,049
825
98,156
47,850
103,902
117%
Unrealized Carried Interest
(3,420)
31,320
13,397
37,695
15,150
19,033
97,562
n/m
Unrealized Incentive Fees
(12,904)
1,717
(6,147)
33,316
(74,148)
(24,099)
(45,262)
(88)%
Total Compensation and Benefits
57,208
76,593
55,838
123,225
112,959
203,419
368,615
81%
Other Operating Expenses
13,162
17,096
15,749
33,527
18,116
49,955
84,488
69%
Total Expenses
70,370
93,689
71,587
156,752
131,075
253,374
453,103
79%
Economic Income
54,739
$
87,162
$
54,715
$
76,198
$
107,203
$
141,618
$
325,278
$
130%
Total Assets Under Management
36,977,394
$
50,776,119
$
50,519,383
$
54,564,619
$
56,428,837
$
36,977,394
$
56,428,837
$
53%
Fee-Earning Assets Under Management
30,462,786
$
41,746,577
$
41,849,767
$
45,913,758
$
45,420,143
$
30,462,786
$
45,420,143
$
49%
Weighted Average Fee-Earning AUM
29,802,567
$
40,974,525
$
41,581,436
$
43,328,691
$
45,947,499
$
27,603,964
$
42,574,690
$
54%
LP Capital Invested
1,028,639
$
928,173
$
445,616
$
530,845
$
351,786
$
2,650,137
$
2,256,420
$
(15)%
Total Capital Invested
1,059,386
$
1,275,965
$
461,940
$
721,691
$
349,397
$
2,755,586
$
2,808,993
$
2% |
 Blackstone
20
Financial Advisory
% Change
(Dollars in Thousands)
4Q'11
1Q'12
2Q'12
3Q'12
4Q'12
FY'11
FY'12
vs. FY'11
Revenues
Advisory Fees
123,567
75,846
93,372
59,951
128,248
382,240
357,417
(6)%
Transaction and Other Fees, Net
7
145
102
6
42
321
295
(8)%
Total Advisory and Transaction Fees
123,574
75,991
93,474
59,957
128,290
382,561
357,712
(6)%
Investment Income
Realized
315
583
(79)
251
637
594
1,392
134%
Unrealized
97
(49)
561
928
(92)
304
1,348
n/m
Total Investment Income
412
534
482
1,179
545
898
2,740
205%
Interest Income and Dividend Revenue
1,775
1,562
1,753
1,797
2,045
6,799
7,157
5%
Other
(498)
82
(40)
(751)
(95)
(383)
(804)
(110)%
Total Revenues
125,263
78,169
95,669
62,182
130,785
389,875
366,805
(6)%
Expenses
Compensation
62,360
67,960
61,129
46,619
59,429
248,695
235,137
(5)%
Total Compensation and Benefits
62,360
67,960
61,129
46,619
59,429
248,695
235,137
(5)%
Other Operating Expenses
23,822
20,686
25,702
18,823
19,378
81,538
84,589
4%
Total Expenses
86,182
88,646
86,831
65,442
78,807
330,233
319,726
(3)%
Economic Income (Loss)
39,081
$
(10,477)
$
8,838
$
(3,260)
$
51,978
$
59,642
$
47,079
$
(21)% |
 Blackstone
21
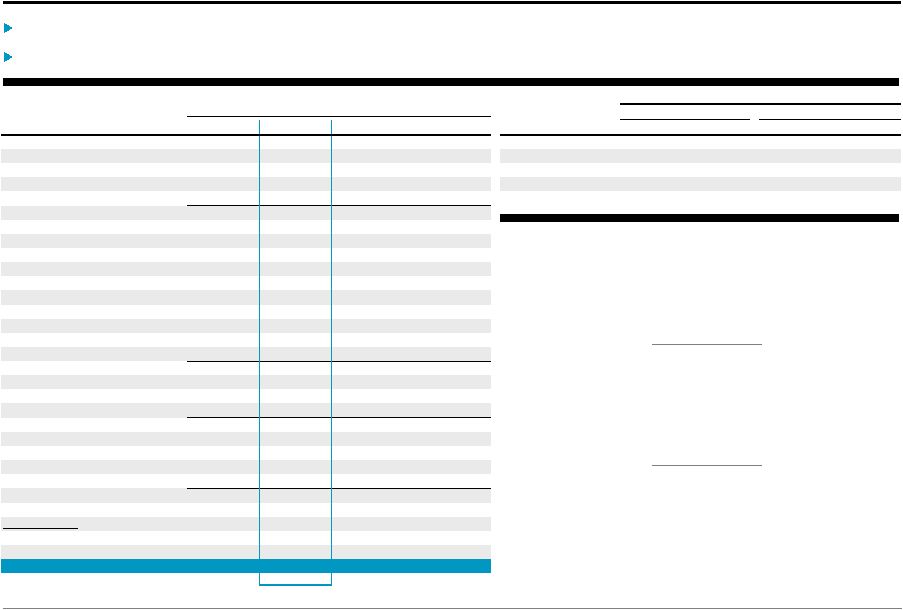
Fee-Earning AUM Net Flows
Fee-Earning AUM was up $31 billion or 23% from a year ago driven mainly by
continued strong net inflows and to a lesser extent market
appreciation. The fourth quarter saw an increase in exit activity with
realizations exceeding half of the full year’s amount. Private Equity
includes our tactical opportunities investment vehicles, which had $1.0 billion of uninvested capital at
year end that will be included in Fee-Earning AUM once invested.
Real Estate Fee-Earning AUM grew 34% during the past year driven by capital
committed to our latest global fund, invested capital in our Debt
Strategies funds and the Capital Trust transaction with $2.2 billion of Fee-Earning AUM.
Hedge Fund Solutions continued its solid growth with $2.4 billion of net inflows
during the year; net outflows during the quarter reflect the cyclical
timing of redemptions which typically exceed half of the full year amount.
Credit Fee-Earning AUM, which does not yet reflect capital raised for our
most recent rescue lending fund, grew 49% during the year due to capital
invested in our carry funds, new product launches and the Harbourmaster acquisition.
4Q’12 Fee-Earning AUM Rollforward
(Dollars in Millions)
FY’12 Fee-Earning AUM Rollforward
(Dollars in Millions)
Totals may not add due to rounding.
(a)
Inflows: include contributions, capital raised, other increases in available capital, purchases
and acquisitions. (b)
Outflows: represent redemptions, client withdrawals and other decreases in available
capital. (c)
Realizations: represent realizations from the disposition of assets.
(d)
Market Activity: gains (losses) on portfolio investments and impact of foreign exchange rate
fluctuations. Private
Real
Hedge Fund
Private
Real
Hedge Fund
Equity
Estate
Solutions
Credit
Total
Equity
Estate
Solutions
Credit
Total
3Q'12
38,505
$
40,609
$
43,602
$
45,914
$
168,630
$
4Q'11
37,238
$
31,237
$
37,820
$
30,463
$
136,757
$
Inflows
(a)
433
3,798
866
2,205
7,302
Inflows
(a)
2,629
14,584
5,460
20,055
42,728
Outflows
(b)
-
(1,372)
(1,668)
(828)
(3,868)
Outflows
(b)
-
(1,486)
(3,015)
(1,700)
(6,201)
Realizations
(c)
(1,906)
(1,093)
-
(2,529)
(5,528)
Realizations
(c)
(2,845)
(2,530)
-
(4,811)
(10,186)
Net Inflows (Outflows)
(1,473)
1,333
(802)
(1,152)
(2,094)
Net Inflows (Outflows)
(216)
10,568
2,445
13,544
26,341
Market Activity
(d)
18
(10)
679
658
1,345
Market Activity
(d)
29
127
3,214
1,414
4,784
4Q'12
37,050
$
41,931
$
43,479
$
45,420
$
167,880
$
4Q'12
37,050
$
41,931
$
43,479
$
45,420
$
167,880
$
QoQ Inc (Dec)
(4)%
3%
(0)%
(1)%
(0)%
YoY Inc (Dec)
(1)%
34%
15%
49%
23% |
 Blackstone
22
Total AUM Net Flows
Total AUM was up $44 billion or 26% for the year driven by strong net inflows and
market appreciation across all of Blackstone’s investment
segments. Realization activity continued to improve and we returned $9.3
billion to our investors during the quarter and $18.5 billion during the
year. Private Equity AUM was up 11% over the prior year driven by
fundraising and market appreciation, resulting from positive performance
of our public holdings as well as mark-ups across our private holdings.
Real Estate AUM grew 32% during the year driven by capital committed to our
latest global buyout fund, solid market appreciation and the Capital Trust
transaction adding $2.3 billion of Total AUM. Hedge Fund Solutions had
market appreciation of $3.4 billion during the year driven by solid returns.
Credit AUM grew 53% during the year through significant organic net inflows
including the first close of our most recent
rescue
lending
fund,
the
acquisition
of
Harbourmaster
and
solid
market
performance.
4Q’12 Total AUM Rollforward
(Dollars in Millions)
FY’12 Total AUM Rollforward
(Dollars in Millions)
Totals may not add due to rounding.
(a)
Inflows: include contributions, capital raised, other increases in available capital, purchases
and acquisitions. (b)
Outflows: represent redemptions, client withdrawals and other decreases in available
capital. (c)
Realizations: represent realizations from the disposition of assets.
(d)
Market Activity: gains (losses) on portfolio investments and impact of foreign exchange rate
fluctuations. Private
Real
Hedge Fund
Private
Real
Hedge Fund
Equity
Estate
Solutions
Credit
Total
Equity
Estate
Solutions
Credit
Total
3Q'12
50,222
$
53,546
$
46,219
$
54,565
$
204,552
$
4Q'11
45,864
$
42,853
$
40,535
$
36,977
$
166,229
$
Inflows
(a)
642
3,562
875
4,570
9,649
Inflows
(a)
4,234
12,566
5,339
24,489
46,628
Outflows
(b)
(31)
(40)
(1,725)
(972)
(2,768)
Outflows
(b)
(76)
(262)
(3,168)
(2,429)
(5,935)
Realizations
(c)
(1,949)
(1,789)
-
(2,775)
(6,513)
Realizations
(c)
(3,453)
(3,927)
-
(5,179)
(12,559)
Net Inflows (Outflows)
(1,338)
1,733
(850)
823
368
Net Inflows
705
8,377
2,171
16,881
28,134
Market Activity
(d)
2,119
1,417
723
1,042
5,301
Market Activity
(d)
4,435
5,466
3,387
2,571
15,859
4Q'12
51,003
$
56,696
$
46,093
$
56,429
$
210,220
$
4Q'12
51,003
$
56,696
$
46,093
$
56,429
$
210,220
$
QoQ Inc (Dec)
2%
6%
(0)%
3%
3%
YoY Increase
11%
32%
14%
53%
26% |
 Blackstone
23
Net
Accrued
Performance
Fees
and
Carried
Interest
Status
(a)
(a)
Preliminary. Totals may not add due to rounding.
(b)
Net Accrued Performance Fees are presented net of performance fee compensation and do not
include clawback amounts, if any, which are disclosed in the 10-K/Q. As of 4Q’12, $167 million of Net Accrued Performance Fees, primarily
attributable to Hedge Fund Solutions and Credit, were realized and included in 2012
Distributable Earnings. When these fees are received, the receivable will be reduced without further impacting Distributable Earnings.
(c)
Per Unit calculations are based on quarter-end Distributable Earnings Units Outstanding
(see Appendix – Unit Rollforward).
(d)
Represents the required increase in equity at the fund level (excluding side-by-side
investments) for funds with expired investment periods which are currently not generating performance fees.
Blackstone had $2.2 billion of accrued performance fees, net of performance fee
compensation, as of year end. BCP V and BREP Int’l II were below their
respective carried interest thresholds as of year end. $2.2 billion
4Q’12 Net Accrued Performance Fees
$1.99 per unit
4Q’12 Net Accrued Performance Fees
52% increase
in Net Accrued Performance Fees since 4Q’11
Carried Interest Status (excl. SBS)
(d)
Net Accrued Performance Fees
(b)
Remaining Capital
Gain to Cross Carry Threshold
(Dollars in Millions, Except per Unit Data)
3Q'12
4Q'12
Per Unit
(c)
Change vs. 3Q'12
(Dollars / Euros In Millions)
@ FMV
@ Cost
Amount
% Change in TEV
Private Equity
Private Equity
BCP IV Carried Interest
551
$
582
$
0.52
$
31
$
BCP V
17,930
$
16,036
$
5,649
$
12%
BCP VI Carried Interest
8
22
0.02
14
BEP Carried Interest
30
38
0.03
8
Real Estate
Tactical Opportunities Carried Interest
2
2
0.00
-
BREP Int'l II
1,026
€
1,130
€
991
€
23%
Total Private Equity
591
644
0.57
53
Real Estate
BREP V Carried Interest
434
448
0.40
14
BREP VI Carried Interest
590
610
0.54
20
BREP VII Carried Interest
44
82
0.07
38
BREP Int'l I Carried Interest
3
2
0.00
(1)
BREP Europe III Carried Interest
66
74
0.07
8
BREDS Carried Interest
19
19
0.02
-
BREDS Incentive Fees
5
7
0.01
2
Asia Platform Incentive Fees
28
23
0.02
(5)
Total Real Estate
1,189
1,265
1.13
76
Hedge Fund Solutions
Incentive Fees
42
67
0.06
25
Total Hedge Fund Solutions
42
67
0.06
25
Credit
Carried Interest
142
144
0.13
2
Incentive Fees
85
118
0.11
33
Total Credit
227
262
0.23
35
Total Blackstone
Carried Interest
1,889
2,023
1.80
134
Incentive Fees
160
215
0.19
55
Net Accrued Performance Fees
2,049
$
2,238
$
1.99
$
189
$
|
 Blackstone
24
Investment
Records
as
of
December
31,
2012
(a)
Notes on next page.
Total Credit
9,373,143
$
3,695,183
$
7,539,740
$
1.3x
-
2,840,414
$
1.4x
10,380,154
$
1.3x
-
-
Committed
Available
Unrealized Investments
Realized Investments
Total Investments
Net IRRs
(d)
(Dollars in Thousands, Except Where Noted)
Capital
Capital
(b)
Value
MOIC
(c)
% Public
Value
MOIC
(c)
Value
MOIC
(c)
Realized
Total
Private Equity
BCP I (Oct 1987 / Oct 1993)
859,081
$
-
$
-
$
n/a
-
1,741,738
$
2.6x
1,741,738
$
2.6x
19%
19%
BCP II (Oct 1993 / Aug 1997)
1,361,100
-
-
n/a
-
3,256,819
2.5x
3,256,819
2.5x
32%
32%
BCP III (Aug 1997 / Nov 2002)
3,973,378
167,776
-
n/a
100%
9,181,266
2.3x
9,181,266
2.3x
14%
14%
BCOM (Jun 2000 / Jun 2006)
2,137,330
202,433
347,362
0.9x
52%
2,463,892
1.4x
2,811,254
1.3x
9%
6%
BCP IV (Nov 2002 / Dec 2005)
6,773,138
250,890
5,946,433
2.1x
60%
14,246,559
3.0x
20,192,992
2.7x
57%
37%
BCP V (Dec 2005 / Jan 2011)
21,020,395
1,370,953
19,354,620
1.2x
20%
3,910,358
1.1x
23,264,978
1.2x
1%
2%
BCP VI (Jan 2011 / Jan 2016)
15,220,745
11,418,584
3,502,548
1.2x
28%
35,962
1.3x
3,538,510
1.2x
21%
11%
BEP (Aug 2011 / Aug 2017)
2,415,848
1,433,833
864,486
1.7x
43%
32,546
1.2x
897,032
1.7x
30%
84%
Total Core Private Equity
53,761,015
$
14,844,469
$
30,015,449
$
1.3x
34,869,140
$
2.2x
64,884,589
$
1.7x
21%
15%
Tactical Opportunities
1,683,786
1,402,545
292,388
1.1x
-
7,515
1.3x
299,903
1.1x
n/m
22%
Other Funds and Co-Invest
975,857
264,443
241,057
n/a
-
-
n/a
241,057
n/a
n/a
n/a
Total Private Equity
56,420,658
$
16,511,457
$
30,548,894
$
1.3x
34,876,655
$
2.2x
65,425,549
$
1.6x
21%
14%
Real Estate
Dollar
Pre-BREP
140,714
$
-
$
-
$
n/a
-
345,190
$
2.5x
345,190
$
2.5x
33%
33%
BREP I (Sep 1994 / Oct 1996)
380,708
-
-
n/a
-
1,327,708
2.8x
1,327,708
2.8x
40%
40%
BREP II (Oct 1996 / Mar 1999)
1,198,339
-
-
n/a
-
2,531,613
2.1x
2,531,613
2.1x
19%
19%
BREP III (Apr 1999 / Apr 2003)
1,522,708
-
2,161
0.1x
-
3,325,133
2.4x
3,327,294
2.4x
22%
21%
BREP IV (Apr 2003 / Dec 2005)
2,198,694
-
1,304,704
0.8x
5%
2,865,821
2.4x
4,170,525
1.5x
80%
13%
BREP V (Dec 2005 / Feb 2007)
5,538,579
243,946
7,035,133
1.6x
-
2,352,733
1.6x
9,387,866
1.6x
41%
9%
BREP VI (Feb 2007 / Aug 2011)
11,057,598
778,946
14,875,722
1.5x
6%
1,657,237
2.0x
16,532,959
1.5x
30%
9%
BREP VII (Aug 2011 / Feb 2017)
13,380,006
8,309,404
6,029,048
1.2x
-
285,170
1.5x
6,314,218
1.2x
93%
31%
Total Global Real Estate Funds
35,417,346
$
9,332,296
$
29,246,768
$
1.4x
3%
14,690,605
$
2.1x
43,937,373
$
1.6x
28%
16%
BREP Co-Investment
(e)
3,551,965
-
4,666,535
1.5x
1%
499,348
1.4x
5,165,883
1.5x
11%
11%
Euro
BREP Int'l (Jan 2001 / Sep 2005)
824,172
€
-
€
109,596
€
1.2x
-
1,230,290
€
2.2x
1,339,886
€
2.0x
26%
23%
BREP Int'l II (Sep 2005 / Jun 2008)
1,627,954
81,163
1,130,137
0.9x
-
191,501
1.2x
1,321,638
1.0x
3%
(3)%
BREP Europe III (Jun 2008 / Dec 2013)
3,199,792
1,232,039
2,689,712
1.3x
-
15,712
2.8x
2,705,424
1.4x
49%
18%
Total Euro Funds
5,651,918
€
1,313,202
€
3,929,445
€
1.2x
-
1,437,503
€
2.0x
5,366,948
€
1.3x
24%
8%
Total Real Estate
46,092,185
$
11,003,912
$
39,105,145
$
1.4x
3%
16,961,798
$
2.1x
56,066,943
$
1.5x
27%
14%
2,824,982
$
792,570
$
2,373,265
$
1.2x
-
1,332,667
$
1.2x
3,705,932
$
1.2x
16%
13%
Credit
Mezzanine
6,120,000
$
3,005,452
$
4,342,028
$
1.4x
-
1,667,885
$
1.6x
6,009,913
$
1.4x
n/a
19%
Rescue Lending
3,253,143
689,731
3,197,712
1.2x
-
1,172,529
1.2x
4,370,241
1.2x
n/a
14%
Total Credit
9,373,143
$
3,695,183
$
7,539,740
$
1.3x
-
2,840,414
$
1.4x
10,380,154
$
1.3x
-
-
(f)
Debt Strategies Drawdown |
 Blackstone
25
The returns presented herein represent those of the applicable Blackstone Funds and not those of
The Blackstone Group L.P. n/m
Not meaningful.
n/a
Not applicable.
(a)
Preliminary.
(b)
Available Capital represents total investable capital commitments, including
side-by-side, adjusted for certain expenses and expired or recallable capital,
less invested capital. This amount is not reduced by outstanding commitments to investments.
Additionally, the Real Estate segment has $1.1 billion of Available Capital that has been
reserved for add-on investments in funds that are fully invested.
(c)
Multiple of Invested Capital (“MOIC”) represents carrying value, before management
fees, expenses and Carried Interest, divided by invested capital.
(d)
Net Internal Rate of Return (“IRR”) represents the annualized inception to December
31, 2012 IRR on total invested capital based on realized proceeds and unrealized value,
as applicable, after management fees, expenses and Carried Interest. (e)
BREP Co-Investment represents co-investment capital raised for various BREP
investments. The Net IRR reflected is calculated by aggregating each
co-investment’s realized proceeds and unrealized value, as applicable, after management fees, expenses
and Carried Interest.
(f)
Excludes Capital Trust drawdown funds.
Investment Records as of December 31, 2012 – Notes
|
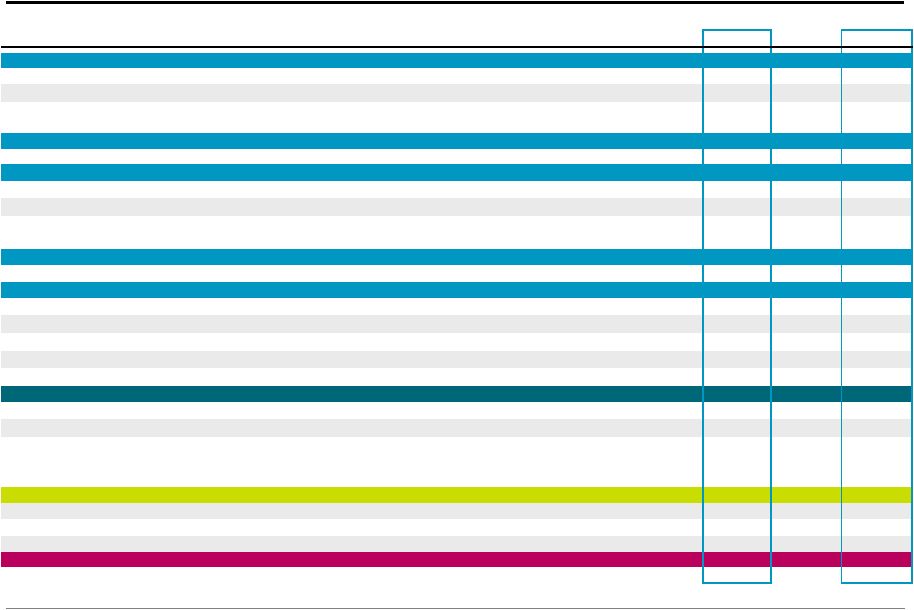 Blackstone
26
Reconciliation of GAAP to Non-GAAP Measures
Notes on next page.
(Dollars in Thousands)
4Q'11
1Q'12
2Q'12
3Q'12
4Q'12
FY'11
FY'12
(22,677)
$
58,325
$
(74,964)
$
128,824
$
106,413
$
(168,303)
$
218,598
$
21,221
107,405
(53,027)
183,431
169,918
(83,234)
407,727
456,706
197,643
239,934
(157,607)
(180,011)
7,953
99,959
111
54,259
(17,666)
41,854
25,151
(24,869)
103,598
455,361
$
417,632
$
94,277
$
196,502
$
121,471
$
(268,453)
$
829,882
$
250,299
38,753
41,337
39,237
65,696
345,711
185,023
705,660
$
456,385
$
135,614
$
235,739
$
187,167
$
77,258
$
1,014,905
$
147,808
244,897
268,936
248,179
317,499
1,269,932
1,079,511
86,121
50,888
39,435
33,338
26,487
220,865
150,148
(456,817)
(251,902)
(222,268)
115,753
154,860
16,916
(203,557)
482,772
$
500,268
$
221,717
$
633,009
$
686,013
$
1,584,971
$
2,041,007
$
(14,618)
(9,051)
(9,368)
(11,257)
(16,032)
(45,763)
(45,708)
468,154
$
491,217
$
212,349
$
621,752
$
669,981
$
1,539,208
$
1,995,299
$
14,618
9,051
9,368
11,257
16,032
45,763
45,708
(357,950)
(385,756)
(134,837)
(602,999)
(470,173)
(1,174,526)
(1,593,765)
(55,725)
(83,406)
16,264
(107,432)
(111,670)
(185,264)
(286,244)
2,271
6,310
1,892
12,877
4,690
4,600
25,769
94,728
109,512
40,693
199,597
163,744
316,712
513,546
166,096
$
146,928
$
145,729
$
135,052
$
272,604
$
546,493
$
700,313
$
17,494
6,649
54,147
68,905
262,710
128,409
392,411
16,697
23,492
9,360
25,098
37,448
102,575
95,398
(2,395)
(5,897)
(1,280)
(8,251)
(6,444)
(6,057)
(21,872)
(19,706)
(9,051)
(19,552)
(31,169)
(72,553)
(74,696)
(132,325)
178,186
$
162,121
$
188,404
$
189,635
$
493,765
$
696,724
$
1,033,925
$
14,843
13,554
12,850
18,163
24,585
53,201
69,152
19,706
9,051
19,552
31,169
72,553
74,696
132,325
8,451
10,268
10,391
8,895
12,681
32,764
42,235
221,186
$
194,994
$
231,197
$
247,862
$
603,584
$
857,385
$
1,277,637
$
Net Income (Loss) Attributable to Non-Controlling Interests in Blackstone Holdings
Net Income (Loss) Attributable to Non-Controlling Interests in Consolidated Entities
Net Income (Loss) Attributable to Redeemable Non-Controlling
Interests in Consolidated Entities
Net Income (Loss)
Provision for Taxes
Income Before Provision for Taxes
IPO and Acquisition-Related Charges
(a)
Amortization of Intangibles
(b)
Income (Loss) Associated with Non-Controlling Interests in (Income) Loss of
Consolidated Entities
(c)
Economic Income
Taxes
(d)
Economic Net Income
Taxes
(d)
Performance Fee Adjustment
(e)
Investment Income (Loss) Adjustment
(f)
Investment Income (Loss)
-
Blackstone's Treasury Cash Management Strategies
(g)
Performance Fee Compensation and Benefits Adjustment
(h)
Fee Related Earnings
Realized Performance Fees
(i)
Realized Investment Income
(j)
Adjustment Related to Realized Investment Income -
Blackstone's Treasury Cash Management Strategies
(k)
Taxes and Related Payables Including Payable Under Tax Receivable Agreement
(l)
Distributable Earnings
Interest
Taxes and Related Payables Including Payable Under Tax Receivable Agreement
(l)
Depreciation and Amortization
Adjusted EBITDA
Net Income (Loss) Attributable to The Blackstone Group L.P. |
 Blackstone
27
Note:
Prior period amounts have been adjusted to conform to the current period presentation and
definitions. See also Appendix – Definitions.
(a)
This adjustment adds back to Income (Loss) Before Provision (Benefit) for Taxes amounts for
Transaction-Related Charges which include principally equity-based compensation
charges associated with Blackstone’s initial public offering and long-term retention
programs outside of annual deferred compensation and other corporate actions.
(b)
This adjustment adds back to Income (Loss) Before Provision (Benefit) for Taxes amounts for
the Amortization of Intangibles which are associated with Blackstone’s initial
public offering and other corporate actions. (c)
This adjustment adds back to Income (Loss) Before Provision (Benefit) for Taxes the amount of
(Income) Loss Associated with Non- Controlling Interests in (Income) Loss of
Consolidated Entities and includes the amount of Management Fee Revenues associated
with Consolidated CLO Entities.
(d)
Taxes represent the current tax provision (benefit) calculated on Income (Loss) Before
Provision for Taxes. (e)
This adjustment removes from EI the total segment amount of Performance Fees.
(f)
This adjustment removes from EI the total segment amount of Investment Income (Loss).
(g)
This adjustment represents the realized and unrealized gain on Blackstone’s Treasury cash
management strategies which are a component of Investment Income (Loss) but included in
Fee Related Earnings. (h)
This adjustment removes from expenses the compensation and benefit amounts related to
Blackstone’s profit sharing plans related to Performance Fees.
(i)
Represents the adjustment for realized Performance Fees net of corresponding actual amounts
due under Blackstone’s profit sharing plans related thereto.
(j)
Represents the adjustment for Blackstone’s Investment Income (Loss) -
Realized.
(k)
Represents the elimination of Realized Investment Income attributable to Blackstone’s
Treasury cash management strategies which is a component of both Fee Related Earnings
and Realized Investment Income (Loss). (l)
Taxes and Related Payables Including Payable Under Tax Receivable Agreement represent the
current tax provision (benefit) calculated on Income (Loss) Before Provision for Taxes
and the Payable Under Tax Receivable Agreement. Reconciliation of GAAP to Non-GAAP
Measures – Notes |
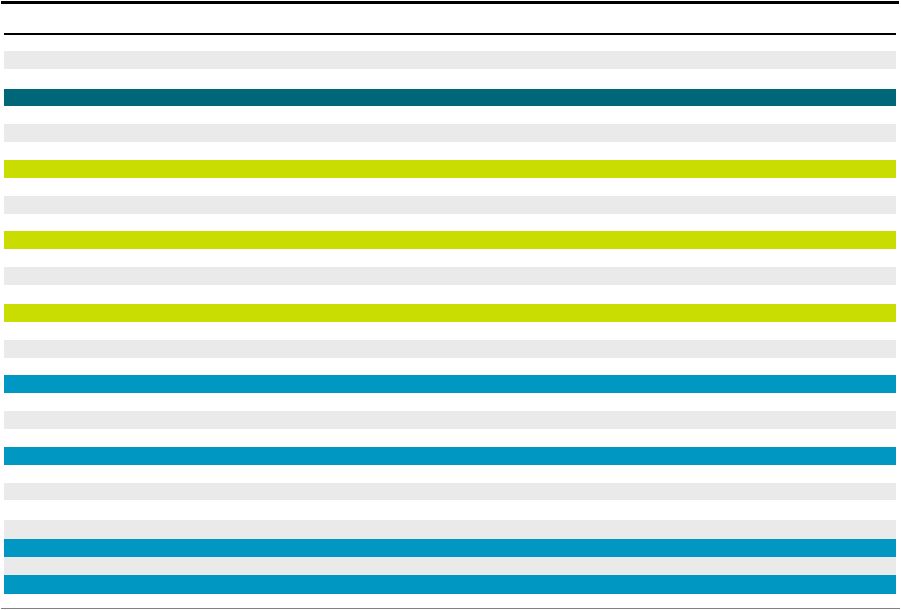 Blackstone
28
Calculation of Certain Non-GAAP Financial Metric Components
(Dollars in Thousands)
4Q'12
FY'12
Interest Income and Dividend Revenue
14,890
$
46,630
$
Other Revenue
4,707
5,149
4,690
25,769
Interest Income and Other Revenue
24,287
$
77,548
$
Realized Incentive Fees
272,873
301,464
Less: Realized Incentive Fee Compensation
(125,758)
(140,042)
Net Realized Incentive Fees
147,115
$
161,422
$
Realized Carried Interest
174,168
327,422
Less: Realized Carried Interest Compensation
(58,573)
(96,433)
Net Realized Carried Interest
115,595
$
230,989
$
Realized Investment Income
37,448
95,398
(6,444)
(21,872)
Net Realized Investment Income
31,004
$
73,526
$
Unrealized Incentive Fees
(184,507)
(29,311)
Less: Unrealized Incentive Fee Compensation
91,965
44,528
Net Unrealized Incentive Fees
(92,542)
$
15,217
$
Unrealized Carried Interest
207,639
994,190
Less: Unrealized Carried Interest Compensation
(71,378)
(321,599)
Net Unrealized Carried Interest
136,261
$
672,591
$
Unrealized Investment Income
74,222
190,846
(4,690)
(25,769)
6,444
21,872
Net Unrealized Investment Income
75,976
$
186,949
$
Related Payables
(b)
56,521
$
86,617
$
Investment
Income
-
Blackstone's
Treasury
Cash
Management
Strategies
(a)
Adjustment
Related
to
Realized
Investment
Income
-
Blackstone's
Treasury
Cash
Management
Strategies
(a)
Less:
Investment
Income
-
Blackstone's
Treasury
Cash
Management
Strategies
(a)
Less:
Adjustment
Related
to
Realized
Investment
Income
-
Blackstone's
Treasury
Cash
Management
Strategies
(a)
Unless otherwise noted, all amounts are the respective captions from the Total Segment
information. (a)
(b)
See Appendix - Reconciliation of GAAP to Non-GAAP Measures for this adjustment. Represents tax related
payables including the Payable Under Tax Receivable Agreement. |
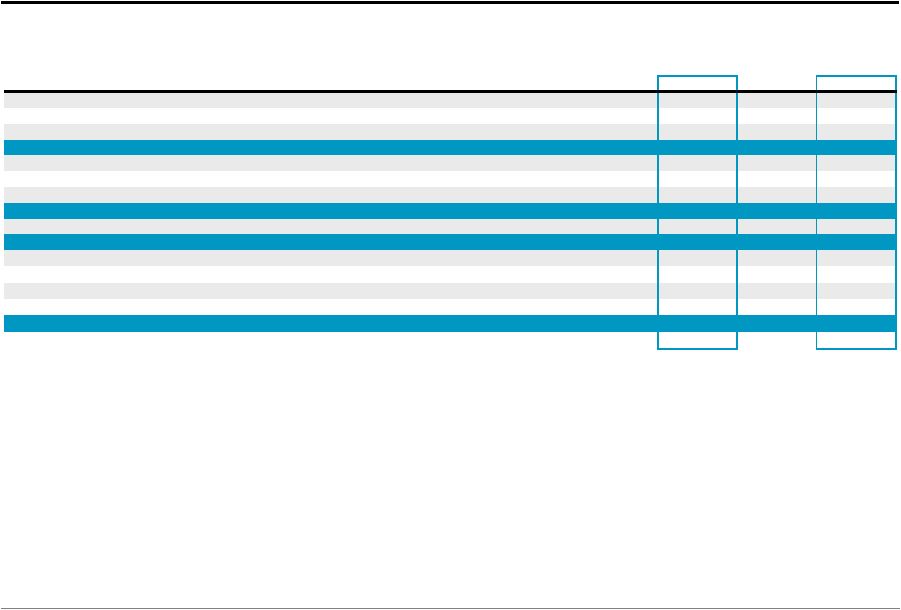 Blackstone
29
Unit Rollforward
(a)
(b)
4Q'11
1Q'12
2Q'12
3Q'12
4Q'12
FY'11
FY'12
490,511,637
506,985,529
528,778,977
544,716,399
553,989,577
475,582,718
533,703,606
Adjustments:
Weighted-Average Unvested Deferred Restricted Common Units
-
10,404,029
-
2,207,204
2,430,014
-
4,965,464
Total GAAP Weighted-Average Common Units Outstanding
490,511,637
517,389,558
528,778,977
546,923,603
556,419,591
475,582,718
538,669,070
Adjustments:
Weighted-Average Blackstone Holdings Partnership Units
613,105,891
602,817,069
591,155,160
586,762,611
581,202,276
628,115,753
590,446,577
Weighted-Average Unvested Deferred Restricted Common Units
12,469,282
-
4,820,609
-
-
9,244,394
-
Weighted-Average Economic Net Income Adjusted Units
1,116,086,810
1,120,206,627
1,124,754,746
1,133,686,214
1,137,621,867
1,112,942,865
1,129,115,647
Economic Net Income Adjusted Units, End of Period
1,108,034,890
1,119,829,138
1,122,067,386
1,133,637,141
1,143,019,281
1,108,034,890
1,143,019,281
Total Common Units Outstanding
(a)
495,599,976
510,868,415
525,464,110
537,299,585
568,600,922
495,599,976
568,600,922
Adjustments:
Blackstone Holdings Partnership Units
608,718,156
597,566,417
585,315,742
584,690,200
553,614,040
608,718,156
553,614,040
Distributable Earnings Units Outstanding
(b)
1,104,318,132
1,108,434,832
1,110,779,852
1,121,989,785
1,122,214,962
1,104,318,132
1,122,214,962
Common Unitholders receive Tax Benefits from deductions taken by Blackstone’s corporate
tax paying subsidiaries and bear responsibility for the deduction from Distributable
Diluted
-
Earnings of the Payable Under Tax Receivable Agreement and certain other tax-related
payables. Excludes units which are not entitled to
distributions. Total GAAP Weighted-Average Common Units
Outstanding -Basic |
 Blackstone
30
Distribution Policy
For 2013, Blackstone’s intention is to distribute to common unitholders each quarter
substantially all of its Net Cash Available for Distribution to Common Unitholders,
subject to a base quarterly distribution of $0.12 per unit. Net Cash Available for
Distribution to Common Unitholders is The Blackstone Group L.P.’s share of
Distributable Earnings, less realized investment gains and returns of capital from
investments and acquisitions, in excess of amounts determined by Blackstone’s general
partner to be necessary or appropriate to provide for the conduct of its business, to make
appropriate investments in its business and funds, to comply with applicable law, any
of its debt instruments or other agreements, or to provide for future cash requirements such as
tax-related payments, clawback obligations and distributions to unitholders for any
ensuing quarter. All of the foregoing is subject to the qualification that the
declaration and payment of any distributions are at the sole discretion of
Blackstone’s general partner and may change at any time, including, without
limitation, to reduce the quarterly distribution payable to
common unitholders to less than $0.12 per unit or even to eliminate such distributions
entirely. In circumstances in which the Net Cash Available for Distribution to Common
Unitholders for a quarter falls short of the amount necessary to
support
the
base
distribution
of
$0.12
per
unit,
Blackstone
intends
to
correspondingly
reduce
subsequent
quarterly
distributions
below
the
amounts supported by the Net Cash Available for Distribution to
Common Unitholders by the amount of the shortfall, but not
below $0.12 per unit. |
 Blackstone
31
Definitions
Blackstone discloses the following financial measures that are calculated and presented on the
basis of methodologies other than in accordance with generally accepted accounting
principles in the United States of America (“non-GAAP”) in this presentation:
•
Blackstone uses Economic Income, or “EI”, as a key measure of value creation, a
benchmark of its performance and in making resource deployment and compensation
decisions across its five segments. EI represents segment net income before taxes excluding transaction-related charges.
Transaction-related charges arise from Blackstone’s initial public offering
(“IPO”) and long-term retention programs outside of annual deferred
compensation and other corporate actions, including acquisitions.
Transaction-related charges include equity-based compensation charges, the
amortization of intangible assets and contingent consideration associated with
acquisitions. EI presents revenues and expenses on a basis that deconsolidates
the investment funds Blackstone manages.
•
Economic Net Income, or “ENI”, represents EI adjusted to include current period
taxes. Taxes represent the current tax provision (benefit) calculated on Income
(Loss) Before Provision for Taxes.
•
Blackstone uses Fee Related Earnings, or “FRE”, as a key measure to highlight
earnings from operations excluding: (a) the income related to performance fees
and related carry plan costs, (b) income earned from Blackstone’s investments in the Blackstone Funds, and (c) realized and
unrealized gains (losses) from other investments except for such gains (losses) from
Blackstone’s Treasury cash management strategies. Blackstone uses FRE as a
measure to assess whether recurring revenue from its businesses is sufficient to adequately cover all of its operating expenses and
generate profits. FRE equals contractual fee revenues, investment income from
Blackstone’s Treasury cash management strategies and interest income, less (a)
compensation expenses (which includes amortization of non-IPO and non-acquisition-related equity-based awards, but excludes
amortization of IPO and acquisition-related equity-based awards, carried interest and
incentive fee compensation), and (b) other operating expenses. •
Distributable Earnings, or “DE”, which is derived from Blackstone’s segment
reported results, is a supplemental measure to assess performance and amounts available
for distributions to Blackstone unitholders, including Blackstone personnel and others who are limited partners of the Blackstone
Holdings partnerships. DE is intended to show the amount of net realized earnings
without the effects of the consolidation of the Blackstone Funds. DE, which is a
component of ENI, is the sum across all segments of: (a) Total Management and Advisory Fees, (b) Interest and Dividend Revenue,
(c) Other Revenue, (d) Realized Performance Fees, and (e) Realized Investment Income (Loss);
less (a) Compensation, (b) Realized Performance Fee Compensation, (c) Other Operating
Expenses, and (d) Taxes and Related Payables Including the Payable Under Tax Receivable Agreement. DE is
reconciled to Blackstone’s Consolidated Statement of Operations. •
Blackstone uses Adjusted Earnings Before Interest, Taxes and Depreciation and Amortization, or
“Adjusted EBITDA”, as a measure of segment performance and an indicator of
its ability to cover recurring operating expenses. Adjusted EBITDA equals DE before segment interest expense,
segment depreciation and amortization, and the taxes and related payables including the
Payable Under Tax Receivable Agreement.
|
 Blackstone
32
Forward-Looking Statements
This presentation may contain forward-looking statements within the meaning of Section 27A
of the Securities Act of 1933 and Section 21E of the Securities Exchange Act of 1934
which reflect Blackstone’s current views with respect to, among other things,
Blackstone’s operations and financial performance. You can identify these
forward-looking statements by the use of words such as “outlook,”
“believes,”
“expects,”
“potential,”
“continues,”
“may,”
“will,”
“should,”
“seeks,”
“approximately,”
“predicts,”
“intends,”
“plans,”
“estimates,”
“anticipates”
or the negative version of these words or other comparable words. Such forward-looking
statements are subject to various risks and uncertainties. Accordingly, there are or
will be important factors that could cause actual outcomes
or
results
to
differ
materially
from
those
indicated
in
these
statements.
Blackstone
believes
these
factors
include
but
are
not limited to those described under the section entitled “Risk Factors”
in its Annual Report on Form 10-K for the fiscal year ended
December 31, 2011, as such factors may be updated from time to time in its periodic filings
with the Securities and Exchange Commission, which are accessible on the SEC’s
website at www.sec.gov. These factors should not be construed as exhaustive and should
be read in conjunction with the other cautionary statements that are included in this presentation and in the filings.
Blackstone undertakes no obligation to publicly update or review
any forward-looking statement, whether as a result of new
information, future developments or otherwise.
This presentation does not constitute an offer of any Blackstone
Fund. |