Attached files
| file | filename |
|---|---|
| 8-K - FORM 8-K - UNITED BANKSHARES INC/WV | d476184d8k.htm |
| EX-99.1 - PRESS RELEASE - UNITED BANKSHARES INC/WV | d476184dex991.htm |
Exhibit 99.2
UNITED BANKSHARES, INC. (NASDAQ: UBSI)
United Bankshares, Inc. to Acquire Virginia Commerce Bancorp, Inc.
January 30, 2013
Richard M. Adams Steven E. Wilson
Chairman of the Board & Executive Vice President & Chief Executive Officer Chief Financial Officer
www.ubsi-inc.com
Forward-Looking Statements
This presentation may contain forward-looking statements about United Bankshares, Inc., which we believe are within the meaning of the Private Securities Litigation Reform Act of 1995. This presentation may contain certain forward-looking statements with respect to the financial condition, results of operations, plans, objectives, future performance and business of United including statements preceded by, followed by or that include the words “believes,” “expects,” “anticipates” or similar expressions. These forward-looking statements involve certain risks and uncertainties. There are a number of important factors that could cause future results to differ materially from historical performance and these forward-looking statements.
Factors that might cause such a difference include, but are not limited to: (1) competitive pressures among depository institutions increase significantly; (2) changes in interest rate environment reduce interest margins; (3) prepayment speeds, loan sale volumes, charge-offs and loan loss provisions;
(4) general economic conditions, either national or in the states in which United does business, are less favorable than expected; (5) legislative or regulatory changes adversely affect the businesses in which United is engaged; (6) changes in the securities markets.
Further information on other factors, which could affect the financial results of United, are included in United’s filings with the Securities and Exchange Commission. These documents are available free of charge at the Commission’s website at www.sec.gov and/or from United.
2
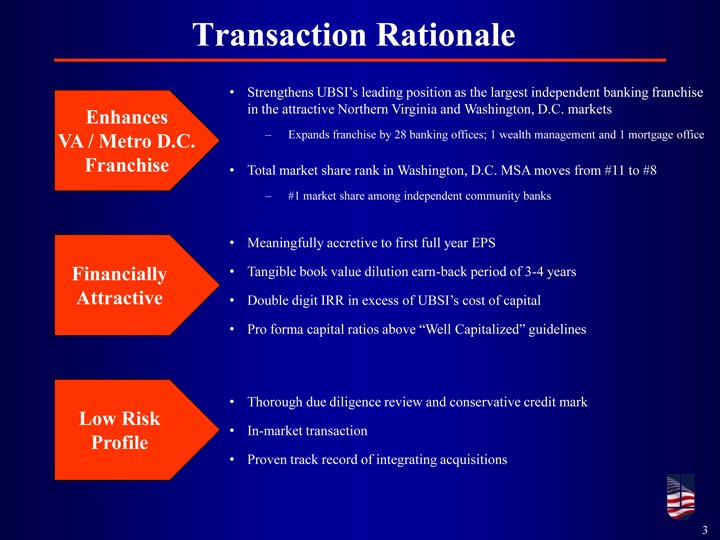
Transaction Rationale
• Strengthens UBSI’s leading position as the largest independent banking franchise
Enhances in the attractive Northern Virginia and Washington, D.C. markets
VA / Metro D.C. – Expands franchise by 28 banking offices; 1 wealth management and 1 mortgage office
Franchise • Total market share rank in Washington, D.C. MSA moves from #11 to #8
– #1 market share among independent community banks
• Meaningfully accretive to first full year EPS
Financially • Tangible book value dilution earn-back period of 3-4 years Attractive • Double digit IRR in excess of UBSI’s cost of capital
• Pro forma capital ratios above “Well Capitalized” guidelines
• Thorough due diligence review and conservative credit mark
Low Risk
• In-market transaction
Profile
• Proven track record of integrating acquisitions
3
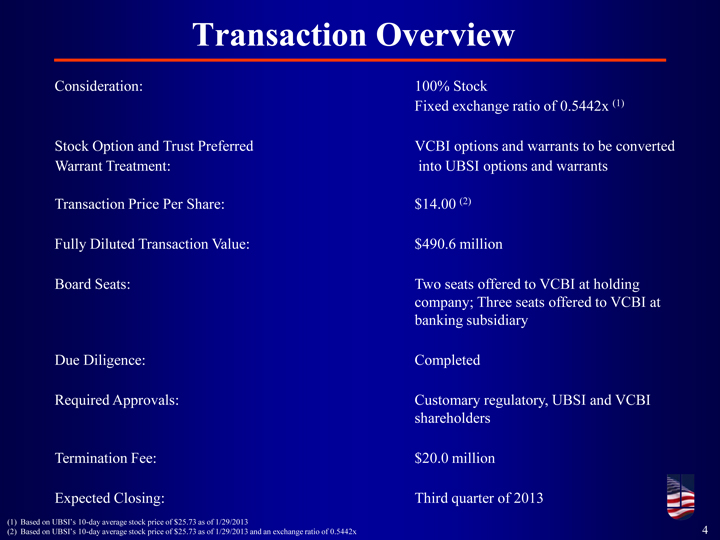
Transaction Overview
Consideration: 100% Stock
Fixed exchange ratio of 0.5442x (1)
Stock Option and Trust Preferred VCBI options and warrants to be converted Warrant Treatment: into UBSI options and warrants
Transaction Price Per Share: $14.00 (2)
Fully Diluted Transaction Value: $490.6 million
Board Seats: Two seats offered to VCBI at holding company; Three seats offered to VCBI at banking subsidiary
Due Diligence: Completed
Required Approvals: Customary regulatory, UBSI and VCBI shareholders
Termination Fee: $20.0 million
Expected Closing: Third quarter of 2013
(1) Based on UBSI’s 10-day average stock price of $25.73 as of 1/29/2013
(2) Based on UBSI’s 10-day average stock price of $25.73 as of 1/29/2013 and an exchange ratio of 0.5442x 4
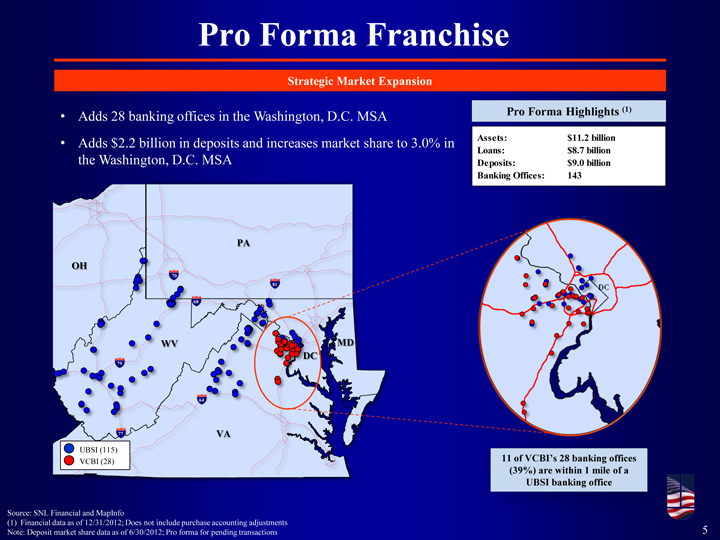
Pro Forma Franchise
Strategic Market Expansion
Pro Forma Highlights (1)
• Adds 28 banking offices in the Washington, D.C. MSA
• Adds $2.2 billion in deposits and increases market share to 3.0% in Assets: $11.2 billion
Loans: $8.7 billion
the Washington, D.C. MSA Deposits: $9.0 billion
Banking Offices: 143
PA
OH
70
81
68
WV MD DC
79
64
77 VA
UBSI (115)
VCBI (28) 11 of VCBI’s 28 banking offices
(39%) are within 1 mile of a UBSI banking office
Source: SNL Financial and MapInfo
(1) Financial data as of 12/31/2012; Does not include purchase accounting adjustments
Note: Deposit market share data as of 6/30/2012; Pro forma for pending transactions 5
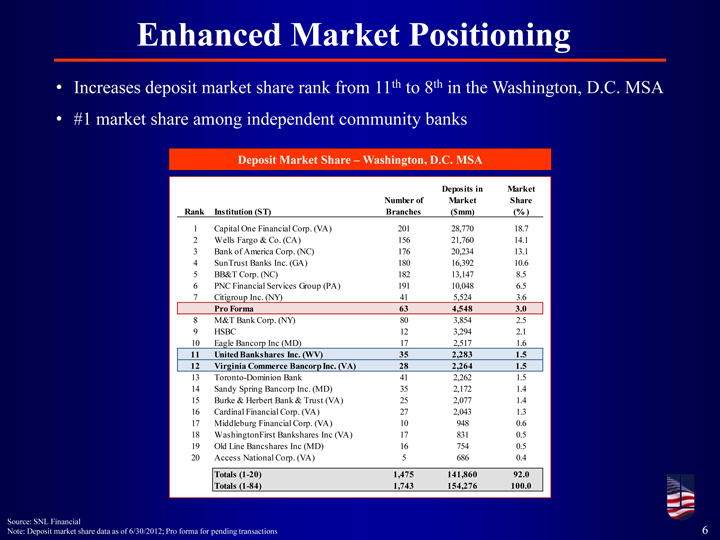
Enhanced Market Positioning
• Increases deposit market share rank from 11th to 8th in the Washington, D.C. MSA
• #1 market share among independent community banks
Deposit Market Share – Washington, D.C. MSA
Deposits in Market Number of Market Share Rank Institution (ST) Branches ($mm) (% )
1 Capital One Financial Corp. (VA) 201 28,770 18.7
2 Wells Fargo & Co. (CA) 156 21,760 14.1
3 Bank of America Corp. (NC) 176 20,234 13.1
4 SunTrust Banks Inc. (GA) 180 16,392 10.6
5 BB&T Corp. (NC) 182 13,147 8.5
6 PNC Financial Services Group (PA) 191 10,048 6.5
7 Citigroup Inc. (NY) 41 5,524 3.6
Pro Forma 63 4,548 3.0
8 M&T Bank Corp. (NY) 80 3,854 2.5
9 HSBC 12 3,294 2.1
10 Eagle Bancorp Inc (MD) 17 2,517 1.6
11 United Bankshares Inc. (WV) 35 2,283 1.5
12 Virginia Commerce Bancorp Inc. (VA) 28 2,264 1.5
13 Toronto-Dominion Bank 41 2,262 1.5
14 Sandy Spring Bancorp Inc. (MD) 35 2,172 1.4
15 Burke & Herbert Bank & Trust (VA) 25 2,077 1.4
16 Cardinal Financial Corp. (VA) 27 2,043 1.3
17 Middleburg Financial Corp. (VA) 10 948 0.6
18 WashingtonFirst Bankshares Inc (VA) 17 831 0.5
19 Old Line Bancshares Inc (MD) 16 754 0.5
20 Access National Corp. (VA) 5 686 0.4
Totals (1-20) 1,475 141,860 92.0 Totals (1-84) 1,743 154,276 100.0
Source: SNL Financial
Note: Deposit market share data as of 6/30/2012; Pro forma for pending transactions 6
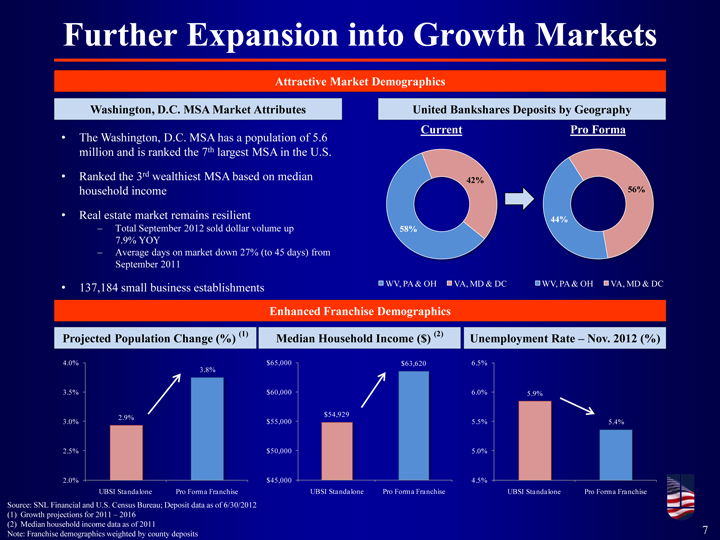
Further Expansion into Growth Markets
Attractive Market Demographics
Washington, D.C. MSA Market Attributes United Bankshares Deposits by Geography Current Pro Forma
• The Washington, D.C. MSA has a population of 5.6 million and is ranked the 7th largest MSA in the U.S.
• Ranked the 3rd wealthiest MSA based on median
42%
household income 56%
• Real estate market remains resilient 44%
– Total September 2012 sold dollar volume up 58%
7.9% YOY
– Average days on market down 27% (to 45 days) from September 2011
• 137,184 small business establishments WV, PA & OH VA, MD & DC WV, PA & OH VA, MD & DC
Enhanced Franchise Demographics
Projected Population Change (%) (1) Median Household Income ($) (2) Unemployment Rate – Nov. 2012 (%)
4.0% $65,000 $63,620 6.5%
3.5% $60,000 6.0% 5.9%
$54,929 %
3.0 $55,000 5.5% 5.4%
2.5 $50,000 5.0%
2.0 $45,000 4.5% alone P e UBSI Standalone Pro Forma Franchise UBSI Standalone Pro Forma Franchise
Source: SNL Financ s Bureau; Dep 0/2012 (1) Growth projections for 2011 – 2016 (2) Median household income data as of 2011
Note: Franchise demographics weighted by county deposits 7
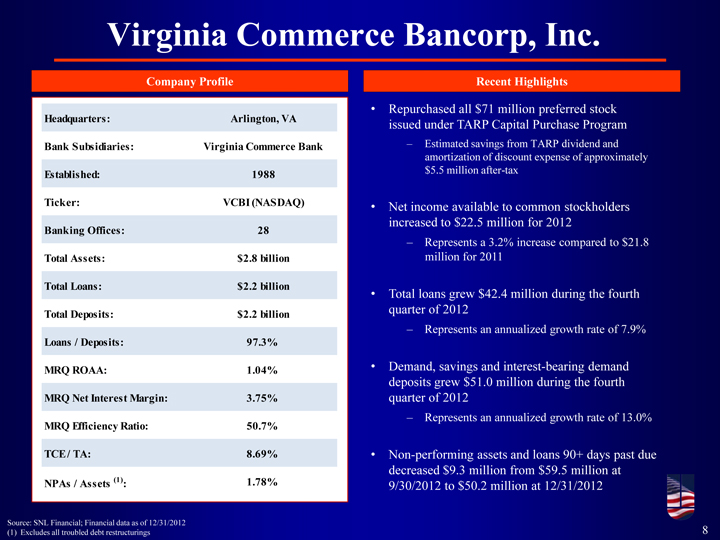
Virginia Commerce Bancorp, Inc.
Company Profile Recent Highlights
Headquarters: Arlington, VA • Repurchased all $71 million preferred stock issued under TARP Capital Purchase Program
Bank Subsidiaries: Virginia Commerce Bank – Estimated savings from TARP dividend and amortization of discount expense of approximately Established: 1988 $5.5 million after-tax
Ticker: VCBI (NASDAQ) • Net income available to common stockholders increased to $22.5 million for 2012
Banking Offices: 28
– Represents a 3.2% increase compared to $21.8
Total Assets: $2.8 billion million for 2011
Total Loans: $2.2 billion
• Total loans grew $42.4 million during the fourth
Total Deposits: $2.2 billion quarter of 2012
– Represents an annualized growth rate of 7.9%
Loans / Deposits: 97.3%
MRQ ROAA: 1.04% • Demand, savings and interest-bearing demand deposits grew $51.0 million during the fourth
MRQ Net Interest Margin: 3.75% quarter of 2012
– Represents an annualized growth rate of 13.0%
MRQ Efficiency Ratio: 50.7%
TCE / TA: 8.69% • Non-performing assets and loans 90+ days past due decreased $9.3 million from $59.5 million at
NPAs / Assets (1): 1.78%
9/30/2012 to $50.2 million at 12/31/2012
Source: SNL Financial; Financial data as of 12/31/2012
(1) Excludes all troubled debt restructurings 8
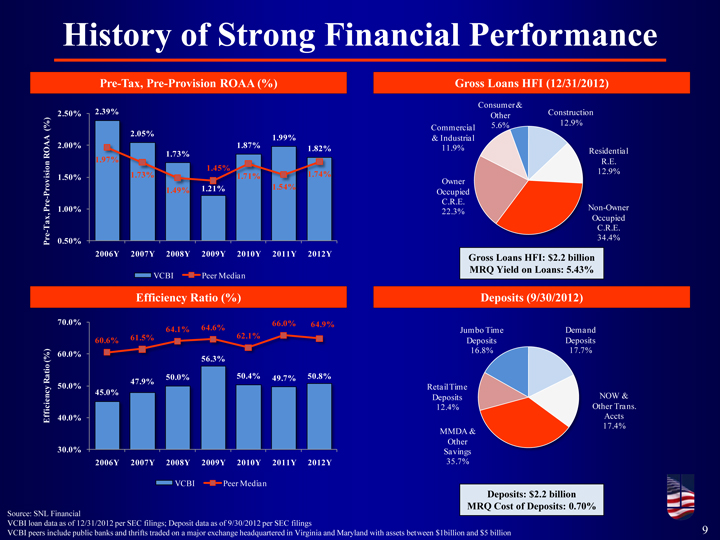
History of Strong Financial Performance
Pre-Tax, Pre-Provision ROAA (%) Gross Loans HFI (12/31/2012)
Consumer &
2.50% 2.39% Construction Other 12.9% ( %) Commercial 5.6%
A 2.05% 1.99% & Industrial OA 2.00% 1.87% 1.82% 11.9%
1.73% Residential
R 1.97% n R.E.
1.45% 12.9% isio 1.50% 1.73% 1.71% 1.74% o v 1.54% Owner
Pr 1.49% 1.21% Occupied
—C.R.E.
Pre 1.00% Non-Owner
, 22.3% Occupied
T ax
C.R.E.
-
Pre 0.50% 34.4% 2006Y 2007Y 2008Y 2009Y 2010Y 2011Y 2012Y Gross Loans HFI: $2.2 billion MRQ Yield on Loans: 5.43%
VCBI Peer Median
Efficiency Ratio (%) Deposits (9/30/2012)
70.0% 66.0% 64.9%
64.1% 64.6% Jumbo Time Demand
61.5% 62.1%
60.6% Deposits Deposits
16.8% 17.7%
60.0%
(%) 56.3% at io
50.0% 50.4% 49.7% 50.8% R 47.9% y 50.0% Retail Time nc 45.0% NOW &
Deposits i e c ffi 12.4% Other Trans.
40.0% Accts E
17.4% MMDA & Other
30.0% Savings
2006Y 2007Y 2008Y 2009Y 2010Y 2011Y 2012Y 35.7%
VCBI Peer Median
Deposits: $2.2 billion Source: SNL Financial MRQ Cost of Deposits: 0.70%
VCBI loan data as of 12/31/2012 per SEC filings; Deposit data as of 9/30/2012 per SEC filings
VCBI peers include public banks and thrifts traded on a major exchange headquartered in Virginia and Maryland with assets between $1billion and $5 billion 9
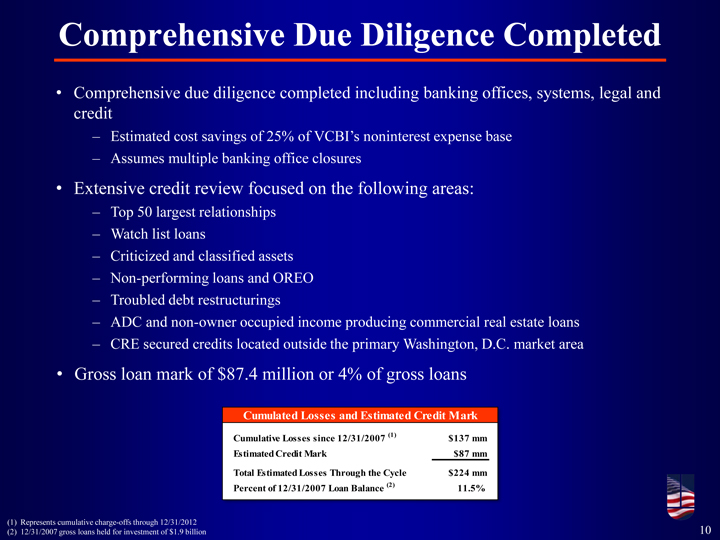
Comprehensive Due Diligence Completed
• Comprehensive due diligence completed including banking offices, systems, legal and credit
– Estimated cost savings of 25% of VCBI’s noninterest expense base
– Assumes multiple banking office closures
• Extensive credit review focused on the following areas:
– Top 50 largest relationships
– Watch list loans
– Criticized and classified assets
– Non-performing loans and OREO
– Troubled debt restructurings
– ADC and non-owner occupied income producing commercial real estate loans
– CRE secured credits located outside the primary Washington, D.C. market area
• Gross loan mark of $87.4 million or 4% of gross loans
Cumulated Losses and Estimated Credit Mark
Cumulative Losses since 12/31/2007 (1) $137 mm Estimated Credit Mark $87 mm
Total Estimated Losses Through the Cycle $224 mm Percent of 12/31/2007 Loan Balance (2) 11.5%
(1) Represents cumulative charge-offs through 12/31/2012
(2) 12/31/2007 gross loans held for investment of $1.9 billion 10
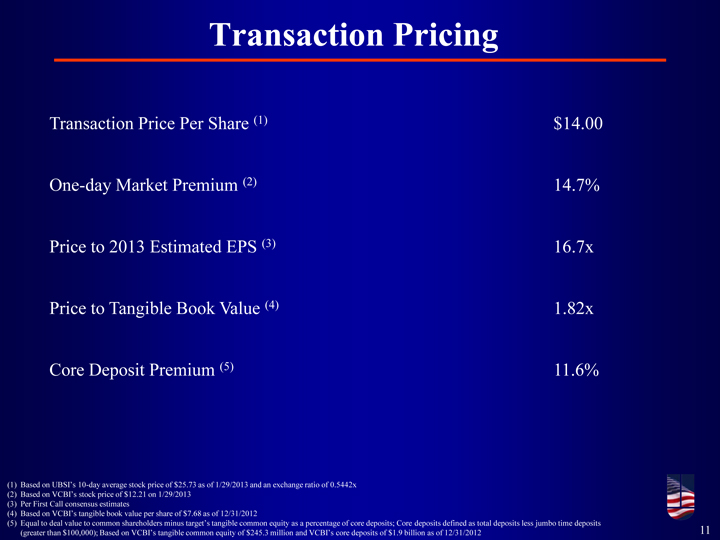
Transaction Pricing
Transaction Price Per Share (1) $14.00
One-day Market Premium (2) 14.7%
Price to 2013 Estimated EPS (3) 16.7x Price to Tangible Book Value (4) 1.82x Core Deposit Premium (5) 11.6%
(1) Based on UBSI’s 10-day average stock price of $25.73 as of 1/29/2013 and an exchange ratio of 0.5442x
(2) Based on VCBI’s stock price of $12.21 on 1/29/2013 (3) Per First Call consensus estimates
(4) Based on VCBI’s tangible book value per share of $7.68 as of 12/31/2012
(5) Equal to deal value to common shareholders minus target’s tangible common equity as a percentage of core deposits; Core deposits defined as total deposits less jumbo time deposits
(greater than $100,000); Based on VCBI’s tangible common equity of $245.3 million and VCBI’s core deposits of $1.9 billion as of 12/31/2012 11
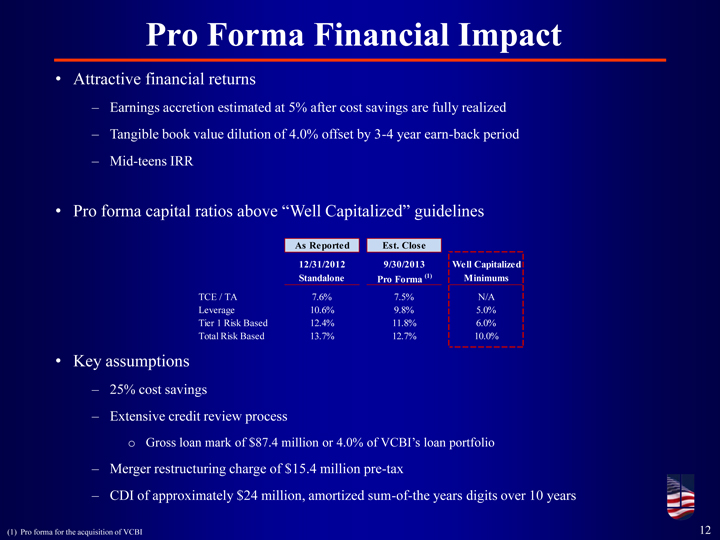
Pro Forma Financial Impact
• Attractive financial returns
– Earnings accretion estimated at 5% after cost savings are fully realized
– Tangible book value dilution of 4.0% offset by 3-4 year earn-back period
– Mid-teens IRR
• Pro forma capital ratios above “Well Capitalized” guidelines
As Reported Est. Close
12/31/2012 9/30/2013 Well Capitalized Standalone Pro Forma (1) Minimums
TCE / TA 7.6% 7.5% N/A Leverage 10.6% 9.8% 5.0% Tier 1 Risk Based 12.4% 11.8% 6.0% Total Risk Based 13.7% 12.7% 10.0%
• Key assumptions
– 25% cost savings
– Extensive credit review process o Gross loan mark of $87.4 million or 4.0% of VCBI’s loan portfolio
– Merger restructuring charge of $15.4 million pre-tax
– CDI of approximately $24 million, amortized sum-of-the years digits over 10 years
(1) Pro forma for the acquisition of VCBI 12
Proven Acquiror
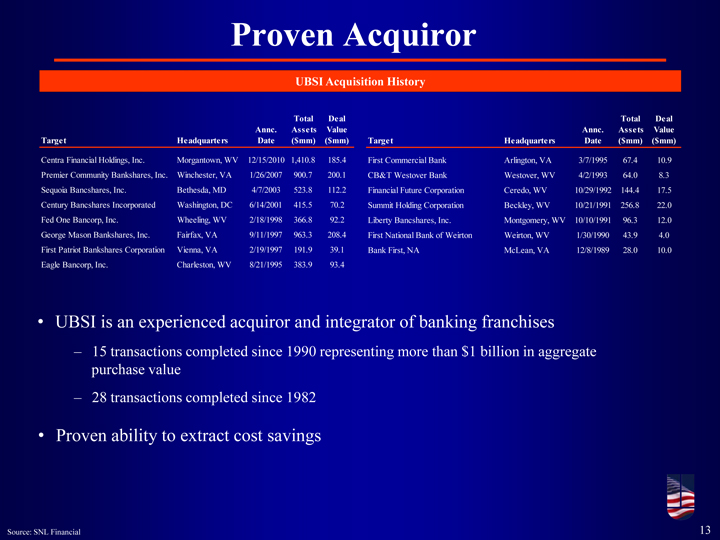
UBSI Acquisition History
Total Deal Total Deal Annc. Assets Value Annc. Assets Value Target Headquarters Date ($mm) ($mm) Target Headquarters Date ($mm) ($mm)
Centra Financial Holdings, Inc. Morgantown, WV 12/15/2010 1,410.8 185.4 First Commercial Bank Arlington, VA 3/7/1995 67.4 10.9 Premier Community Bankshares, Inc. Winchester, VA 1/26/2007 900.7 200.1 CB&T Westover Bank Westover, WV 4/2/1993 64.0 8.3 Sequoia Bancshares, Inc. Bethesda, MD 4/7/2003 523.8 112.2 Financial Future Corporation Ceredo, WV 10/29/1992 144.4 17.5 Century Bancshares Incorporated Washington, DC 6/14/2001 415.5 70.2 Summit Holding Corporation Beckley, WV 10/21/1991 256.8 22.0 Fed One Bancorp, Inc. Wheeling, WV 2/18/1998 366.8 92.2 Liberty Bancshares, Inc. Montgomery, WV 10/10/1991 96.3 12.0 George Mason Bankshares, Inc. Fairfax, VA 9/11/1997 963.3 208.4 First National Bank of Weirton Weirton, WV 1/30/1990 43.9 4.0 First Patriot Bankshares Corporation Vienna, VA 2/19/1997 191.9 39.1 Bank First, NA McLean, VA 12/8/1989 28.0 10.0 Eagle Bancorp, Inc. Charleston, WV 8/21/1995 383.9 93.4
• UBSI is an experienced acquiror and integrator of banking franchises
– 15 transactions completed since 1990 representing more than $1 billion in aggregate purchase value
– 28 transactions completed since 1982
• Proven ability to extract cost savings
Source: SNL Financial 13
Summary
• Acquisition of a high performing, in market competitor
• Enhances footprint in highly attractive markets of Northern Virginia and
Washington, D.C.
• Financially attractive
– Significantly accretive to first full year EPS
– Double digit IRR in excess of UBSI’s cost of capital
– Minimal tangible book value dilution with short earn-back period
• Low risk transaction
– In market transaction with conservative cost savings assumptions
– Proven acquiror
14