Attached files
| file | filename |
|---|---|
| 8-K - FORM 8-K - ManpowerGroup Inc. | form_8-k.htm |
| EX-99.1 - PRESS RELEASE DATED JANUARY 30, 2013 - ManpowerGroup Inc. | exhibit_99-1.htm |
Exhibit 99.2

ManpowerGroup
4th Quarter
January 30, 2013

ManpowerGroup 2012 4th Quarter Results January 2013
Forward-Looking Statement
This presentation includes forward-looking statements,
including earnings projections which are subject to risks and
uncertainties. Actual results might differ materially from those
projected in the forward-looking statements. Additional
information concerning factors that could cause actual
results to materially differ from those in the forward-looking
statements is contained in the Manpower Inc. Annual Report
on Form 10-K dated December 31, 2011, which information
is incorporated herein by reference, and such other factors
as may be described from time to time in the Company’s
SEC filings.
ManpowerGroup 2012 4th Quarter Results January 2013
|
As
Reported
|
Excluding Non
-recurring Items |
Q4 Financial Highlights
|
|
5%
|
5%
|
Revenue $5.2B
|
|
4% CC
|
4% CC
|
|
|
20 bps
|
20 bps
|
Gross Margin 16.9%
|
|
19%
|
12%
|
Operating Profit $105M
|
|
17% CC
|
11% CC
|
|
|
40 bps
|
20 bps
|
OP Margin 2.0%
|
|
13%
|
7%
|
EPS $.68
|
|
12% CC
|
6% CC
|
Throughout this presentation, the difference between reported variances and Constant Currency (CC) variances
represents the impact of currency on our financial results. Constant Currency is further explained on our Web site.
represents the impact of currency on our financial results. Constant Currency is further explained on our Web site.
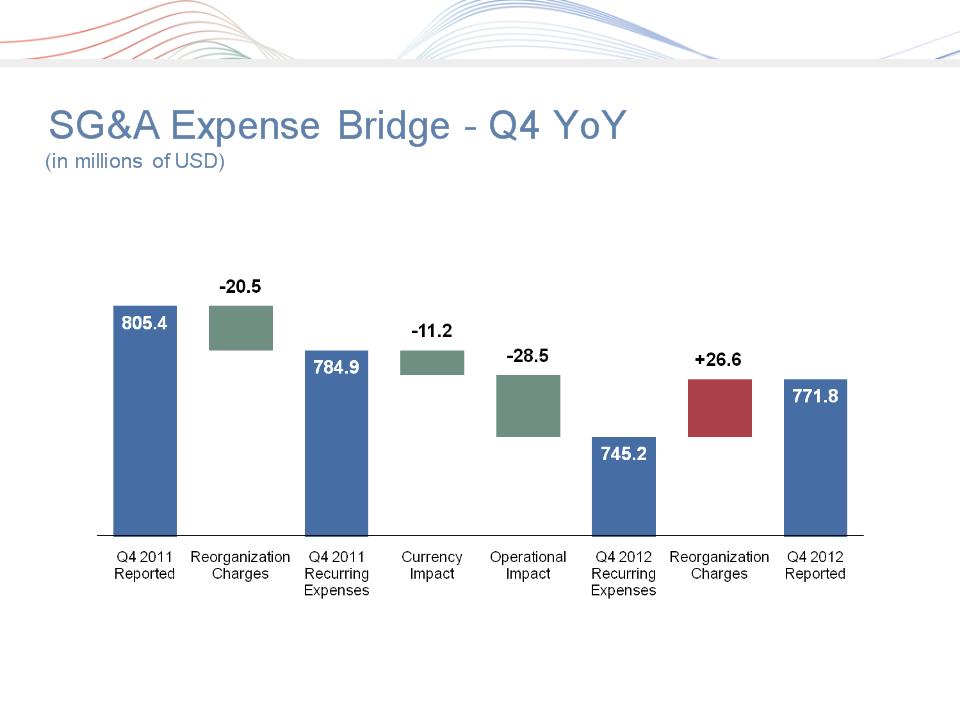
Consolidated Financial Highlights
3
(1) Excludes the impact of reorganization charges of $26.6M in Q4 2012 and $20.5M in Q4 2011.
(1)
ManpowerGroup 2012 4th Quarter Results January 2013
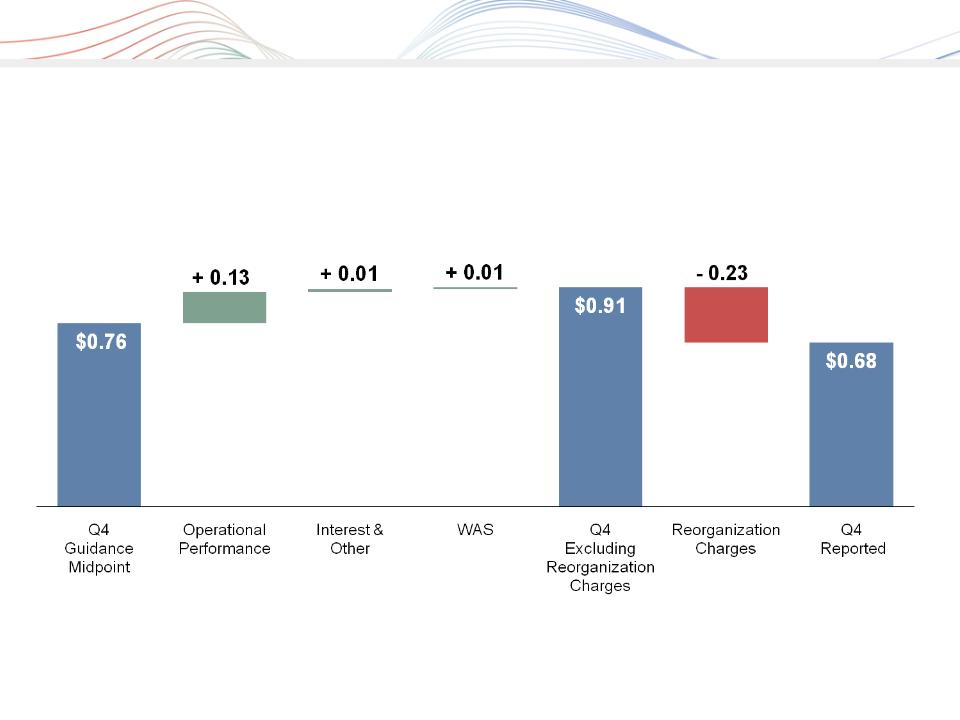
EPS Bridge - Q4 vs. Guidance Midpoint
4

ManpowerGroup 2012 4th Quarter Results January 2013
Non-Recurring Items
(in millions of USD, except per share amounts)
5
(1) Includes reorganization charges as follows:
Q4 2012: Americas ($1.0M), Southern Europe ($2.8M), Northern Europe ($11.5M), APME ($0.4M), Right Management ($0.5M), Corporate ($10.4M)
FY 2012: Americas ($9.3M), Southern Europe ($2.8M), Northern Europe ($11.5M), APME ($0.4M), Right Management ($10.9M), Corporate ($10.4M)
FY 2011: Americas ($2.4M), Northern Europe ($12.0M), Right Management ($6.1M)
|
|
Q4 2012
|
FY 2012
|
FY 2011
|
||||||
|
|
Pre-tax
Earnings
|
Net
Earnings
|
EPS -
Diluted
|
Pre-tax
Earnings
|
Net
Earnings
|
EPS -
Diluted
|
Pre-tax
Earnings
|
Net
Earnings
|
EPS -
Diluted
|
|
Earnings, As Reported
|
$94.8
|
$ 53.3
|
$ 0.68
|
$ 368.4
|
$ 197.6
|
$ 2.47
|
$ 479.9
|
$ 251.6
|
$ 3.04
|
|
Reorganization Charges
|
26.6
|
18.3
|
0.23
|
45.4
|
32.1
|
0.40
|
20.5
|
16.3
|
0.20
|
|
Legal Costs - US
|
-
|
-
|
-
|
10.0
|
6.5
|
0.08
|
-
|
-
|
-
|
|
Earnings, Excluding non
-recurring items |
$ 121.4
|
$ 71.6
|
$ 0.91
|
$ 423.8
|
$ 236.2
|
$ 2.95
|
$ 500.4
|
$ 267.9
|
$ 3.24
|
(1)
ManpowerGroup 2012 4th Quarter Results January 2013
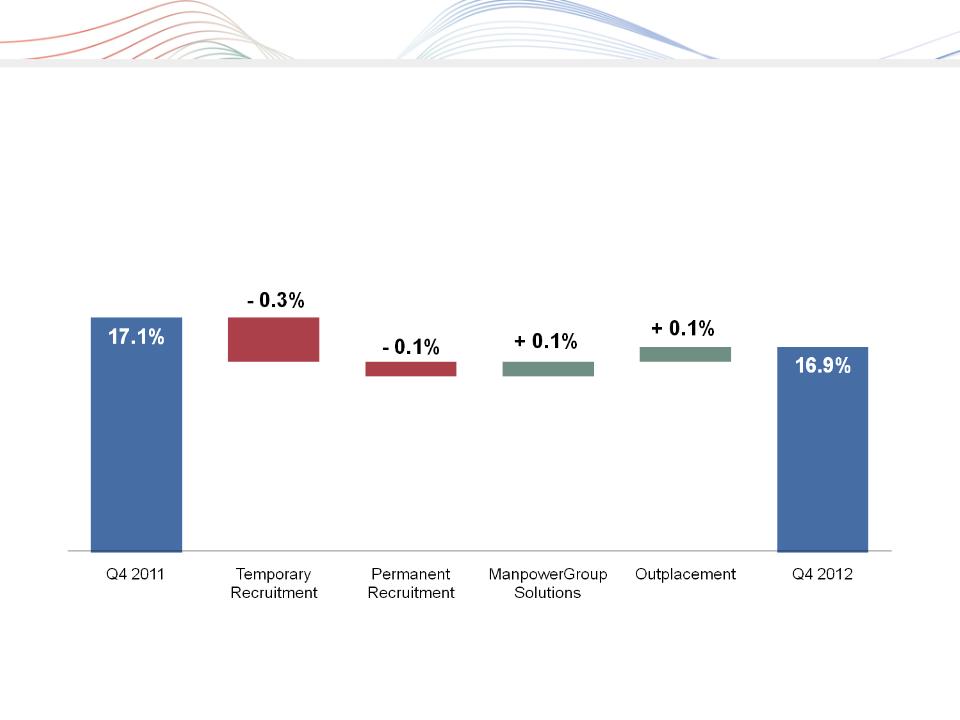
Consolidated Gross Margin Change
6
ManpowerGroup 2012 4th Quarter Results January 2013
7
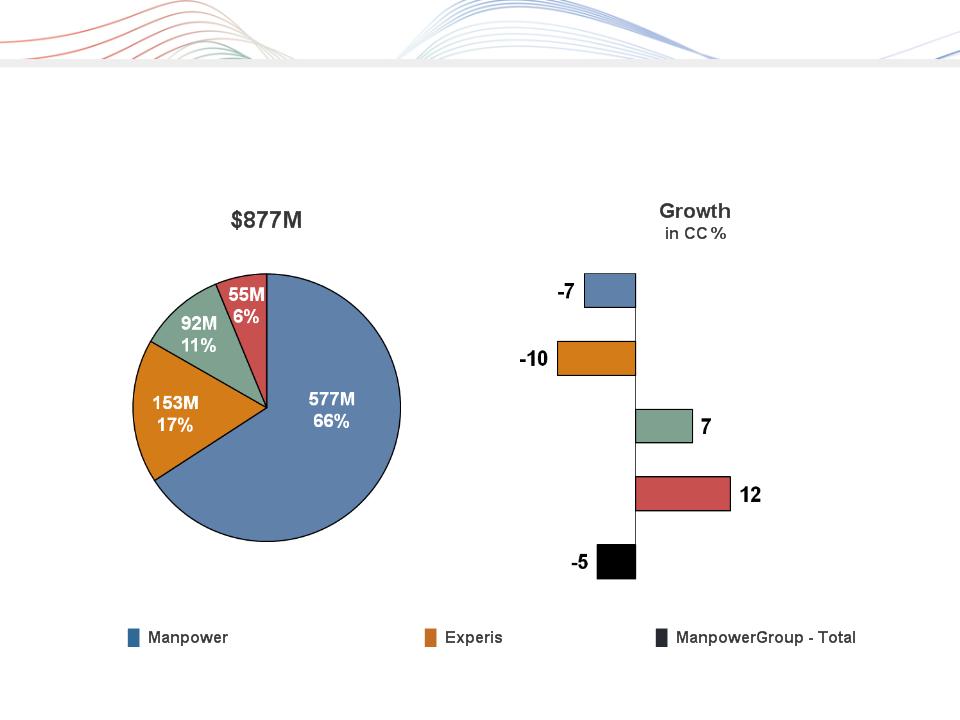
Business Line Gross Profit - Q4 2012
█ ManpowerGroup Solutions █ Right Management
ManpowerGroup 2012 4th Quarter Results January 2013
8
ManpowerGroup 2012 4th Quarter Results January 2013
|
As
Reported
|
Excluding
Non-recurring
Items |
Q4 Financial Highlights
|
|
0%
|
0%
|
Revenue $1.2B
|
|
0% CC
|
0% CC
|
|
|
7%
|
10%
|
OUP $36M
|
|
8% CC
|
11% CC
|
|
|
20 bps
|
30 bps
|
OUP Margin 3.1%
|
9
(1)
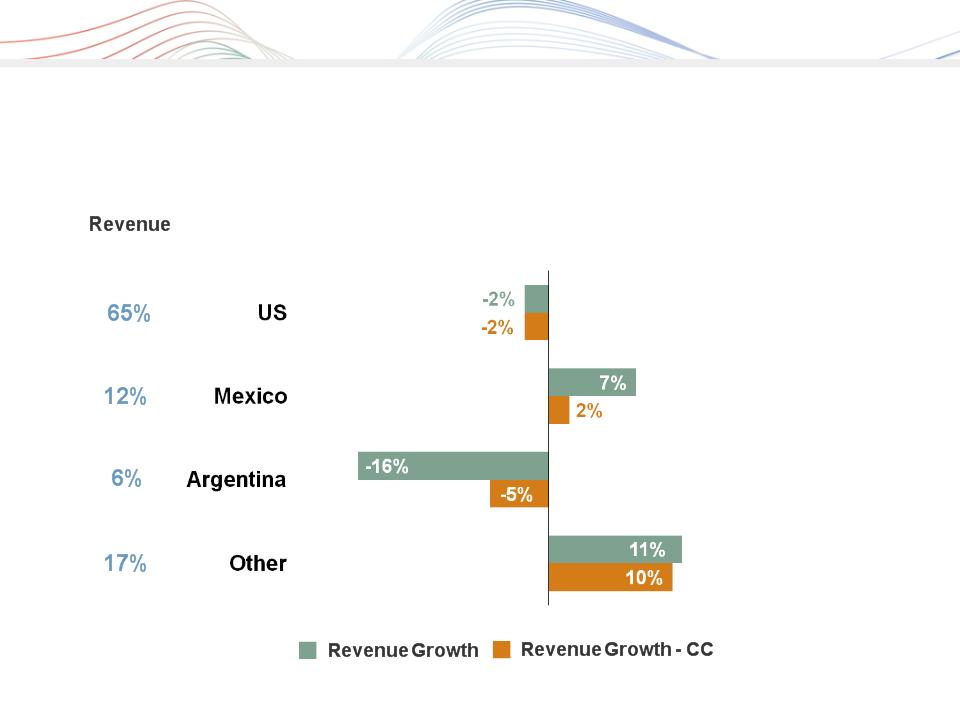
Americas Segment
(22% of Revenue)
(1) Included in these amounts is the US, which had revenue of $751M (-2%) and OUP of $22M (-17%, or
-20% excluding reorganization charges in Q4 2012 and Q4 2011).
-20% excluding reorganization charges in Q4 2012 and Q4 2011).
(2) Excludes the impact of reorganization charges of $1.0M in Q4 2012 and $2.4M in Q4 2011.
Operating Unit Profit (OUP) is the measure that we use to evaluate segment performance. OUP is
equal to segment revenues less direct costs and branch and national headquarters operating
costs.
equal to segment revenues less direct costs and branch and national headquarters operating
costs.
(2)
ManpowerGroup 2012 4th Quarter Results January 2013
Americas - Q4 Revenue Growth YoY
10
% of Segment
ManpowerGroup 2012 4th Quarter Results January 2013
|
As
Reported
|
Excluding
Non-recurring
Items |
Q4 Financial Highlights
|
|
12%
|
12%
|
Revenue $1.8B
|
|
8% CC
|
8% CC
|
|
|
34%
|
28%
|
OUP $28M
|
|
31% CC
|
24% CC
|
|
|
50 bps
|
30 bps
|
OUP Margin 1.6%
|
11
(1)
Southern Europe Segment
(34% of Revenue)
(1) Included in these amounts is France, which had revenue of $1.3B (-9% CC) and OUP of $18M (-8% CC, or -1%
excluding reorganization charges in Q4 2012). On an organic basis, France revenue decreased 10% in CC. On
an organic basis, Segment revenue decreased 9% in CC.
excluding reorganization charges in Q4 2012). On an organic basis, France revenue decreased 10% in CC. On
an organic basis, Segment revenue decreased 9% in CC.
(2) Excludes the impact of reorganization charges of $2.8M in Q4 2012.
(2)
ManpowerGroup 2012 4th Quarter Results January 2013
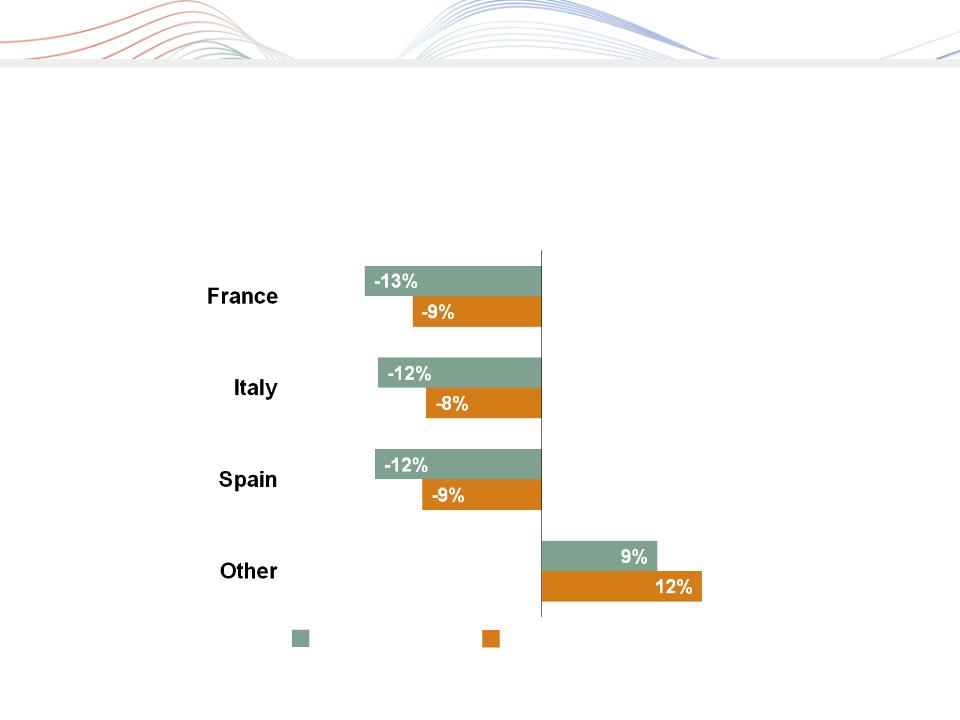
Southern Europe - Q4 Revenue Growth YoY
12
Revenue Growth - CC
Revenue Growth
% of Segment
Revenue
74%
15%
5%
6%
(1)
(1) On an organic basis, France revenue decreased 14% (-10% in CC).
ManpowerGroup 2012 4th Quarter Results January 2013
|
As
Reported
|
Excluding
Non-recurring
Items |
Q4 Financial Highlights
|
|
3%
|
3%
|
Revenue $1.5B
|
|
3% CC
|
3% CC
|
|
|
34%
|
28%
|
OUP $34M
|
|
34% CC
|
28% CC
|
|
|
110 bps
|
100 bps
|
OUP Margin 2.3%
|
13
Northern Europe Segment
(29% of Revenue)
(1)
(1) Excludes the impact of reorganization charges of $11.5M in Q4 2012 and $12.0M in Q4 2011.
ManpowerGroup 2012 4th Quarter Results January 2013
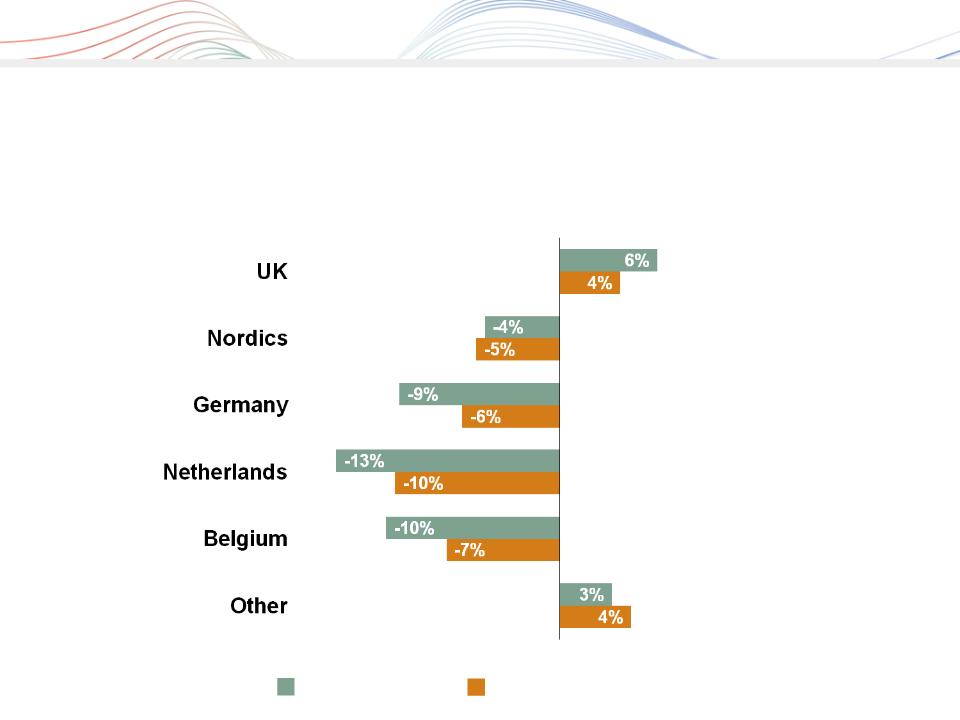
Northern Europe - Q4 Revenue Growth YoY
14
Revenue Growth - CC
Revenue Growth
% of Segment
Revenue
26%
24%
12%
10%
21%
7%
ManpowerGroup 2012 4th Quarter Results January 2013
|
As
Reported
|
Excluding
Non-recurring
Items |
Q4 Financial Highlights
|
|
0%
|
0%
|
Revenue $698M
|
|
1% CC
|
1% CC
|
|
|
31%
|
33%
|
OUP $28M
|
|
33% CC
|
35% CC
|
|
|
100 bps
|
100 bps
|
OUP Margin 4.1%
|
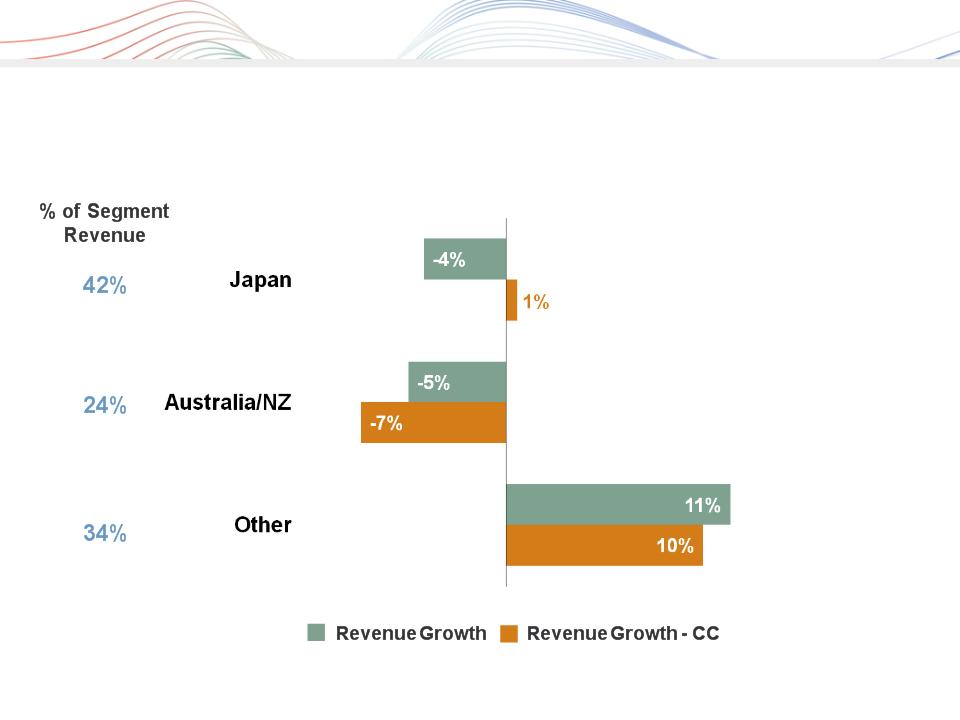
APME Segment
(13% of Revenue)
15
(1)
(1) Excludes the impact of reorganization charges of $0.4M in Q4 2012.
ManpowerGroup 2012 4th Quarter Results January 2013
APME - Q4 Revenue Growth YoY
16
ManpowerGroup 2012 4th Quarter Results January 2013
17
Right Management Segment
(2% of Revenue)
|
As
Reported
|
Excluding
Non-recurring
Items |
Q4 Financial Highlights
|
|
6%
|
6%
|
Revenue $85M
|
|
7% CC
|
7% CC
|
|
|
N/A
|
N/A
|
OUP $8M
|
|
N/A
|
N/A
|
|
|
1670 bps
|
960 bps
|
OUP Margin 9.7%
|
(1)
(1) Excludes the impact of reorganization charges of $0.5M in Q4 2012 and $6.1M in Q4 2011.

ManpowerGroup 2012 4th Quarter Results January 2013
|
($ in millions)
|
2012
|
|
2011
|
|
Cash provided by operating activities
|
332
|
|
69
|
|
Capital Expenditures
|
(72)
|
|
(65)
|
|
Free Cash Flow
|
260
|
|
4
|
|
Change in Debt
|
42
|
|
15
|
|
Share Repurchases
|
(138)
|
|
(105)
|
|
Dividends paid
|
(68)
|
|
(65)
|
|
Acquisitions of Businesses, net
|
(49)
|
|
(49)
|
|
Effect of Exchange Rate Changes
|
18
|
|
(28)
|
|
Other
|
3
|
|
36
|
|
Change in Cash
|
68
|
|
(192)
|
|
|
|
|
|
|
|
|
|
|
Cash Flow Summary - Full Year
18
ManpowerGroup 2012 4th Quarter Results January 2013
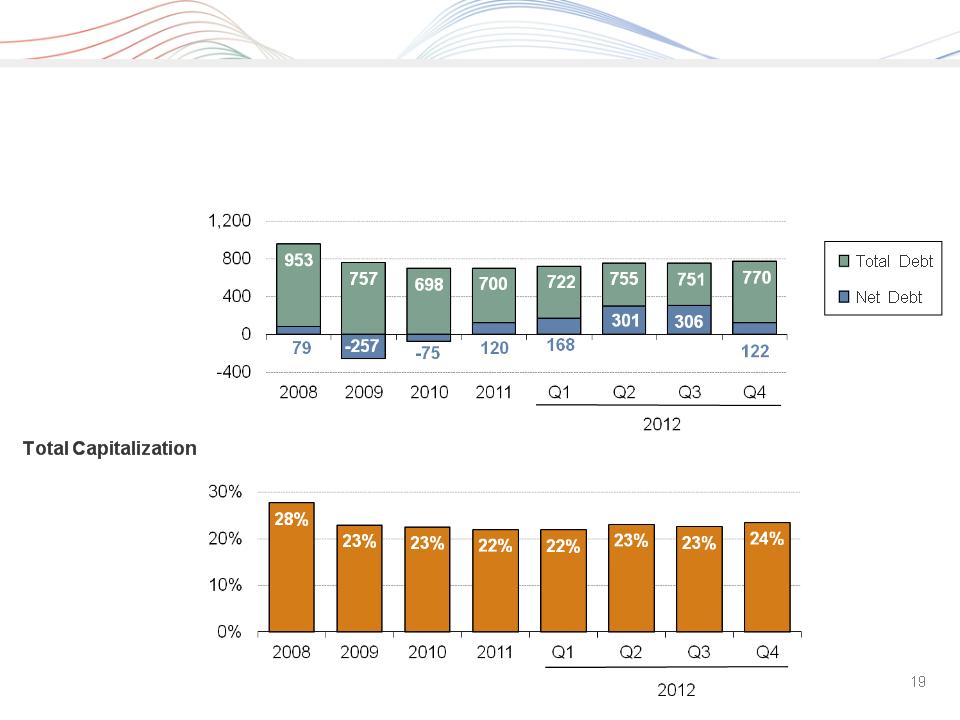
Balance Sheet Highlights
Total Debt
($ in millions)
Total Debt to

ManpowerGroup 2012 4th Quarter Results January 2013
|
|
Interest
Rate
|
Maturity
Date
|
Total
Outstanding
at 12/31/12 |
|
Remaining
Available
at 12/31/12
|
|
|
Euro Notes:
|
|
|
|
|
|
|
|
- Euro 200M
|
4.86%
|
Jun 2013
|
264
|
|
-
|
|
|
- Euro 350M
|
4.505%
|
Jun 2018
|
462
|
|
-
|
|
|
Revolving Credit Agreement
|
1.48%
|
Oct 2016
|
-
|
|
799
|
|
|
Uncommitted lines and Other
|
Various
|
Various
|
44
|
|
335
|
|
|
Total Debt
|
|
|
770
|
|
1,134
|
Credit Facilities
($ in millions)
($ in millions)
20
Represents subsidiary uncommitted lines of credit & overdraft facilities, which total $379.4M. Total subsidiary borrowings are
limited to $300M due to restrictions in our Revolving Credit Facility, with the exception of Q3 when subsidiary borrowings are
limited to $600M.
limited to $300M due to restrictions in our Revolving Credit Facility, with the exception of Q3 when subsidiary borrowings are
limited to $600M.
(1)
(2)
(2)
(1)
The $800M agreement requires that we comply with a Leverage Ratio (Debt-to-EBITDA) of not greater than 3.5 to 1 and a
Fixed Charge Coverage Ratio of not less than 1.5 to 1, in addition to other customary restrictive covenants. As defined in the
agreement, we had a Debt-to-EBITDA ratio of 0.97 and a fixed charge coverage ratio of 2.82 as of December 31, 2012. As
of December 31, 2012, there were $0.9M of standby letters of credit issued under the agreement.

ManpowerGroup 2012 4th Quarter Results January 2013
|
Revenue
|
Total
|
Down 6-8% (Down 6-8% CC)
|
|
|
Americas
|
Down 2-4% (Down 1-3% CC)
|
|
|
Southern Europe
|
Down 10-12% (Down 11-13% CC)
|
|
|
Northern Europe
|
Down 5-7% (Down 6-8% CC)
|
|
|
APME
|
Down 6-8% (Down 1-3% CC)
|
|
Right Management
|
Up 2-4% (Up 2-4% CC)
|
|
|
Gross Profit Margin
|
16.6 - 16.8%
|
|
|
Operating Profit Margin
|
1.4 - 1.6%
|
|
|
Tax Rate
|
41%
|
|
|
EPS (before reorganization charges)
|
$0.40 - $0.48 (no currency impact)
|
|
First Quarter Outlook
21
(36% excl. reclassification of France business tax
and 2012 WOTC credit)
and 2012 WOTC credit)
ManpowerGroup 2012 4th Quarter Results January 2013
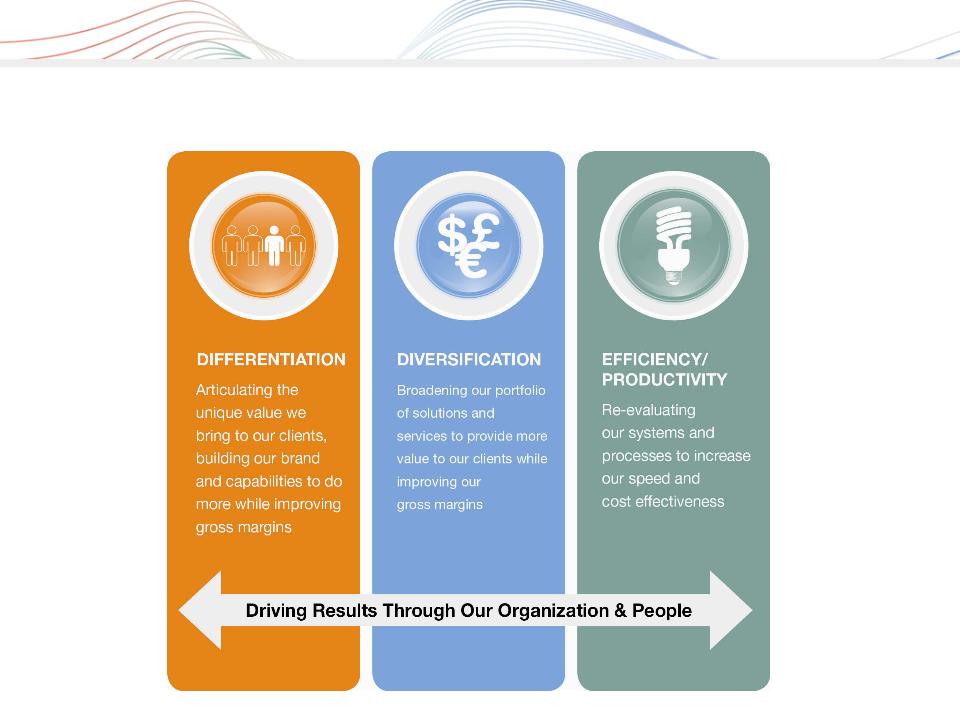
Strategic Drivers
22

ManpowerGroup 2012 4th Quarter Results January 2013
ManpowerGroup 2012 4th Quarter Results January 2013
Questions
23