Attached files
| file | filename |
|---|---|
| 8-K - 8-K CURRENT REPORT - IEC ELECTRONICS CORP | v333202_8k.htm |
| EX-99.2 - EXHIBIT 99.2 - IEC ELECTRONICS CORP | v333202_ex99-2.htm |
Exhibit 99.1
SLIDES TO BE PRESENTED AT ANNUAL MEETING OF STOCKHOLDERS HELD JANUARY 30, 2013

2012 2012 Shareholder meeting January 30, 2013
2 Agenda ▪ Review 2012 ▪ Financial Results ▪ Looking Forward

Forward Looking Statements This presentation contains certain forward - looking statements related to the Company’s expectations and prospects that involve risks and uncertainties, including uncertainties associated with economic conditions in the electronics industry, particularly in the principal industry sectors served by the Company, changes in customer requirements and in the volume of sales to principal customers, competition and technological change, the ability of the Company to control manufacturing and operating costs, the ability of the Company to develop and maintain satisfactory relationships with vendors, and the ability of the Company to efficiently integrate acquired companies into its business. The Company's actual results of operations may differ significantly from those contemplated by any forward - looking statements as a result of these and other factors, including factors set forth in the Company's 2012 Annual Report on Form 10 - K and in other filings with the Securities and Exchange Commission, all of which may be found in the Investor Relations section of the Company’s website at www.iec - electronics.com. The Company undertakes no obligation to publicly update or revise forward - looking information, whether as a result of new, updated information, future events or otherwise. In addition, references to non - GAAP financial measures in this presentation are reconciled to GAAP in the Investor Relations section of the Company’s website, www.iec - electronics.com.

4 Opening Remarks ▪ 2012 Summary: – Sales reached $145 million – 9% growth over fiscal 2011 – On those sales we generated some of the strongest financial results in the entire industry ▪ Operating income increased 17% ▪ EBITDA increased 20% ▪ Numerous new projects from existing customers

5 Opening Remarks (continued) ▪ Our balance sheet continued to strengthen. We reduced our net debt from $35.1 million to $24.9 million – Less than 1.5x EBITDA ▪ Second year in a row on the Forbes list of Top 100 Best Small Companies – this year #6
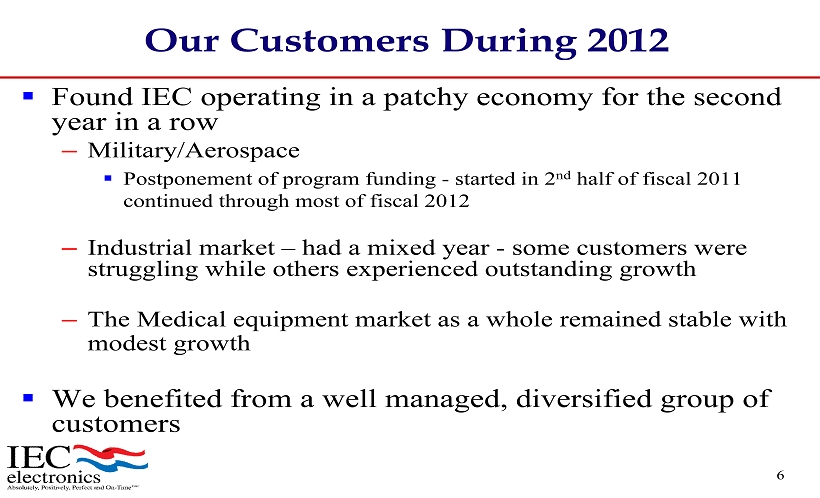
6 Our Customers During 2012 ▪ Found IEC operating in a patchy economy for the second year in a row – Military/Aerospace ▪ Postponement of program funding - started in 2 nd half of fiscal 2011 continued through most of fiscal 2012 – Industrial market – had a mixed year - some customers were struggling while others experienced outstanding growth – The Medical equipment market as a whole remained stable with modest growth ▪ We benefited from a well managed, diversified group of customers

7 Introductions and Shareholder Vote ▪ Board of Directors ▪ Management Team ▪ Public Accountant and Legal Counsel ▪ Shareholder Vote

8 2012 Year in Review Vince Leo, Chief Financial Officer

9 51,092 67,811 96,674 133,296 144,963 $0 $20,000 $40,000 $60,000 $80,000 $100,000 $120,000 $140,000 2008 2009 2010 2011 2012 Net Sales (in $000's) Sustained Year Over Year Growth

10 Continued Growth in Operating Income 2.4 4.8 7.7 10.4 12.2 4.7% 7.1% 8.0% 7.8% 8.4% 0.0 2.0 4.0 6.0 8.0 10.0 12.0 14.0 2008 2009 2010 2011 2012 0.0% 1.0% 2.0% 3.0% 4.0% 5.0% 6.0% 7.0% 8.0% 9.0% $ in Millions Operating Income % of Sales

11 Strong P&L Results (stated in 000s except EPS) 2011 2012 Increase Total Revenue 133,296$ 144,963$ 9% Cost of Revenue 107,539 117,007 Gross Profit 25,757 27,956 9% Gross Profit as % of Revenue 19.3% 19.3% Selling and Administrative 15,368 15,765 Operating Income 10,389 12,191 17% Operating Income as % of Revenue 7.8% 8.4% Other (Income)Expense, Net (1,028) (1,050) Interest Expense 1,601 1,227 Income before Tax 9,816 12,014 22% Income Tax Expense 3,056 4,254 Net Income 6,760$ 7,760$ 15% EPS - Diluted $0.68 $0.78 15% Both years benefited from the clawback this year it will not exist

12 Financial Results: Comparative Cash Flows (stated in 000s) Increase (Decrease) 2011 2012 $ $ % EBITDA 14,674$ 17,538$ 2,864$ - 20% Net Debt 35,109$ 24,975$ - (10,134)$ 29% EBITDA/Debt Coverage 2.4X 1.4X * EBITDA reconciliation to GAAP is available at www.iec - electronics.com *

13 Barry Gilbert Looking Forward
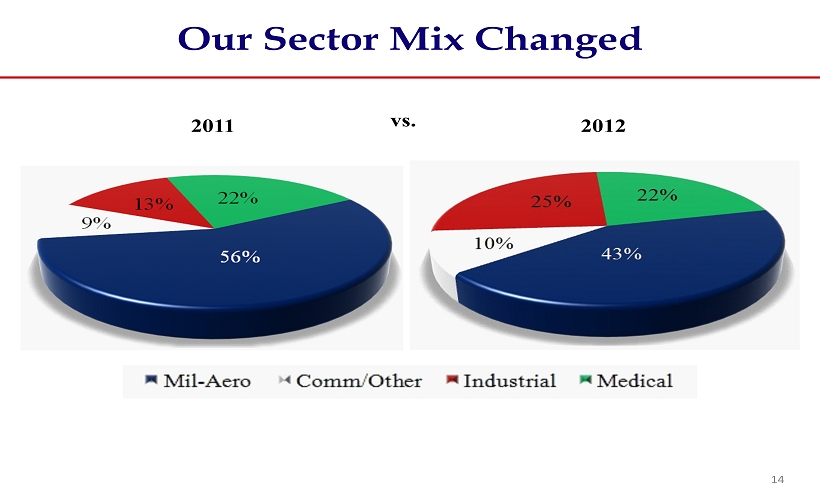
14 vs. Our Sector Mix Changed 2012 2011
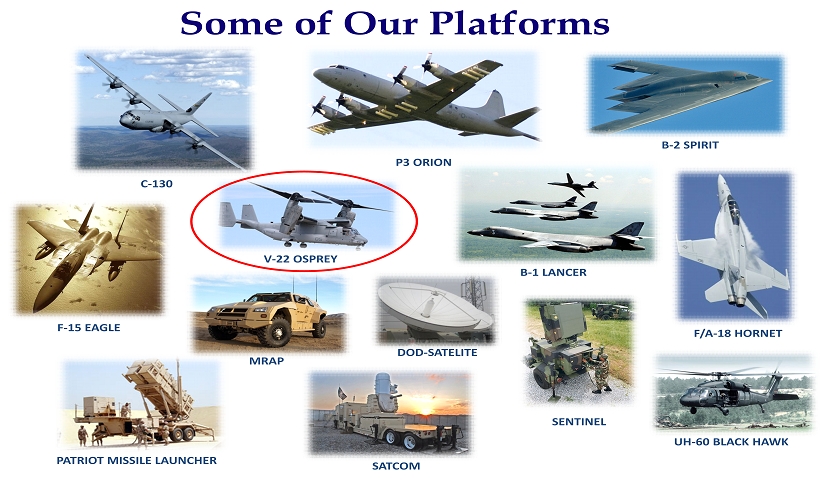
C - 130 P3 ORION B - 2 SPIRIT V - 22 OSPREY B - 1 LANCER F - 15 EAGLE MRAP DOD - SATELITE F/A - 18 HORNET PATRIOT MISSILE LAUNCHER SATCOM SENTINEL UH - 60 BLACK HAWK Some of Our Platforms

More Platforms OH - 58 KIOWA B - 52 STRATO FORTRESS FIRESCOUT TOMAHAWK MISSILE SKYEYE HUNTER AH - 64 APACHE GLOBAL - HAWK JASSM MISSILE PREDATOR A Few More Platforms
17 Looking Ahead – Fiscal 2013 ▪ This year we expect our sales to increase 6 - 9% – We will be impacted by weak global economy, muddled U.S. economy – We expect: ▪ Medical market to be flat ▪ Industrial businesses to be down ▪ Military/Aerospace business to experience growth, possibly significant growth

1 Long Term View ▪ The broad question: What do we see for the long run? – Growth – Growth takes time - We do not have instant growth – We have steady growth ▪ Our core strategy continues to be valid – serving niche markets and ▪ We have been successful institutionalizing small companies that have advanced IEC’s market position – These small companies have identified new opportunities » Opportunities for focused growth
18 Long Term View ▪ The broad question: What do we see for the long run? – Growth – Growth takes time - We do not have instant growth – We have steady growth ▪ Our core strategy continues to be valid – serving niche markets and ▪ We have been successful institutionalizing small companies that have advanced the IEC. – These small companies have identified new opportunities » Opportunities for focused growth

Market Focus Unique Capability Uncompromising Performance Unique Pieces Come Together to Form a Special Company Our growth will not be linear – we will make mistakes and will have some difficult quarters $300 million sales goal

20 We Think About the Long Run ▪ Following our strategy: – Drive organic growth in our key markets ▪ Working on programs that may take 2 or 3 years to develop and last 10 or 15 years – Invest in new internal businesses ▪ Expanding our capability for our customers – Review acquisition opportunities ▪ Creating greater economic value for our shareholders ▪ Pushing growth within our chosen markets

21 Our End Product Increased sales, higher margins and stronger cash flow - creating a more valuable company for our customers, employees and shareholders
We are growing your company! Questions