Attached files
| file | filename |
|---|---|
| 8-K - FORM 8-K - SAUL CENTERS, INC. | d475611d8k.htm |
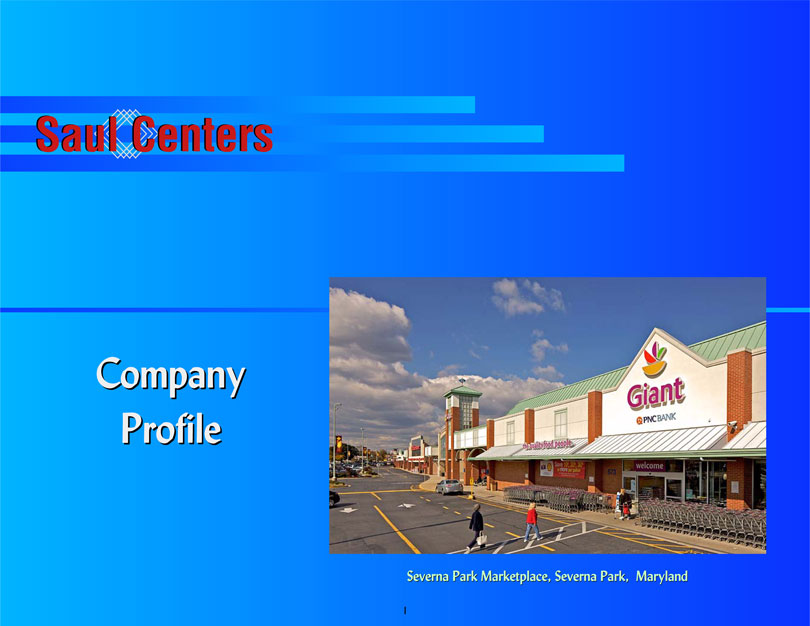
Saul CentersCompanyProfileSeverna Park Marketplace, Severna Park, Maryland1
Forrwarrd—llookiing SttatteemeenttssThis following presentation contains forward-looking statements within the meaning of Section 27A of the Securities Act of 1933, as amended(the “Securities Act”), and Section 21E of the Securities Exchange Act of 1934, as amended (the “Exchange Act”). When we refer to forward-lookingstatements or information, sometimes we use words such as “may,” “will,” “could,” “should,” “plans,” “intends,” “expects,” “believes,” “estimates,”“project,” “anticipates” and “continues”” and other similar words. Forward-looking statements include information about possible or assumed future resultsof our business and our financial condition, liquidity, results of operations, plans and objectives. They also include, among other things, statementsconcerning anticipated revenues, income or loss, capital expenditures, dividends, capital structure, or other financial terms, as well as statementsregarding subjects that are forward-looking by their nature, such as: our business and financing strategy; our ability to obtain future financingarrangements; our understanding of our competition and our ability to compete effectively; our projected operating results; market and industry trends;estimates relating to our future dividends; projected capital expenditures; and interest rates. The forward-looking statements are based on our beliefs,assumptions, and expectations of our future performance, taking into account the information currently available to us. These beliefs, assumptions, andexpectations may change as a result of many possible events or factors, not all of which are known to us. If a change occurs, our business, financialcondition, liquidity, and results of operations may vary materially from those expressed in our forward-looking statements. There are a number of factorsthat may cause actual results to vary from our forward-looking statements: challenging domestic and global credit markeetss and their effect ondiscretionary spending; the ability of our tenants to pay rent; our reliance on shopping center “anchor” tenants and other significant tenants; oursubstantial relationships with members of The Saul Organization; risks of financing, such as increases in interest rates, restrictions imposed by our debt,our ability to meet existing financial covenants and our ability to consummate planned and additional financings on acceptable terms; our developmentactivities; our acceess to additional capital; our ability to successfully complete additional acquisitions or redevelopments, or if they are consummated,whether such acquisitions or developments perform as expected; risks generally incident to the ownership of real property, including adverse changes ineconomic conditions, changes in the investment climate for real estate, changes in real estate taxes and other operating expenses, adverse changes ingovernmental rules and fiscal policies, the relative illiquidity of real estate and environmental risks; risks related to our status as a REIT for federal incometax purposes, such as the existence of complex regulations relating to our status as a REIT, the effect of future changes in REIT requirements as a result ofnew legislation and the adverse consequences of the failure to qualify as a REIT; and other risks described in Part I, Item 1A of our Annual Report on Form10-K for the year ended Decemberr 31, 2011. Given these uncerrtainties, readers are cautioned not to place undue reliance on these forward-lookingstatements. We do not intend and disclaim any duty or obligation to update any of the forward-looking statements or to publicly release the results if werevise any of them, except as required under U.S. federal securities laws. You should review carefully the risks and the risk factors in the section captioned“Risk Factors” beginning on page 13 of our Annual Report on Form 10-K for the fiscal year ended December 31, 2011, which is incorporated herein byreference.2Saul Centers
Company HiighlliighttssExperienced management team with local expertise and longhistory in the D. C. marketInsider ownership totaling over $650 million *Stable, high quality portfolioCompelling internal growth prospects from leasing vacant spaceConservative capital structure and solid coverage ratios* 8.6 million shares of common stock and 6.9 million operating partnershipunits @ 1/24/2013 price of $43.64/share3Saul Centers
Manageemeentt BiiogrraaphiieessB. Francis Saul IIChairman, Chief Executive Officer and Director since June 1993. Chairman of the Board of Directors and Chief Executive Officer of theB. F. Saul Company since 1969. Chairman of the Board of Trustees and Chief Executive Officer of the B. F. Saul Real Estate InvestmentTrust since 1969 and a Trustee since 1964. Chairman of the Board of Chevy Chase Trust Company and ASB Capital Management, LLC. Chairman of the Board and Chief Executive Officer of Chevy Chase Bank, F.S.B. from 1969 to 2009. Thomas H. McCormick President. General Counsel since February 2005. Executive Vice President of Chevy Chase Bank, F.S.B. from 2005 to 2009. Currently, Senior Viice President, Chief Financial Officer, General Counsel and a Directorr of the B. F. Saul Company; Vice President and General Counsel and Chief Financial Officer of the B. F. Saul Real Estate Investment Trust; and Director of Chevy Chase Trust Company and ASB Capital Management, LLC.J. Page LansdaleExecutive Vice Prresident-Real Essttatte. Seenior Vice President of the Company since 2009. Beginning in 1990, Mr. Lansdale held various positions with Cheevy Chasee Bank,, F.S.B., including most recently Senior Vice President of Corporate Real Estate from 2004 to 2009.Scott V. Schneider Senior Vice President—Chief Financial Officer, Treasurer and Secretary since 1998. Vice President—Chief Financial Officer, Treasurer and Secretary of the Company from 1993 to 1998. Vice President of the B. F. Saul Company and B. F. Saul Property Company and Assistant Vice President of the B. F. Saul Real Estate Investment Trust from 1985 to 1993. John F. CollichSenior Vice President—Acquisitions and Development since 2011. Senior Vice President—Retail Development 2000-2011. Vice President—Retail Development of the Company from 1993 to 2000. Vice President of the B. F. Saul Company and B. F. Saul Property Company in 1993.4Saul Centers
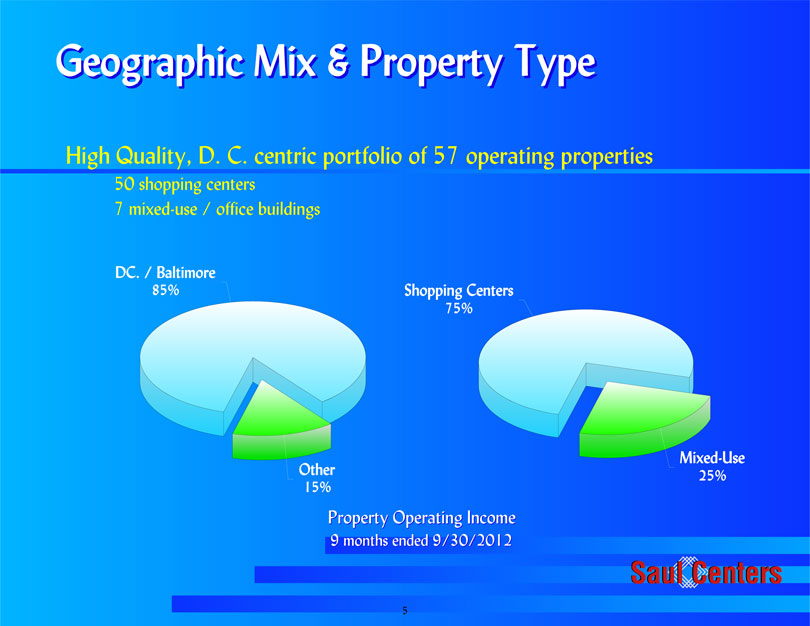
Property Property Operating Income9 months ended 9/30/2012Shopping Centers75%Mixed-Use25%DC. / Baltimore85%Other15%Geeogrraphiicc Miix & Prropeerrtty TypeeHigh Quality, D. C. centric portfolio of 57 operating properties50 shopping centers7 mixed-use / office buildings5Saul Centers
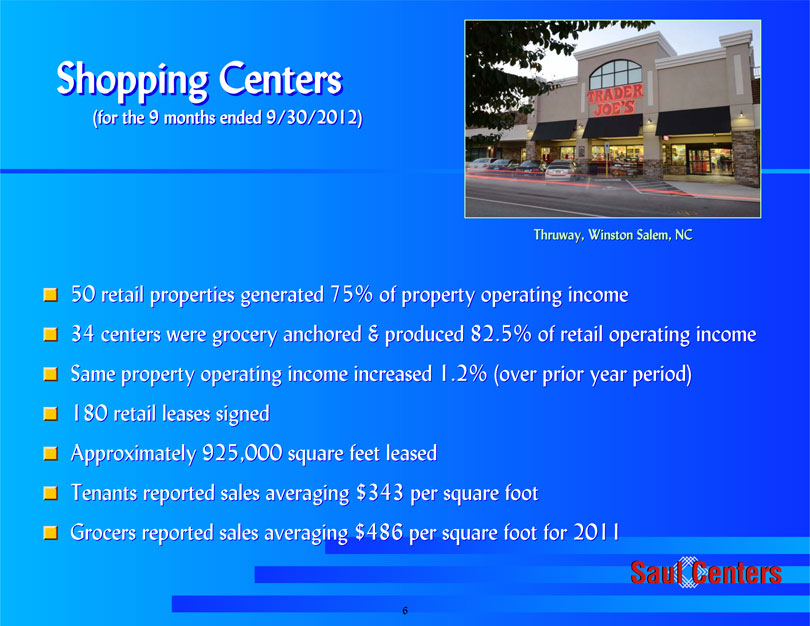
Shoppiing Ceentteerrss((fforr tthee 9 montthss eendeed 9/30/2012))50 retail properties generated 75% of property operating income34 centers were grocery anchored & produced 82.5% of retail operating incomeSame property operating income increased 1.2% (over prior year period)180 retail leases signedApproximately 925,000 square feet leasedTenants reported sales averaging $343 per square footGrocers reported sales averaging $486 per square foot for 2011Thruway, Winston Salem, NC6Saul Centers
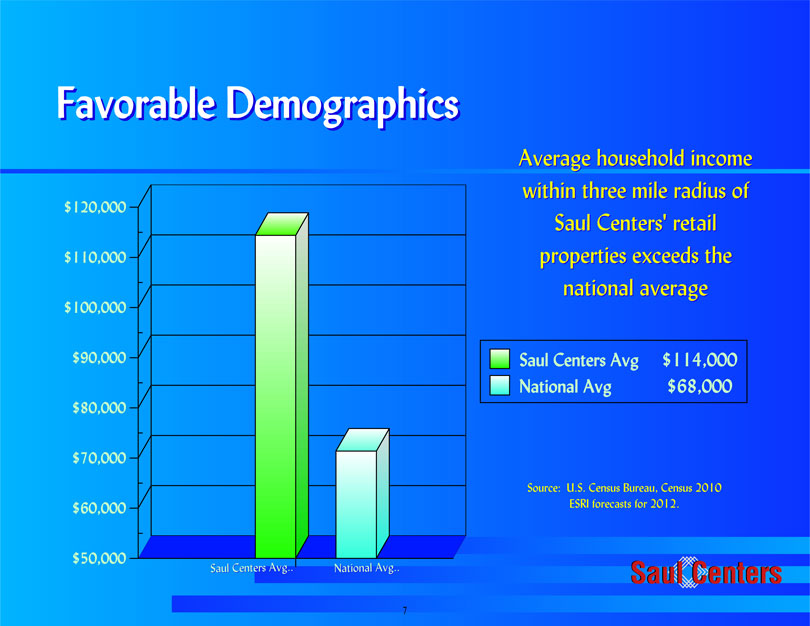
Favorrabllee Deemogrraphiiccss$50,000$60,000$70,000$80,000$90,000$100,000$110,000$120,000Saul Centers Avg $114,000National Avg $68,000Average household incomewithin three mile radius ofSaul Centers’ retailproperties exceeds thenational averageSaul Centers Avg. Saul Centers Avg. National Avg. National Avg.Source: U.S. Census Bureau, Census 2010ESRI forecasts for 2012.7Saul Centers
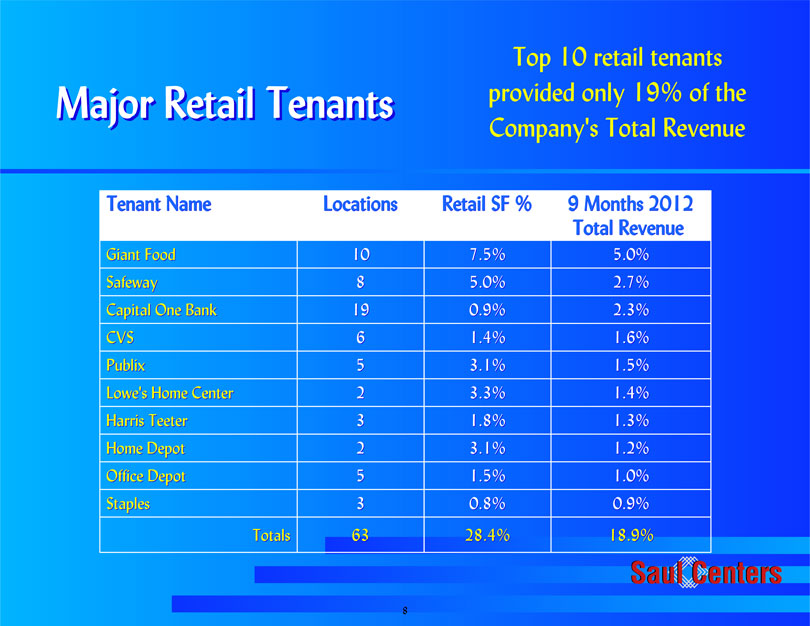
Majjorr Reettaiill TeenanttssTenant Name Locations Retail SF % 9 Months 2012Total RevenueGiant Food 10 7.5% 5.0%Safeway 8 5.0% 2.7%Capital One Bank 19 0.9% 2.3%CVS 6 1.4% 1.6%Publix 5 3.1% 1.5%Lowe’s Home Center 2 3.3% 1.4%Harris Teeter 3 1.8% 1.3%Home Depot 2 3.1% 1.2%Office Depot 5 1.5% 1.0%Staples 3 0.8% 0.9%Totals 63 28.4% 18.9%Top 10 retail tenantsprovided only 19% of theCompany’s Total Revenue8Saul Centers
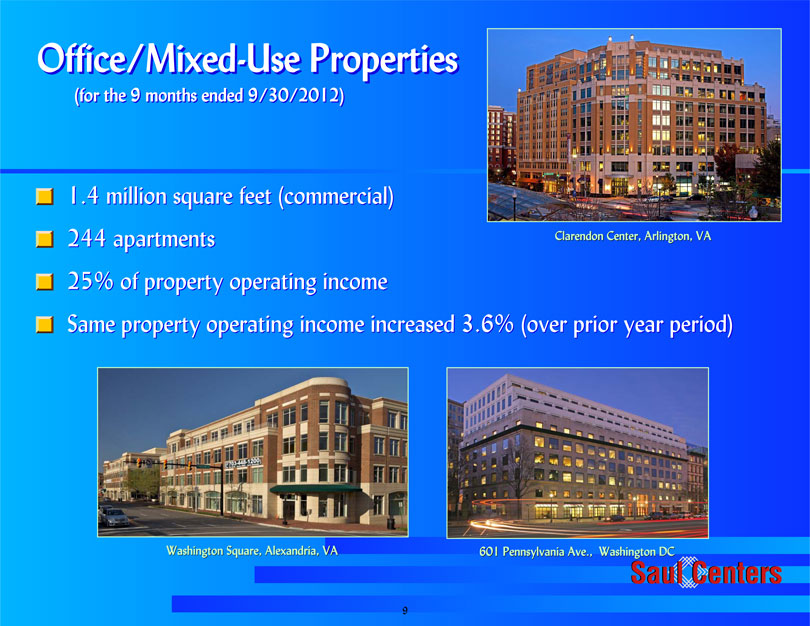
Offffiiccee/Miixeed—Ussee Prropeerrttiieess((fforr tthee 9 montthss eendeed 9/30/2012))1.4 million square feet (commercial)244 apartments25% of property operating incomeSame property operating income increased 3.6% (over prior year period)Clarendon Center, Arlington, VAWashington Square, Alexandria, VA 601 Pennsylvania Ave., Washington DC9Saul Centers
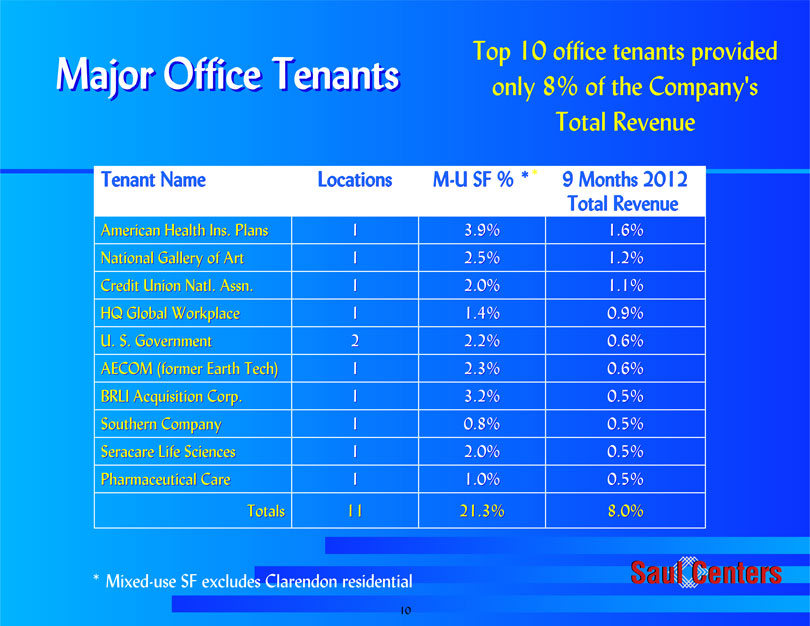
Majjorr Offffiiccee TeenanttssTenant Name Locations M-U SF % * 9 Months 2012Total RevenueAmerican Health Ins. Plans 1 3.9% 1.6%National Gallery of Art 1 2.5% 1.2%Credit Union Natl. Assn. 1 2.0% 1.1%HQ Global Workplace 1 1.4% 0.9%U. S. Government 2 2.2% 0.6%AECOM (former Earth Tech) 1 2.3% 0.6%BRLI Acquisition Corp. 1 3.2% 0.5%Southern Company 1 0.8% 0.5%Seracare Life Sciences 1 2.0% 0.5%Pharmaceutical Care 1 1.0% 0.5%Totals 11 21.3% 8.0%Top 10 office tenants providedonly 8% of the Company’sTotal Revenue* Mixed-use SF excludes Clarendon residential*10Saul Centers
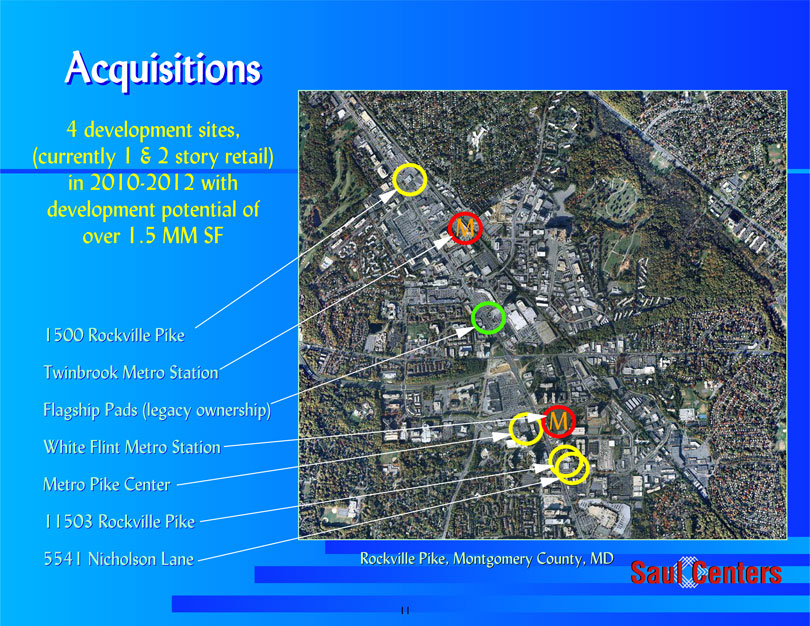
AccquiissiittiionssRockville Pike, Montgomery County, MD4 development sites,(currently 1 & 2 story retail)in 2010-2012 withdevelopment potential ofover 1.5 MM SF1500 Rockville PikeTwinbrook Metro StationFlagship Pads (legacy ownership)White Flint Metro StationMetro Pike Center11503 Rockville Pike5541 Nicholson LaneMM11Saul Centers
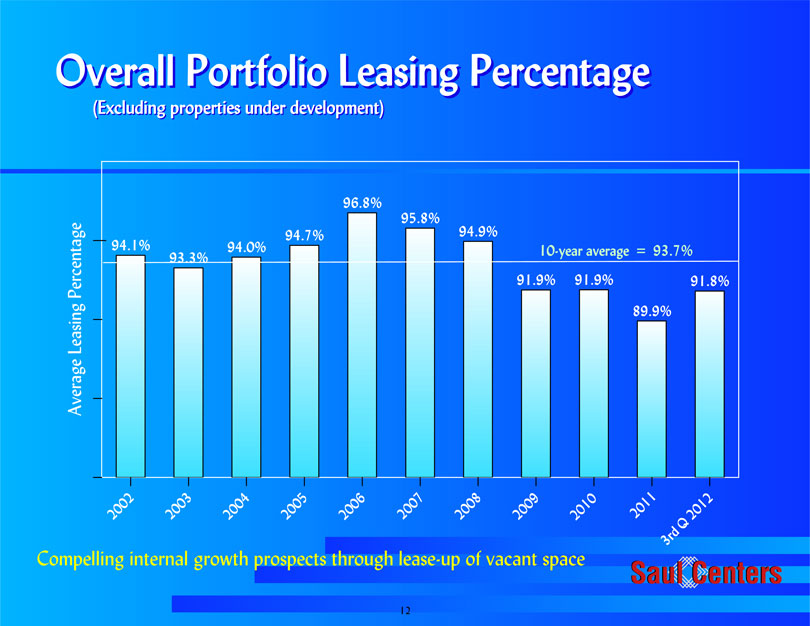
94.1%93.3%94.0%94.7%96.8%95.8%94.9%91.9% 91.9%89.9%91.8%20022003200420052006200720082009201020113rd Q 2012Average Leasing Percentage Overall Portfolio Leasing Percentage Overall Portfolio Leasing Percentage((EExxcclludiing prropeerrttiieess undeerr deevveellooppmeenntt))10-year average = 93.7%Compelling internal growth prospects through lease-up of vacant space12Saul Centers
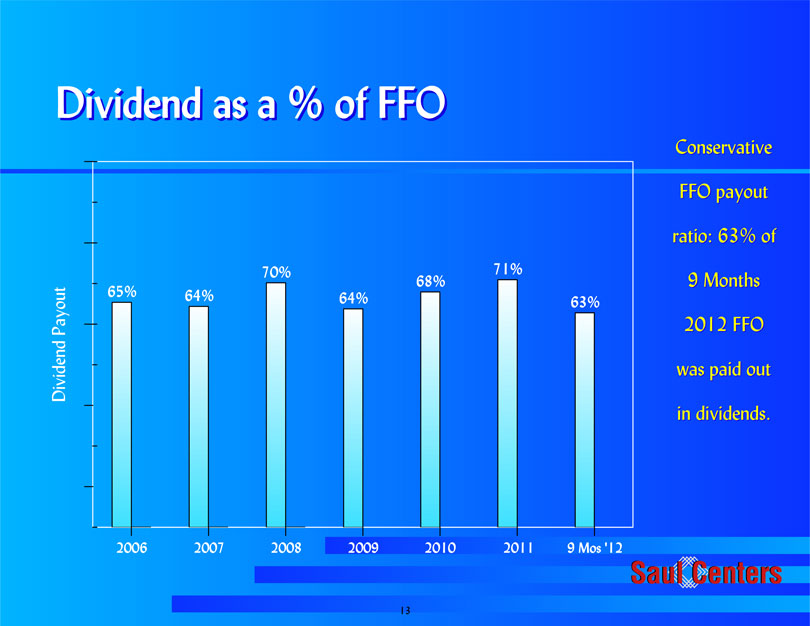
65% 64%70%64%68%71%63%2006 2007 2008 2009 2010 2011 9 Mos ‘12Dividend PayoutDiiviideend ass a % off FFOConservativeFFO payoutratio: 63% of9 Months2012 FFOwas paid outin dividends.13Saul Centers
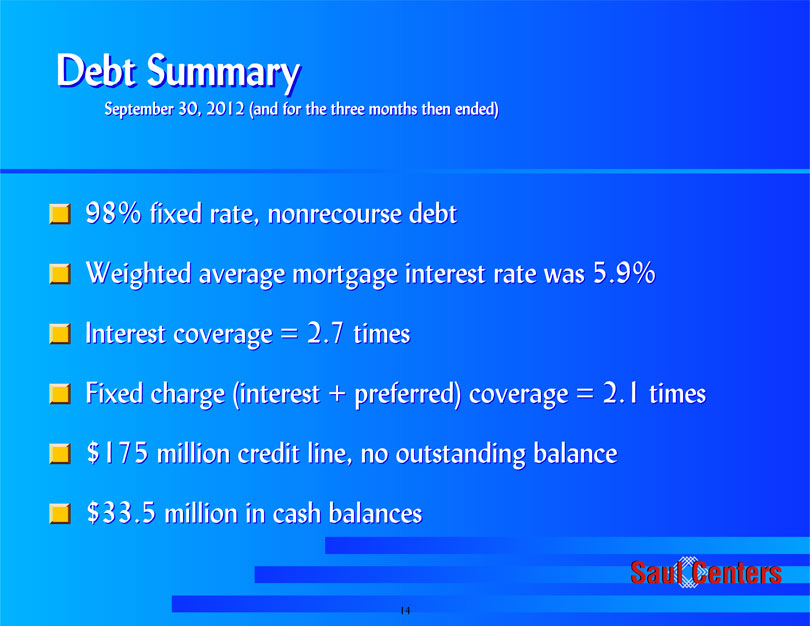
Deebtt SSummaarry
SSeepptteembbeerr 30,, 2012 ((aand fforr tthee tthrreeee montthss ttheen eendeed))
98% fixed rate, nonrecourse debt
Weighted average mortgage interest rate was 5.9%
Interest coverage = 2.7 times
Fixed charge (interest + preferred) coverage = 2.1 times
$175 million credit line, no outstanding balance
$33.5 million in cash balances
14
Saul Centers
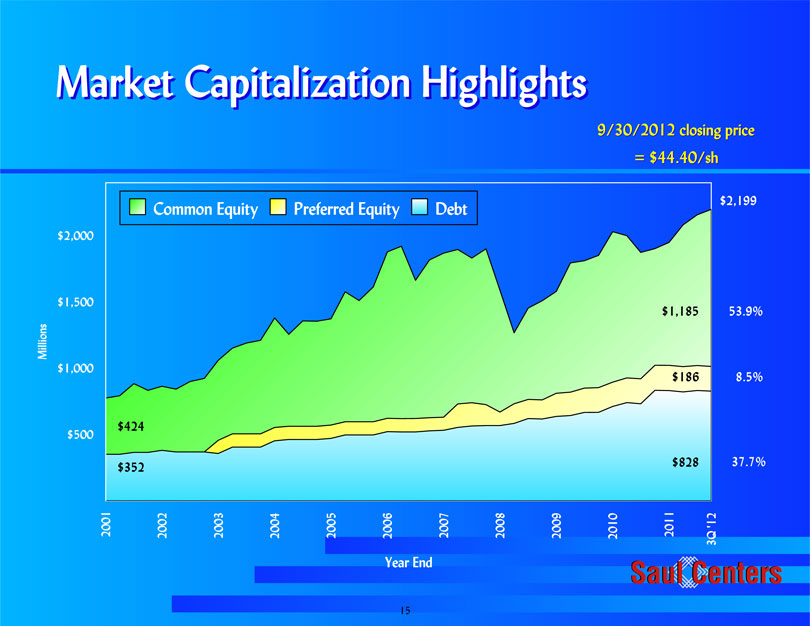
2001 2002 2003 2004 2005 2006 2007 2008 2009 2010 2011 3Q ’12 Year End$500$1,000$1,500$2,000MillionsCommon Equity Preferred Equity DebtMarrkeett Capiittalliizzattiion Hiighlliighttss$2,199$1,185$828$1869/30/2012 closing price= $44.40/sh$424$35253.9%37.7%8.5%15Saul Centers
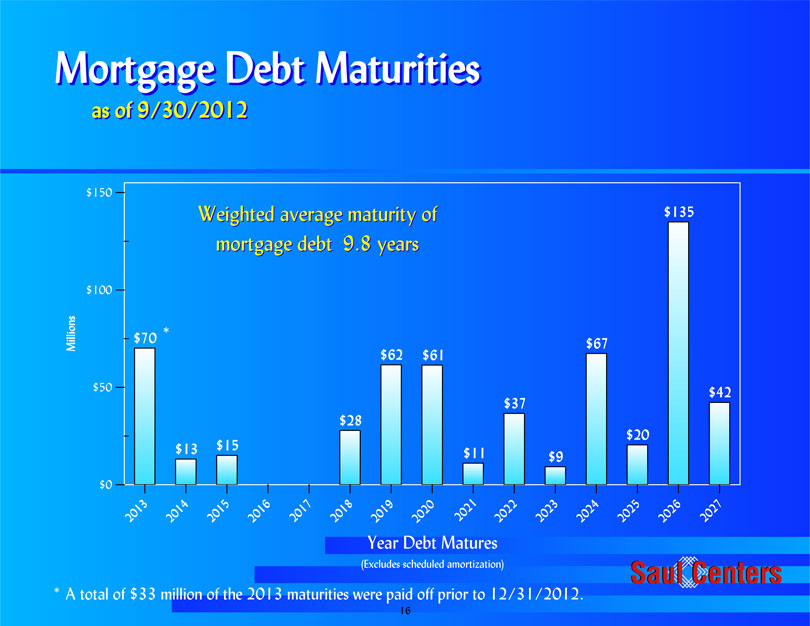
$70 $13 $15 $28 $62 $61$11$37$9$67$20$135$422013201420152016201720182019 20202021202220232024202520262027(Excludes scheduled amortization)Year Debt Matures$0$50$100$150Millions Mortgage Debt Maturities Mortgage Debt Maturitiesaass off 9/30/2012Weighted average maturity ofmortgage debt 9.8 years* A total of $33 million of the 2013 maturities were paid off prior to 12/31/2012.*16Saul Centers
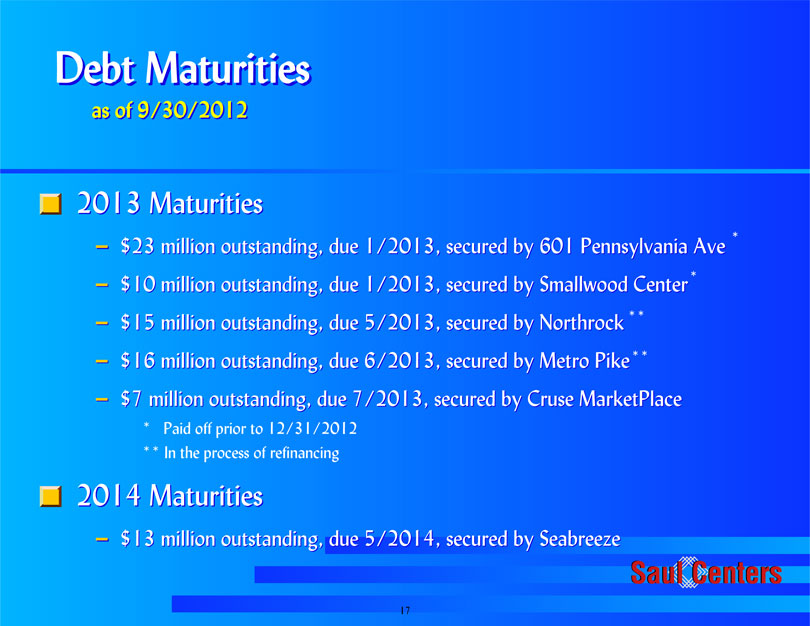
2013 Maturities$23 million outstanding, due 1/2013, secured by 601 Pennsylvania Ave$10 million outstanding, due 1/2013, secured by Smallwood Center$15 million outstanding, due 5/2013, secured by Northrock$16 million outstanding, due 6/2013, secured by Metro Pike$7 million outstanding, due 7/2013, secured by Cruse MarketPlace2014 Maturities$13 million outstanding, due 5/2014, secured by Seabreeze* Paid off prior to 12/31/2012Deebtt Matturriittiieessaass off 9/30/2012** In the process of refinancing******17Saul Centers
Company Hiighlliighttss Experienced management team with local expertise and long history in the D. C. market Insider ownership totaling over $650 million *Stable, high quality portfolio Compelling internal growth prospects from leasing vacant space Conservative capital structure and solid coverage ratios* 8.6 million shares of common stock and 6.9 million operating partnership units @ 1/24/2013 price of $43.64/share18Saul Centers
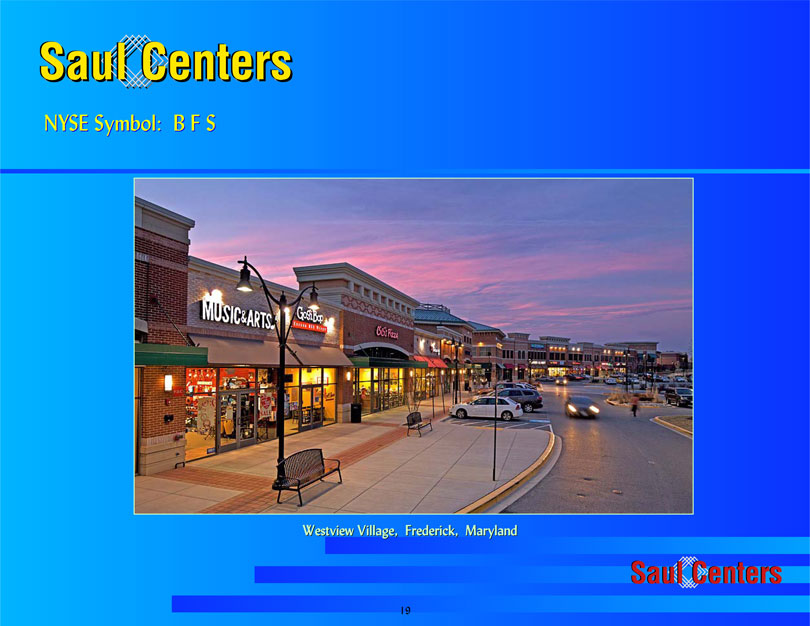
Saul Centers NYSE Symbol: B F SWestview Village, Frederick, Maryland 19 Saul Centers
