Attached files
| file | filename |
|---|---|
| EX-99.1 - EXHIBIT 99.1 - Polaris Inc. | a50545298-ex991.htm |
| 8-K - POLARIS INDUSTRIES INC. 8-K - Polaris Inc. | a50545298.htm |
Exhibit 99.2F
Results January 29, 2013
POLARIS INDUSTRIES INC.
Except for historical information contained herein, the matters set forth in this document, including but not limited to management’s expectations regarding 2013 sales, shipments, margins, net income, cash flow, and manufacturing realignment project transition costs and savings, are forward-looking statements that involve certain risks and uncertainties that could cause actual results to differ materially from those forward-looking statements. Potential risks and uncertainties include such factors as product offerings, promotional activities and pricing strategies by competitors; manufacturing realignment transition costs; acquisition integration costs; warranty expenses; impact of changes in Polaris stock prices on incentive compensation; foreign currency exchange rate fluctuations; environmental and product safety regulatory activity; effects of weather; commodity costs; uninsured product liability claims; uncertainty in the retail and wholesale credit markets; changes in tax policy and overall economic conditions, including inflation, consumer confidence and spending and relationships with dealers and suppliers. Investors are also directed to consider other risks and uncertainties discussed in our 2011 annual report and Form 10-K filed by the Company with the Securities and Exchange Commission. The Company does not undertake any duty to any person to provide updates to its forward-looking statements. The data source for retail sales figures included in this presentation is registration information provided by Polaris dealers in North America and compiled by the Company or Company estimates. The Company must rely on information that its dealers supply concerning retail sales, and other retail sales data sources and this information is subject to revision. 2 Q4-2012
Scott Wine, CEO Fourth Quarter & Full Year 2012 Earnings Results January 29, 2013 POLARIS INDUSTRIES INC.
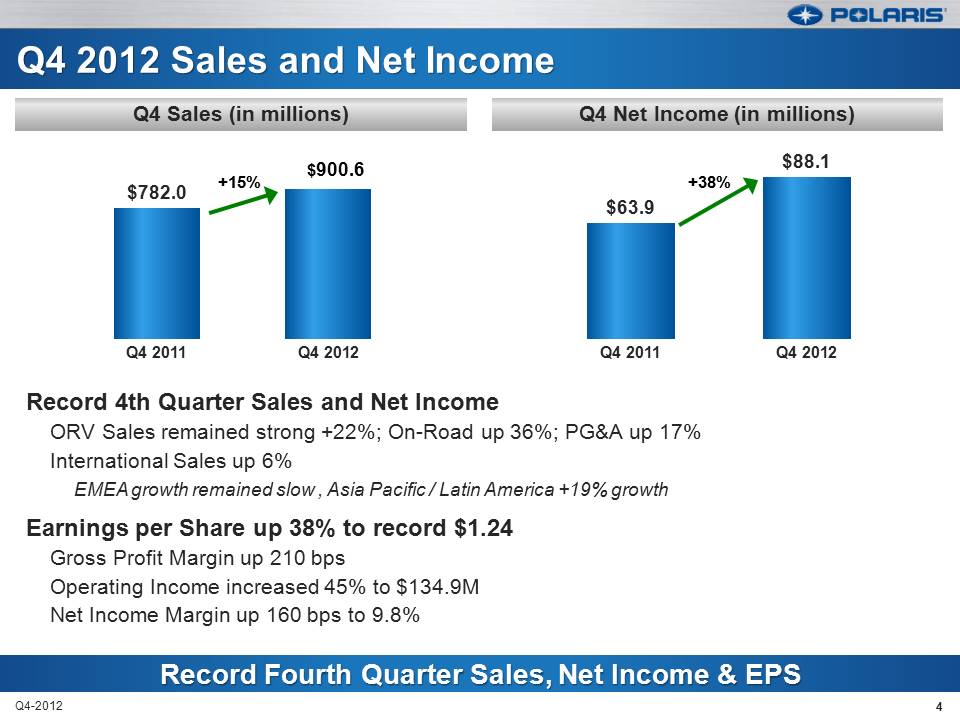
$63.9 $88.1 Q4 2011 Q4 2012 +38% Q4 2012 Sales and Net Income Record 4th Quarter Sales and Net Income ORV Sales remained strong +22%; On-Road up 36%; PG&A up 17% International Sales up 6% EMEA growth remained slow , Asia Pacific / Latin America +19% growth Earnings per Share up 38% to record $1.24 Gross Profit Margin up 210 bps Operating Income increased 45% to $134.9M Net Income Margin up 160 bps to 9.8% 4 Q4-2012 $782.0 Q4 2011 Q4 2012 +15% $900.6 Record Fourth Quarter Sales, Net Income & EPS Q4 Net Income (in millions) Q4 Sales (in millions)
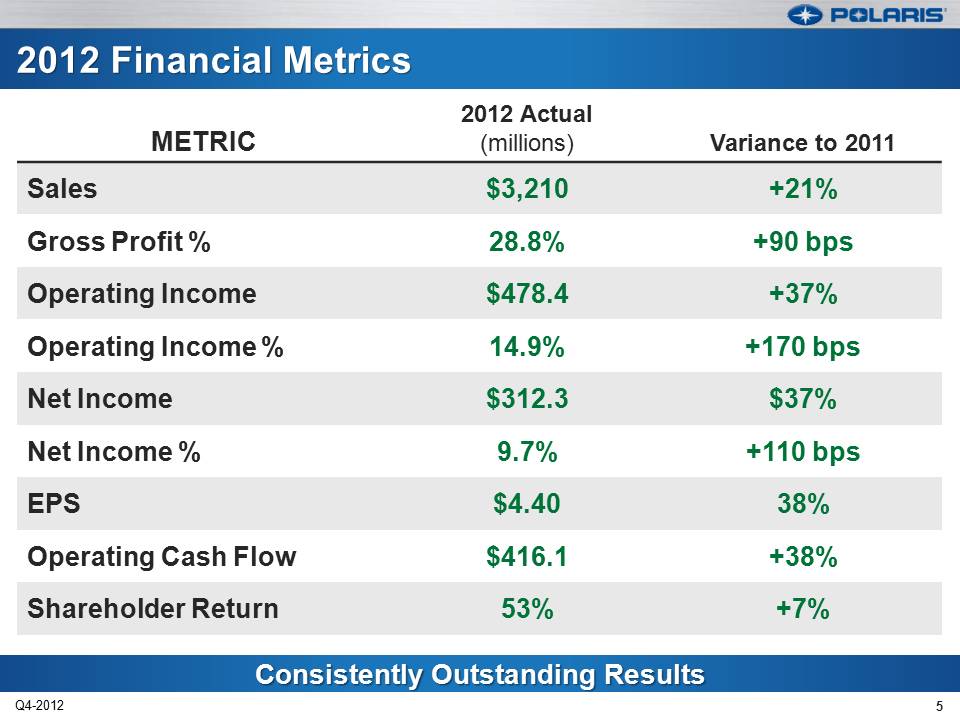
Consistently Outstanding Results 2012 Financial Metrics METRIC 2012 Actual (millions) Variance to 2011 Sales $3,210 +21% Gross Profit % 28.8% +90 bps Operating Income $478.4 +37% Operating Income % 14.9% +170 bps Net Income $312.3 $37% Net Income % 9.7% +110 bps EPS $4.40 38% Operating Cash Flow $416.1 +38% Shareholder Return 53% +7% 5 Q4-2012
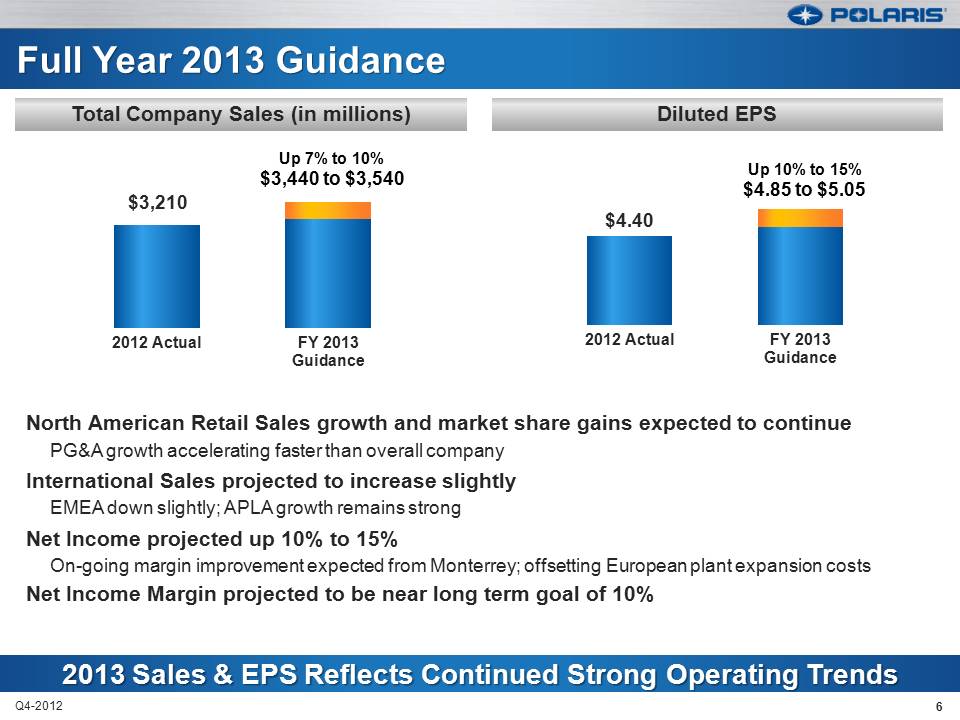
North American Retail Sales growth and market share gains expected to continue PG&A growth accelerating faster than overall company International Sales projected to increase slightly EMEA down slightly; APLA growth remains strong Net Income projected up 10% to 15% On-going margin improvement expected from Monterrey; offsetting European plant expansion costs Net Income Margin projected to be near long term goal of 10% 6 Q4-2012 $3,210 2012 Actual FY 2013 Guidance $4.40 2012 Actual FY 2013 Guidance Diluted EPS Total Company Sales (in millions) Up 7% to 10% $3,440 to $3,540 Up 10% to 15% $4.85 to $5.05
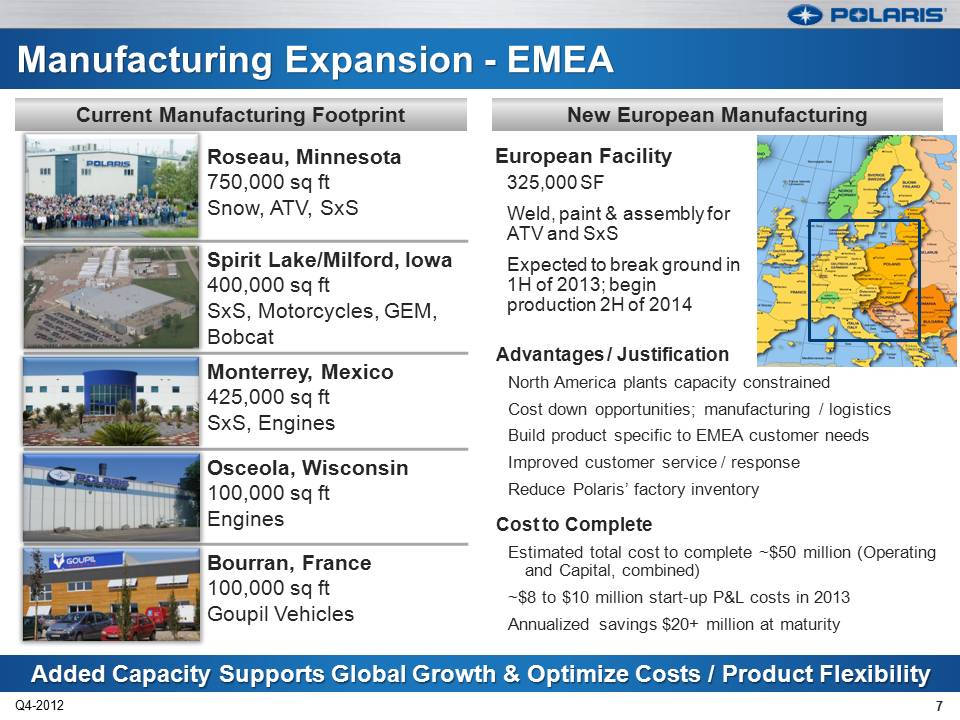
New European Manufacturing Current Manufacturing Footprint European Facility 325,000 SF Weld, paint & assembly for ATV and SxS Expected to break ground in 1H of 2013; begin production 2H of 2014 Advantages / Justification North America plants capacity constrained Cost down opportunities; manufacturing / logistics Build product specific to EMEA customer needs Improved customer service / response Reduce Polaris’ factory inventory Cost to Complete Estimated total cost to complete ~$50 million (Operating and Capital, combined) ~$8 to $10 million start-up P&L costs in 2013 Annualized savings $20+ million at maturity Roseau, Minnesota 750,000 sq ft Snow, ATV, SxS Spirit Lake/Milford, Iowa 400,000 sq ft SxS, Motorcycles, GEM, Bobcat Monterrey, Mexico 425,000 sq ft SxS, Engines Osceola, Wisconsin 100,000 sq ft Engines Bourran, France 100,000 sq ft Goupil Vehicles 7 Q4-2012
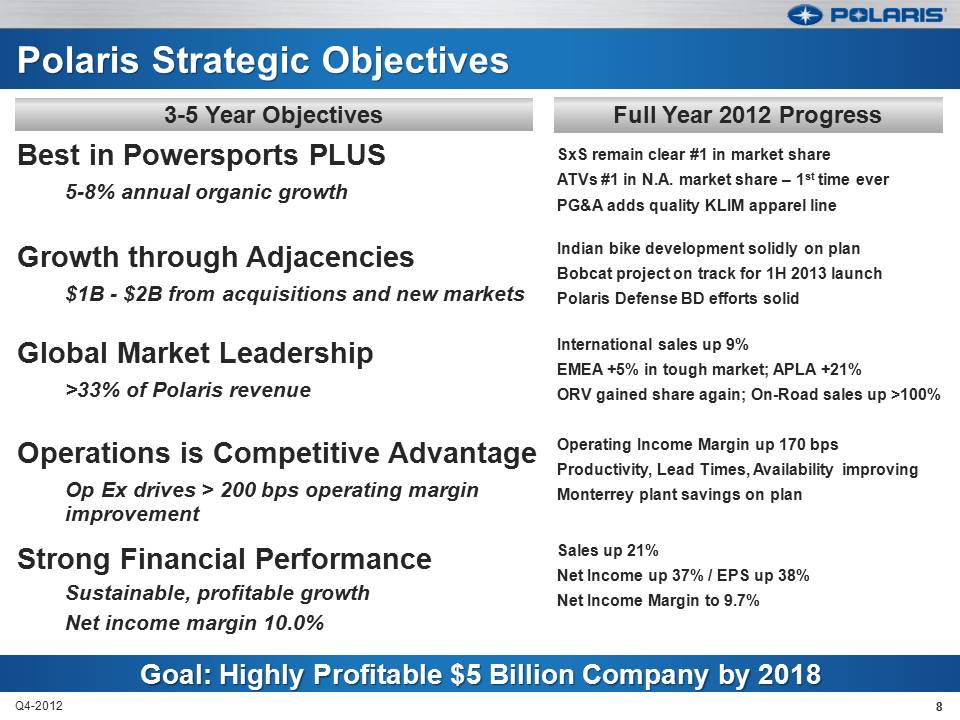
Best in Powersports PLUS 5-8% annual organic growth SxS remain clear #1 in market share ATVs #1 in N.A. market share – 1st time ever PG&A adds quality KLIM apparel line Growth through Adjacencies $1B - $2B from acquisitions and new markets Indian bike development solidly on plan Bobcat project on track for 1H 2013 launch Polaris Defense BD efforts solid Global Market Leadership >33% of Polaris revenue International sales up 9% EMEA +5% in tough market; APLA +21% ORV gained share again; On-Road sales up >100% Operations is Competitive Advantage Op Ex drives > 200 bps operating margin Improvement Operating Income Margin up 170 bps Productivity, Lead Times, Availability improving Monterrey plant savings on plan Strong Financial Performance Sustainable, profitable growth Net income margin 10.0% Sales up 21% Net Income up 37% / EPS up 38% Net Income Margin to 9.7% 8 Q4-2012 3-5 Year Objectives Full Year 2012 Progress
Bennett Morgan President & COO Fourth Quarter & Full Year 2012 Earnings Results January 29, 2012 POLARIS INDUSTRIES INC.
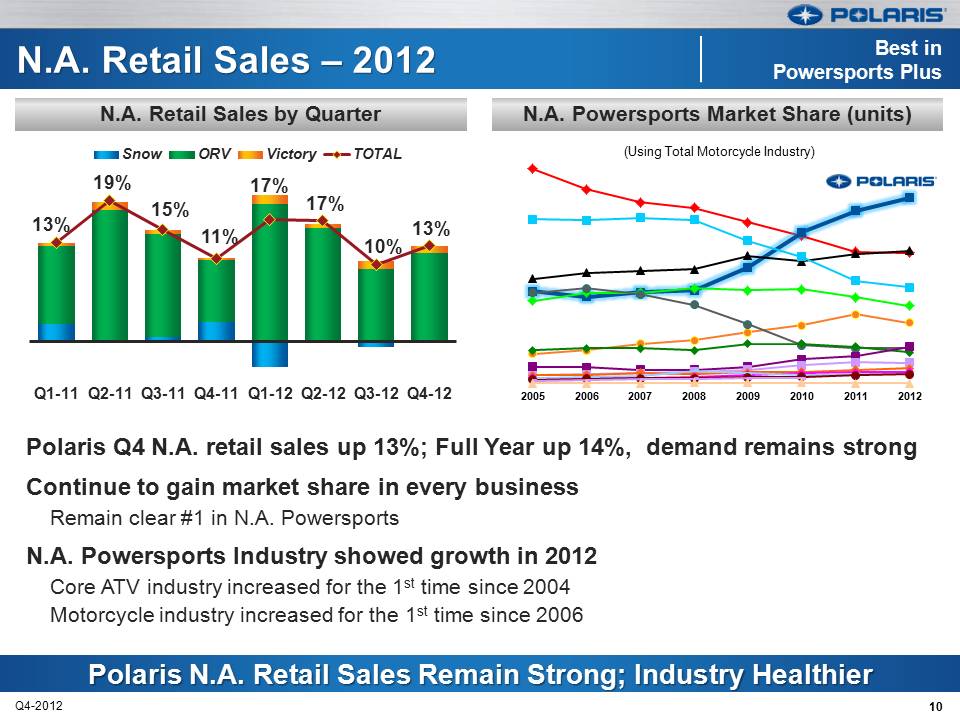
10 Q4-2012 N.A. Powersports Market Share (units) N.A. Retail Sales by Quarter 13% 19% 15% 11% 17% 17% 10% 13% Q1-11 Q2-11 Q3-11 Q4-11 Q1-12 Q2-12 Q3-12 Q4-12 Snow ORV Victory TOTAL Polaris Q4 N.A. retail sales up 13%; Full Year up 14%, demand remains strong Continue to gain market share in every business Remain clear #1 in N.A. Powersports N.A. Powersports Industry showed growth in 2012 Core ATV industry increased for the 1st time since 2004 Motorcycle industry increased for the 1st time since 2006 2005 2006 2007 2008 2009 2010 2011 2012 (Using Total Motorcycle Industry)
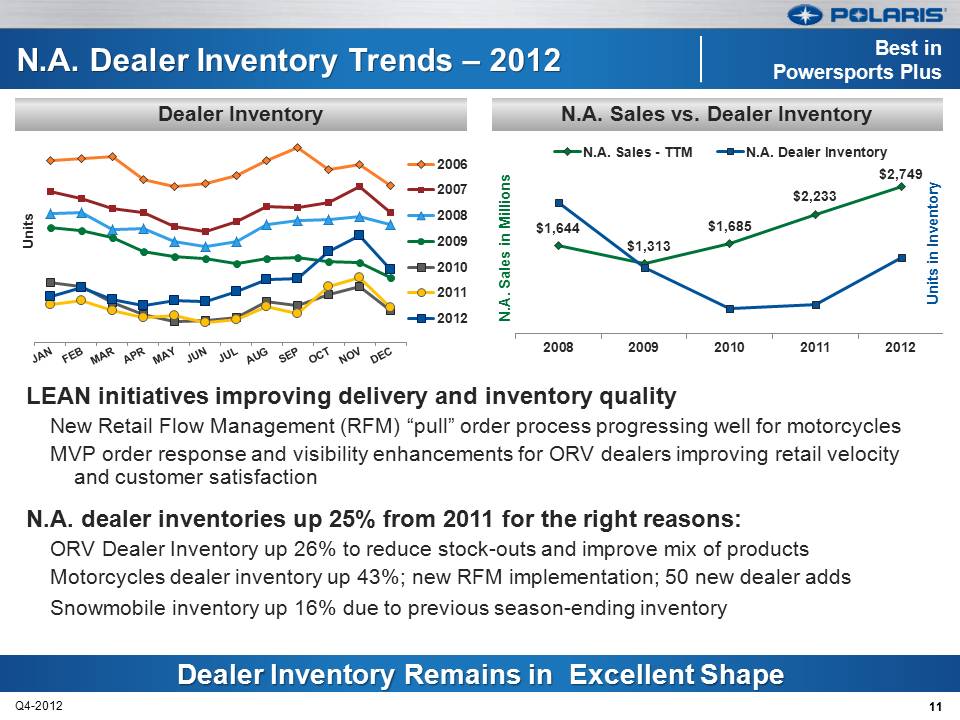
11 Q4-2012 N.A. Sales vs. Dealer Inventory Dealer Inventory Units 2006 2007 2008 2009 2010 2011 2012 LEAN initiatives improving delivery and inventory quality New Retail Flow Management (RFM) “pull” order process progressing well for motorcycles MVP order response and visibility enhancements for ORV dealers improving retail velocity and customer satisfaction N.A. dealer inventories up 25% from 2011 for the right reasons: ORV Dealer Inventory up 26% to reduce stock-outs and improve mix of products Motorcycles dealer inventory up 43%; new RFM implementation; 50 new dealer adds Snowmobile inventory up 16% due to previous season-ending inventory $1,644 $1,313 $1,685 $2,233 $2,749 2008 2009 2010 2011 2012 Units in Inventory N.A. Sales in Millions N.A. Sales - TTM N.A. Dealer Inventory
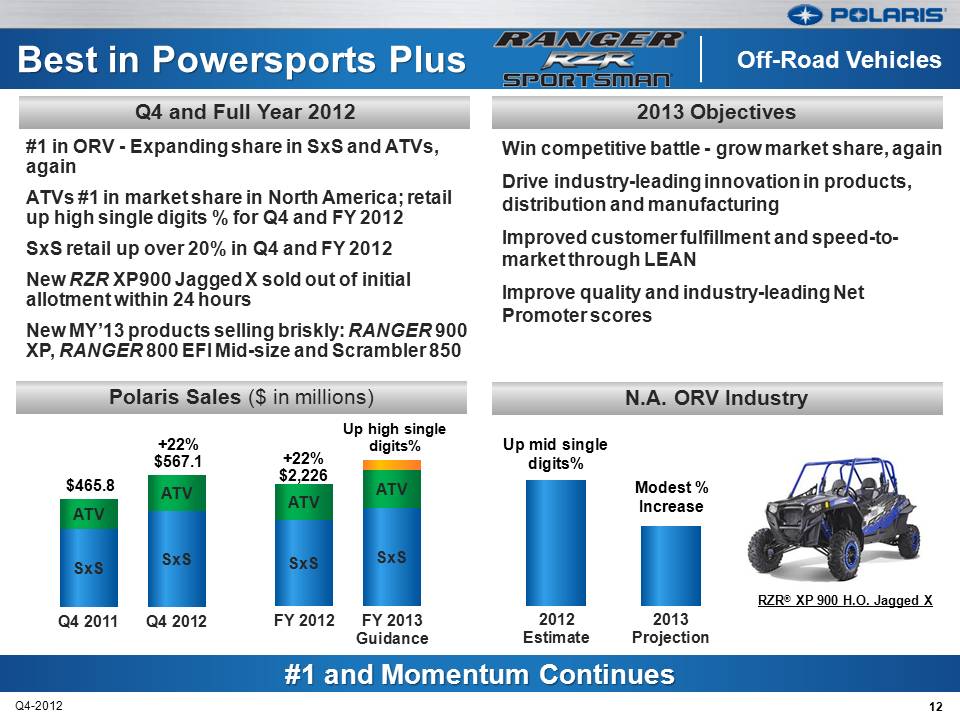
12 Q4-2012 #1 in ORV - Expanding share in SxS and ATVs, again ATVs #1 in market share in North America; retail up high single digits % for Q4 and FY 2012 SxS retail up over 20% in Q4 and FY 2012 New RZR XP900 Jagged X sold out of initial allotment within 24 hours New MY’13 products selling briskly: RANGER 900 XP, RANGER 800 EFI Mid-size and Scrambler 850 SxS SxS ATV ATV Q4 2011 Q4 2012 N.A. ORV Industry Polaris Sales ($ in millions) 2012 Estimate 2013 Projection SxS SxS ATV ATV FY 2012 FY 2013 Guidance Up high single digits% +22% $567.1 +22% $2,226 $465.8 RZR® XP 900 H.O. Jagged X Up mid single digits% Modest % Increase Q4 and Full Year 2012 2013 Objectives Win competitive battle - grow market share, again Drive industry-leading innovation in products, distribution and manufacturing Improved customer fulfillment and speed-tomarket through LEAN Improve quality and industry-leading Net Promoter scores
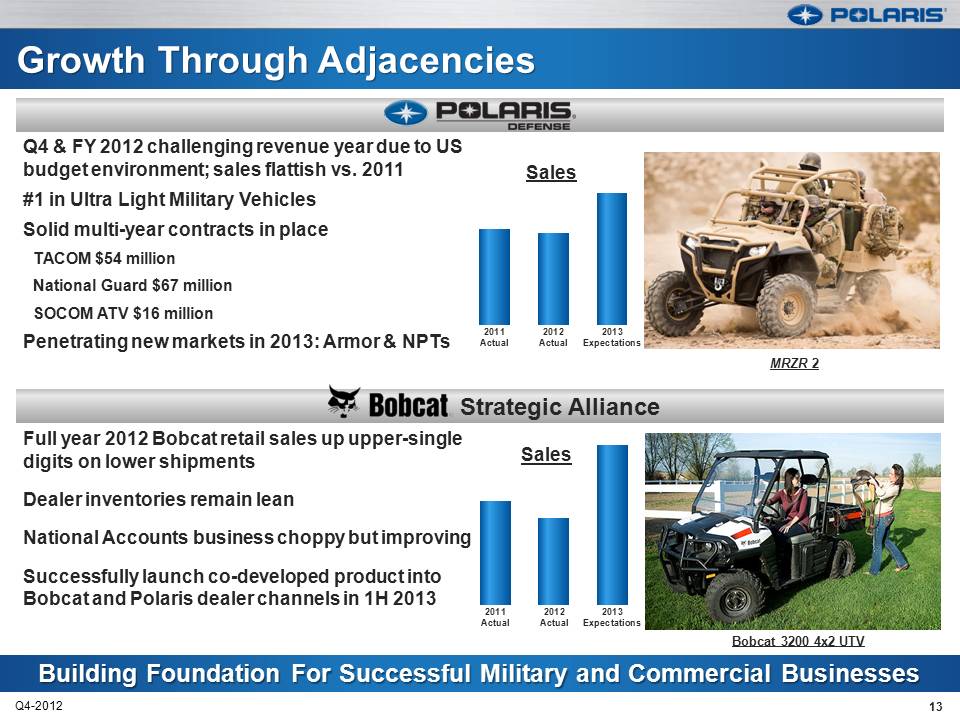
13 Q4-2012 Q4 & FY 2012 challenging revenue year due to US budget environment; sales flattish vs. 2011 #1 in Ultra Light Military Vehicles Solid multi-year contracts in place TACOM $54 million National Guard $67 million SOCOM ATV $16 million Penetrating new markets in 2013: Armor & NPTs Full year 2012 Bobcat retail sales up upper-single digits on lower shipments Dealer inventories remain lean National Accounts business choppy but improving Successfully launch co-developed product into Bobcat and Polaris dealer channels in 1H 2013 Strategic Alliance 2011 Actual 2012 Actual 2013 Expectations Sales 2011 Actual 2012 Actual 2013 Expectations Sales MRZR 2 Bobcat 3200 4x2 UTV
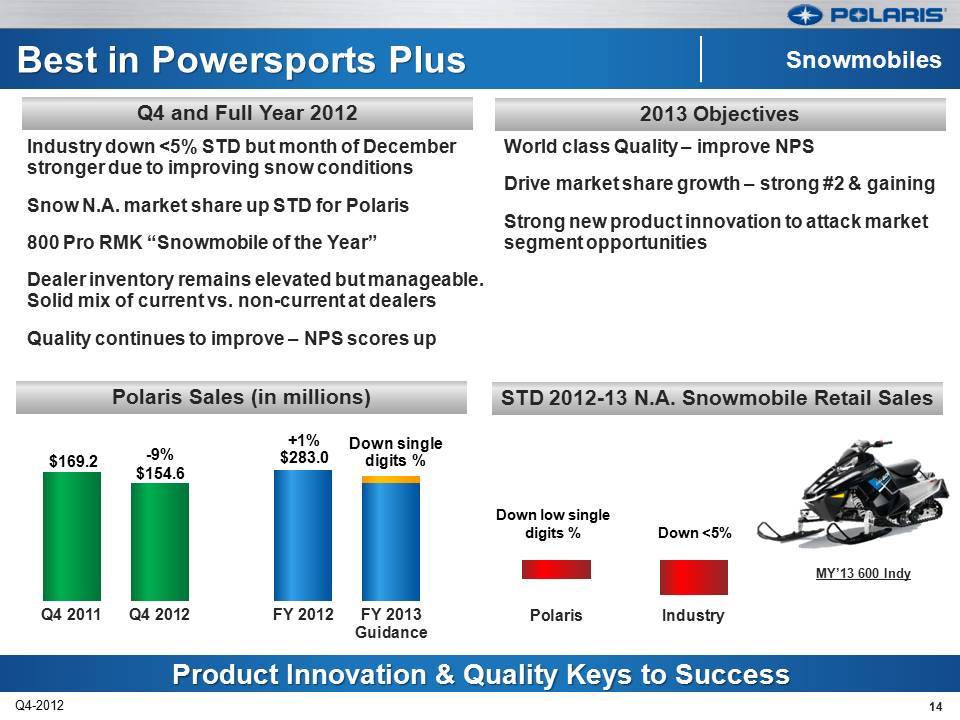
Polaris Industry Down <5% Down low single digits % Q4 2011 Q4 2012 FY 2012 FY 2013 Guidance 14 Q4-2012 Industry down <5% STD but month of December stronger due to improving snow conditions Snow N.A. market share up STD for Polaris 800 Pro RMK “Snowmobile of the Year” Dealer inventory remains elevated but manageable. Solid mix of current vs. non-current at dealers Quality continues to improve – NPS scores up STD 2012-13 N.A. Snowmobile Retail Sales Polaris Sales (in millions) MY’13 600 Indy Down single digits % -9% $154.6 +1% $283.0 $169.2 2013 Objectives Q4 and Full Year 2012 World class Quality – improve NPS Drive market share growth – strong #2 & gaining Strong new product innovation to attack market segment opportunities
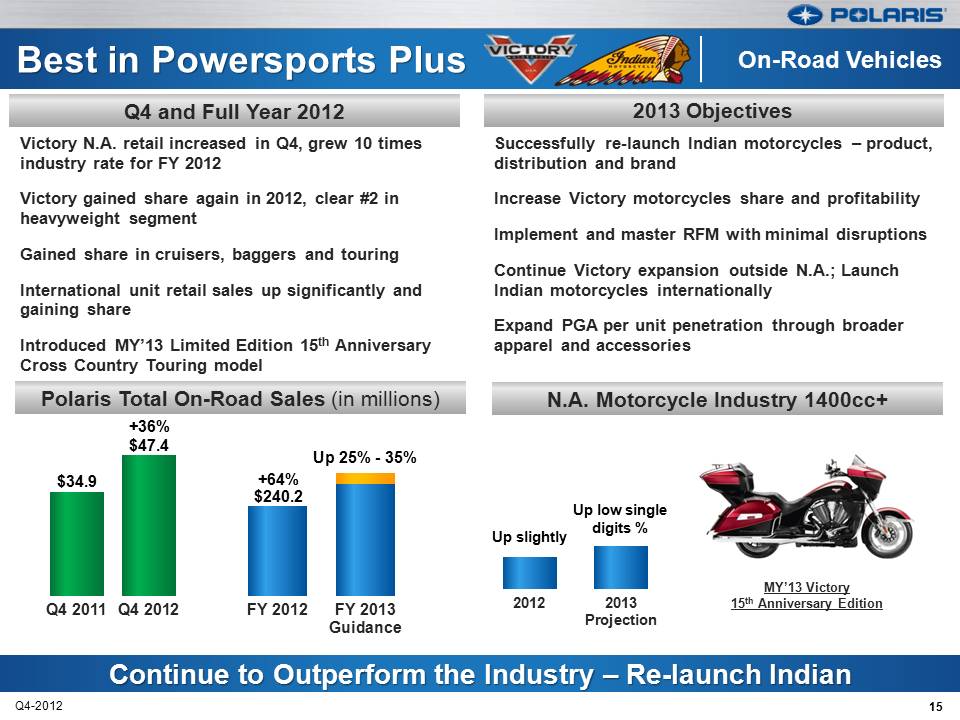
2012 2013 Projection Up low single digits % Up slightly 15 Q4-2012 Victory N.A. retail increased in Q4, grew 10 times industry rate for FY 2012 Victory gained share again in 2012, clear #2 in heavyweight segment Gained share in cruisers, baggers and touring International unit retail sales up significantly and gaining share Introduced MY’13 Limited Edition 15th Anniversary Cross Country Touring model N.A. Motorcycle Industry 1400cc+ Polaris Total On-Road Sales (in millions) FY 2012 FY 2013 Guidance Q4 2011 Q4 2012 Up 25% - 35% +36% $47.4 +64% $240.2 $34.9 Q4 and Full Year 2012 2013 Objectives MY’13 Victory 15th Anniversary Edition Successfully re-launch Indian motorcycles – product, distribution and brand Increase Victory motorcycles share and profitability Implement and master RFM with minimal disruptions Continue Victory expansion outside N.A.; Launch Indian motorcycles internationally Expand PGA per unit penetration through broader apparel and accessories
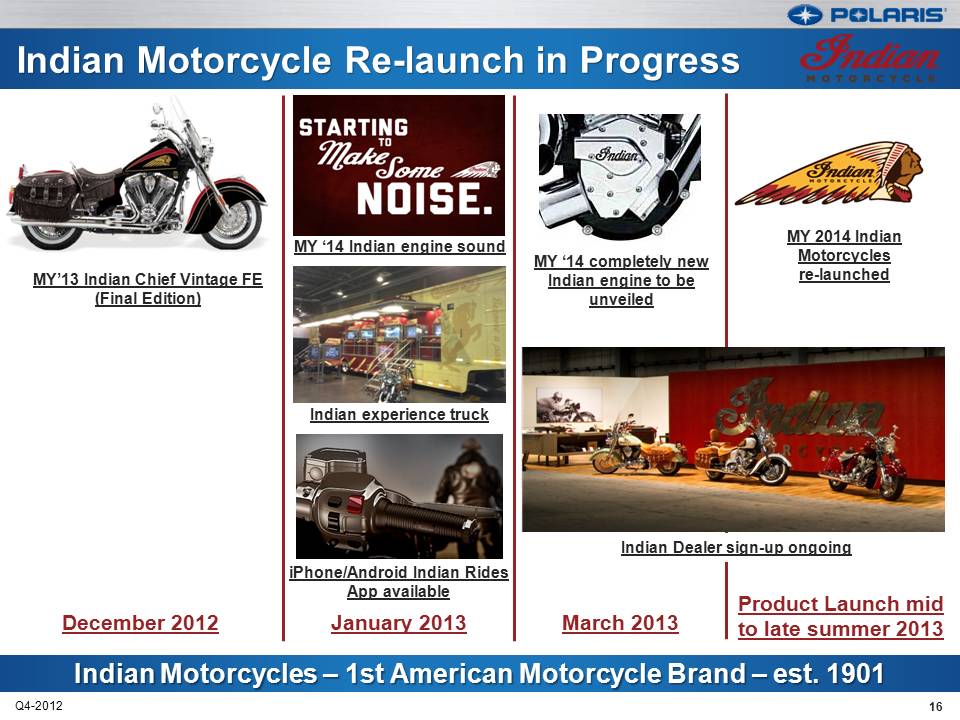
16 Q4-2012 January 2013 MY’13 Indian Chief Vintage FE (Final Edition) December 2012 March 2013 Product Launch mid to late summer 2013 MY ‘14 Indian engine sound MY ‘14 completely new Indian engine to be unveiled MY 2014 Indian Motorcycles re-launched Indian experience truck iPhone/Android Indian Rides App available Indian Dealer sign-up ongoing
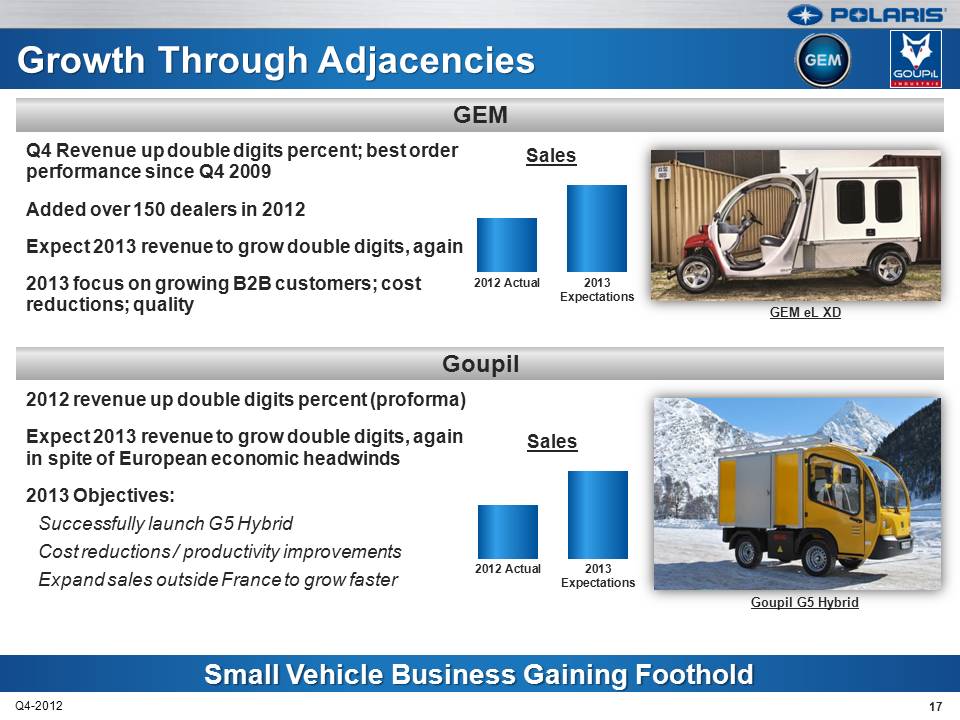
17 Q4-2012 Goupil Q4 Revenue up double digits percent; best order performance since Q4 2009 Added over 150 dealers in 2012 Expect 2013 revenue to grow double digits, again 2013 focus on growing B2B customers; cost reductions; quality 2012 revenue up double digits percent (proforma) Expect 2013 revenue to grow double digits, again in spite of European economic headwinds 2013 Objectives: Successfully launch G5 Hybrid Cost reductions / productivity improvements Expand sales outside France to grow faster GEM 2012 Actual 2013 Expectations Sales GEM eL XD Goupil G5 Hybrid 2012 Actual 2013 Expectations Sales
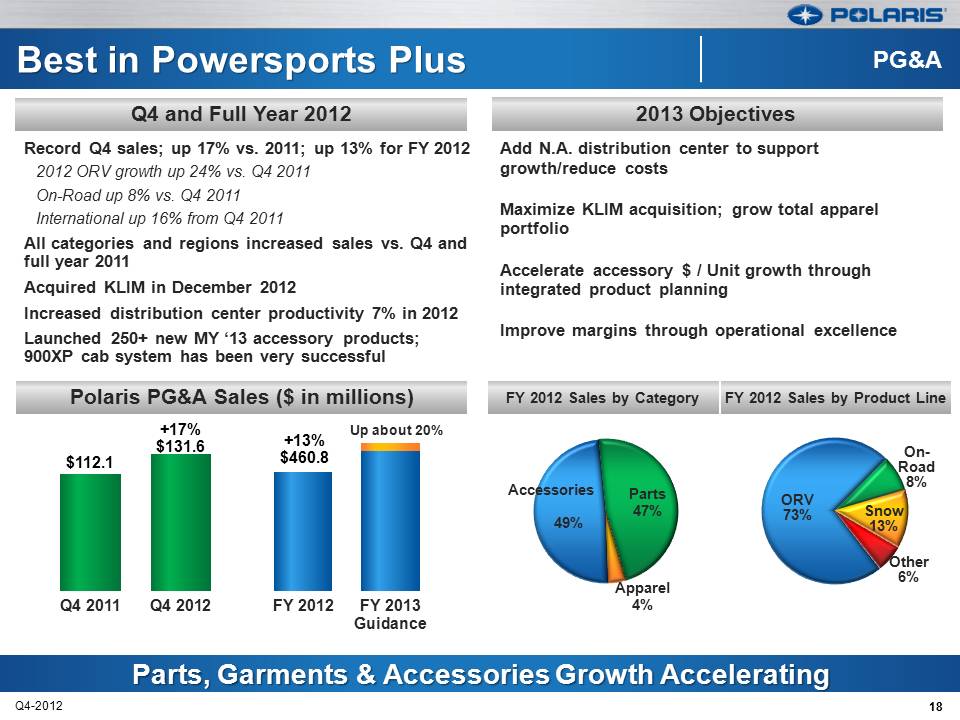
FY 2012 FY 2013 Guidance 18 Q4-2012 Polaris PG&A Sales ($ in millions) 2013 Objectives Q4 and Full Year 2012 Record Q4 sales; up 17% vs. 2011; up 13% for FY 2012 2012 ORV growth up 24% vs. Q4 2011 On-Road up 8% vs. Q4 2011 International up 16% from Q4 2011 All categories and regions increased sales vs. Q4 and full year 2011 Acquired KLIM in December 2012 Increased distribution center productivity 7% in 2012 Launched 250+ new MY ‘13 accessory products; 900XP cab system has been very successful 49% Parts 47% Apparel 4% Q4 2011 Q4 2012 +17% $131.6 +13% $460.8 $112.1 Up about 20% Accessories ORV 73% On-Road 8% Snow 13% Other 6% Add N.A. distribution center to support growth/reduce costs Maximize KLIM acquisition; grow total apparel portfolio Accelerate accessory $ / Unit growth through integrated product planning Improve margins through operational excellence FY 2012 Sales by Category FY 2012 Sales by Product Line
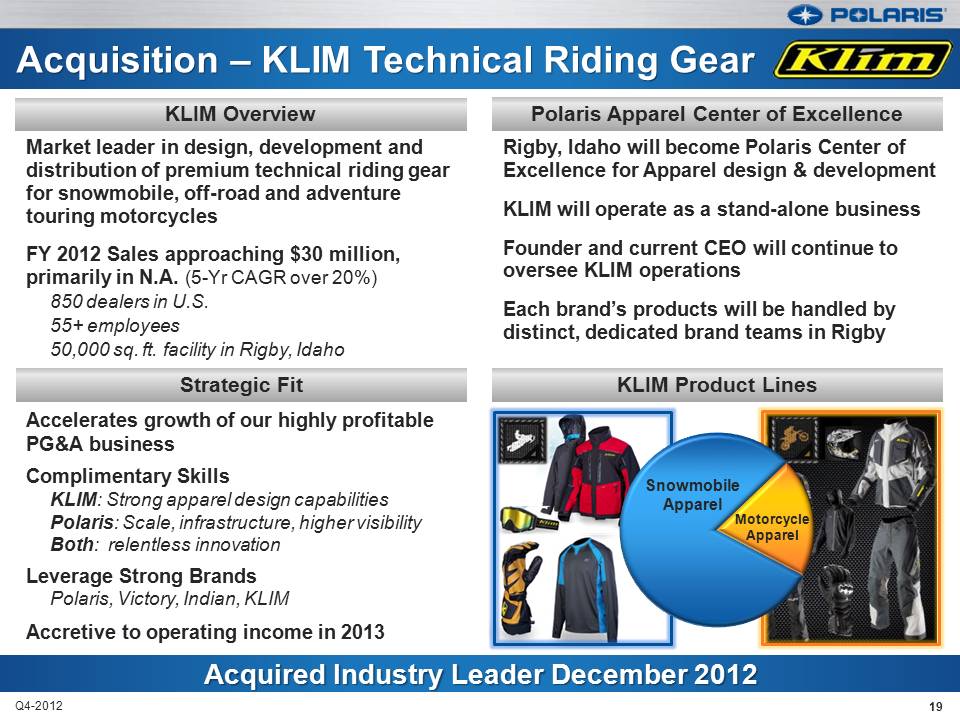
Q4-2012 Polaris Apparel Center of Excellence KLIM Overview Market leader in design, development and distribution of premium technical riding gear for snowmobile, off-road and adventure touring motorcycles FY 2012 Sales approaching $30 million, primarily in N.A. (5-Yr CAGR over 20%) 850 dealers in U.S. 55+ employees 50,000 sq. ft. facility in Rigby, Idaho Rigby, Idaho will become Polaris Center of Excellence for Apparel design & development KLIM will operate as a stand-alone business Founder and current CEO will continue to oversee KLIM operations Each brand’s products will be handled by distinct, dedicated brand teams in Rigby Accelerates growth of our highly profitable PG&A business Complimentary Skills KLIM: Strong apparel design capabilities Polaris: Scale, infrastructure, higher visibility Both: relentless innovation Leverage Strong Brands Polaris, Victory, Indian, KLIM Accretive to operating income in 2013 KLIM Product Lines Strategic Fit Snowmobile Apparel Motorcycle Apparel 19
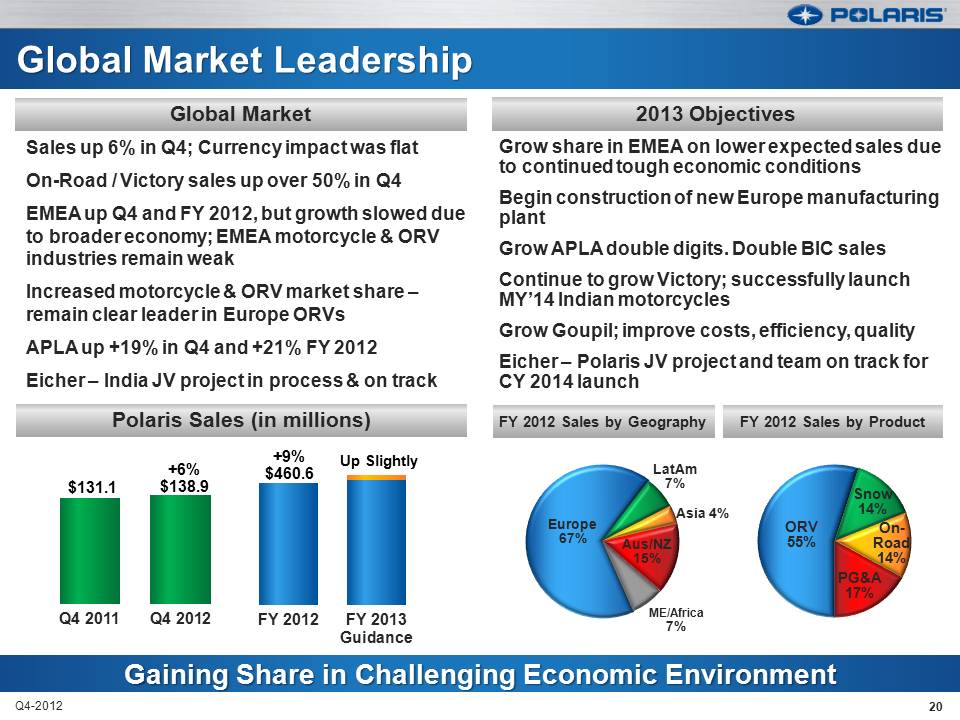
Global Market Leadership 20 Q4-2012 Polaris Sales (in millions) 2013 Objectives Global Market Gaining Share in Challenging Economic Environment ORV 55% Snow 14% On-Road 14% PG&A 17% Grow share in EMEA on lower expected sales due to continued tough economic conditions Begin construction of new Europe manufacturing plant Grow APLA double digits. Double BIC sales Continue to grow Victory; successfully launch MY’14 Indian motorcycles Grow Goupil; improve costs, efficiency, quality Eicher – Polaris JV project and team on track for CY 2014 launch Q4 2011 Q4 2012 FY 2012 FY 2013 Guidance Up Slightly +6% $138.9 +9% $460.6 $131.1 Sales up 6% in Q4; Currency impact was flat On-Road / Victory sales up over 50% in Q4 EMEA up Q4 and FY 2012, but growth slowed due to broader economy; EMEA motorcycle & ORV industries remain weak Increased motorcycle & ORV market share – remain clear leader in Europe ORVs APLA up +19% in Q4 and +21% FY 2012 Eicher – India JV project in process & on track Europe 67% LatAm 7% Asia 4% Aus/NZ 15% ME/Africa 7% FY 2012 Sales by Geography FY 2012 Sales by Product
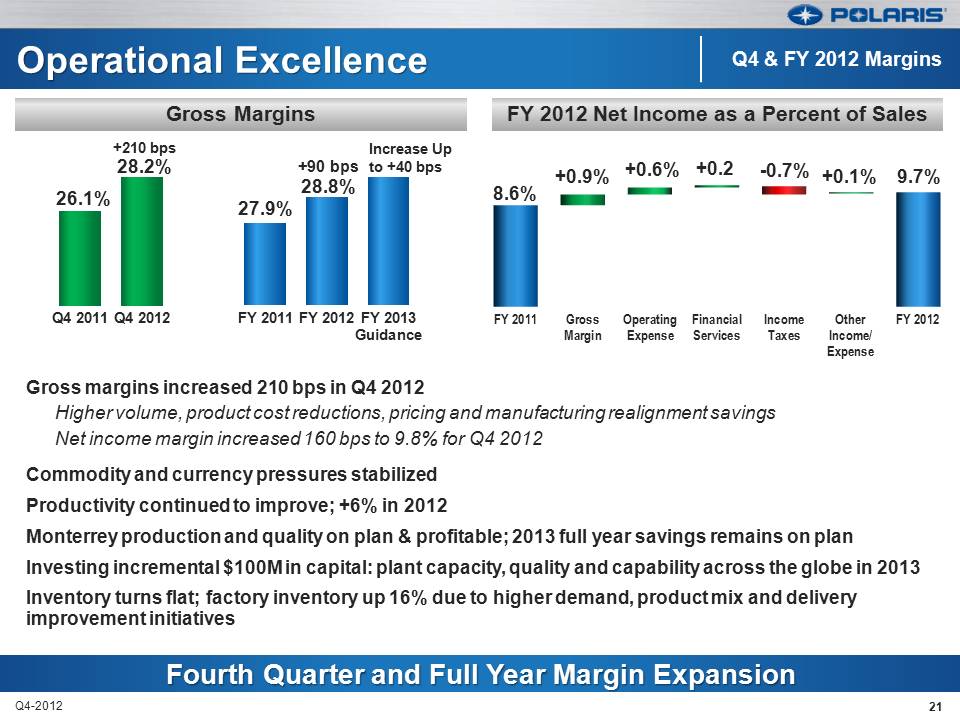
Gross margins increased 210 bps in Q4 2012 Higher volume, product cost reductions, pricing and manufacturing realignment savings Net income margin increased 160 bps to 9.8% for Q4 2012 Commodity and currency pressures stabilized Productivity continued to improve; +6% in 2012 Monterrey production and quality on plan & profitable; 2013 full year savings remains on plan Investing incremental $100M in capital: plant capacity, quality and capability across the globe in 2013 Inventory turns flat; factory inventory up 16% due to higher demand, product mix and delivery improvement initiatives 21 Q4-2012 27.9% +90 bps 28.8% 26.1% +210 bps 28.2% Q4 2011 Q4 2012 FY 2011 FY 2012 FY 2013 Guidance FY 2011 Gross Margin Operating Expense Financial Services Income Taxes Other Income/Expense FY 2012 8.6% +0.9% +0.6% +0.2 -0.7% +0.1% 9.7% FY 2012 Net Income as a Percent of Sales Gross Margins Increase Up to +40 bps
Mike Malone V.P. Finance & CFO Fourth Quarter & Full Year 2012 Earnings Results January 29, 2013 POLARIS INDUSTRIES INC.
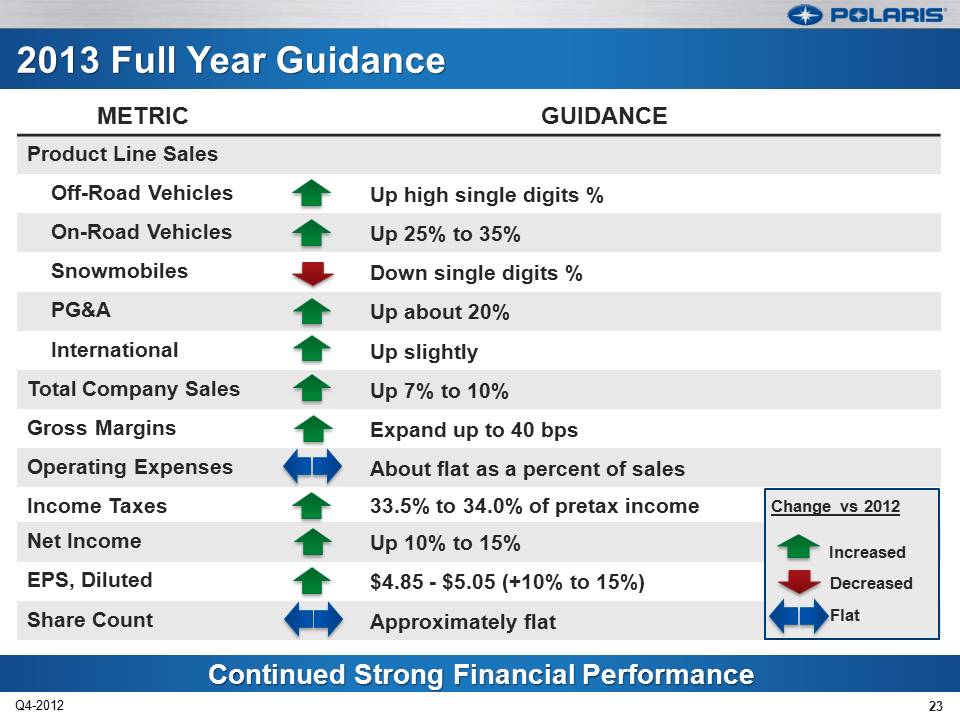
Continued Strong Financial Performance 2013 Full Year Guidance METRIC GUIDANCE Product Line Sales Off-Road Vehicles Up high single digits % On-Road Vehicles Up 25% to 35% Snowmobiles Down single digits % PG&A Up about 20% International Up slightly Total Company Sales Up 7% to 10% Gross Margins Expand up to 40 bps Operating Expenses About flat as a percent of sales Income Taxes 33.5% to 34.0% of pretax income Net Income Up 10% to 15% EPS, Diluted $4.85 - $5.05 (+10% to 15%) Share Count Approximately flat Change vs 2012 Increased Decreased Flat 23 Q4-2012
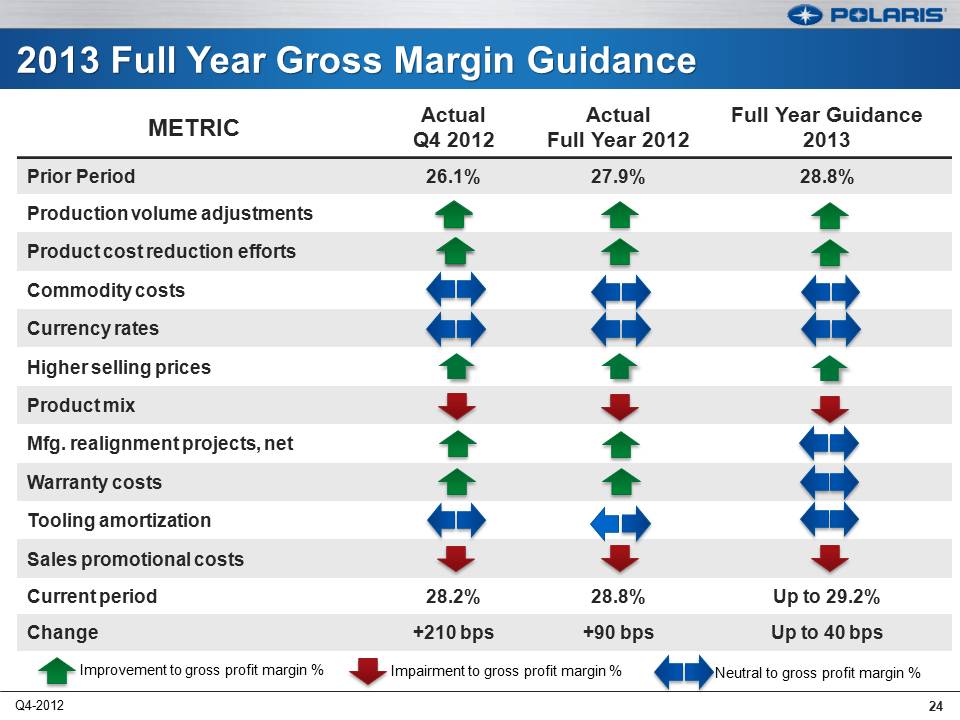
METRIC Actual Q4 2012 Actual Full Year 2012 Full Year Guidance 2013 Prior Period 26.1% 27.9% 28.8% Production volume adjustments Product cost reduction efforts Commodity costs Currency rates Higher selling prices Product mix Mfg. realignment projects, net Warranty costs Tooling amortization Sales promotional costs Current period 28.2% 28.8% Up to 29.2% Change +210 bps +90 bps Up to 40 bps Improvement to gross profit margin % Impairment to gross profit margin % Neutral to gross profit margin % 24 Q4-2012
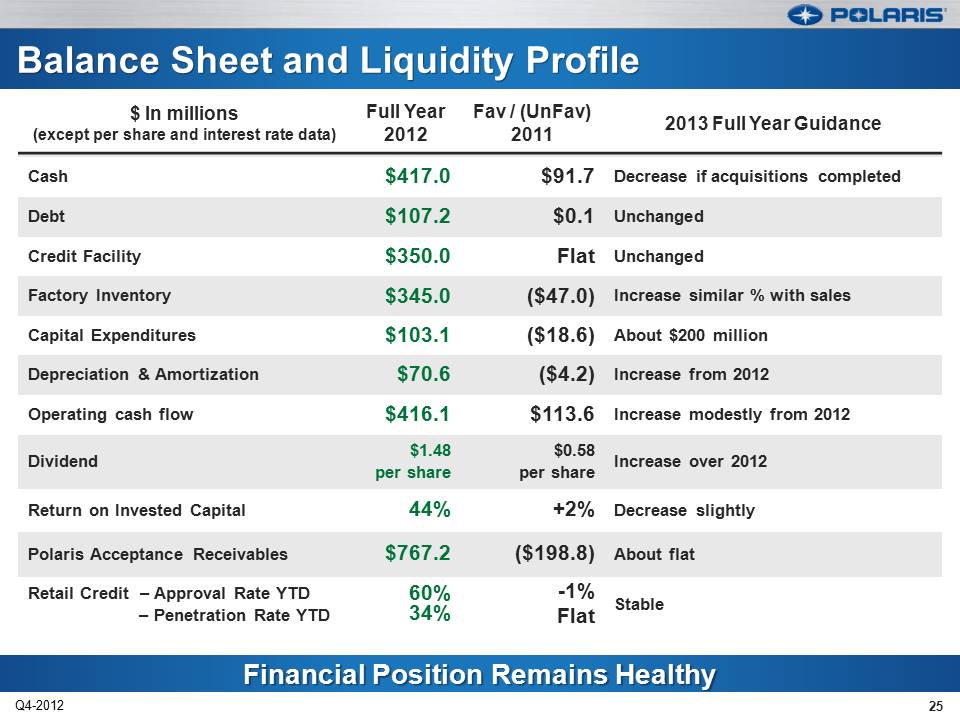
Financial Position Remains Healthy Balance Sheet and Liquidity Profile $ In millions (except per share and interest rate data) Full Year 2012 Fav / (UnFav) 2011 2013 Full Year Guidance Cash $417.0 $91.7 Decrease if acquisitions completed Debt $107.2 $0.1 Unchanged Credit Facility $350.0 Flat Unchanged Factory Inventory $345.0 ($47.0) Increase similar % with sales Capital Expenditures $103.1 ($18.6) About $200 million Depreciation & Amortization $70.6 ($4.2) Increase from 2012 Operating cash flow $416.1 $113.6 Increase modestly from 2012 Dividend $1.48 per share $0.58 per share Increase over 2012 Return on Invested Capital 44% +2% Decrease slightly Polaris Acceptance Receivables $767.2 ($198.8) About flat Retail Credit – Approval Rate YTD – Penetration Rate YTD 60% 34% -1% Flat Stable 25 Q4-2012

Scott Wine, CEO Fourth Quarter & Full Year 2012 Earnings Results January 29, 2013 POLARIS INDUSTRIES INC.
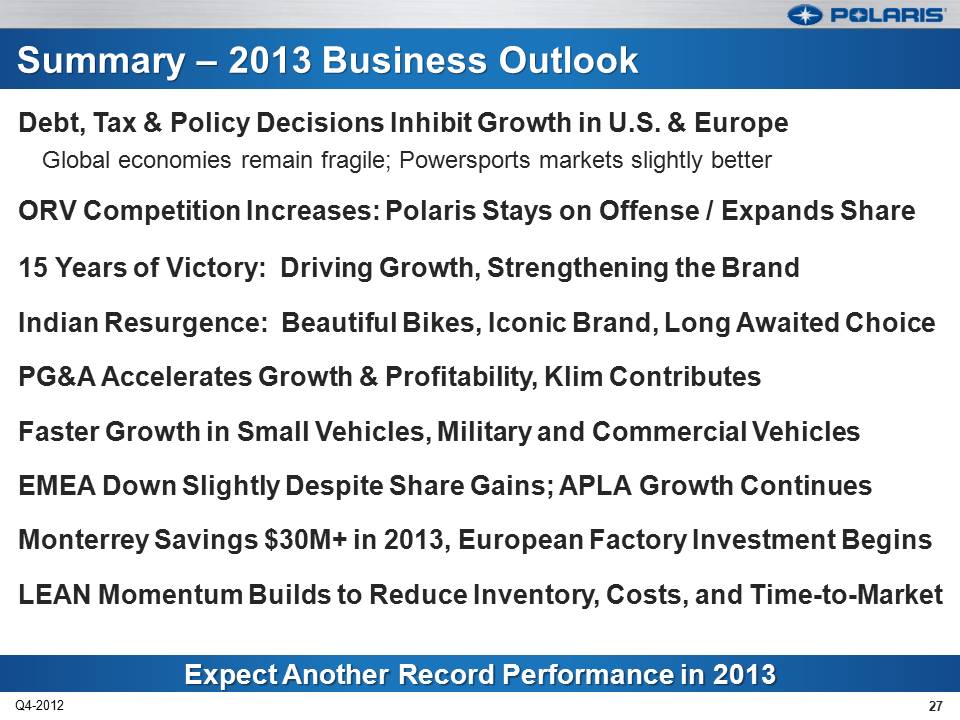
Debt, Tax & Policy Decisions Inhibit Growth in U.S. & Europe Global economies remain fragile; Powersports markets slightly better ORV Competition Increases: Polaris Stays on Offense / Expands Share 15 Years of Victory: Driving Growth, Strengthening the Brand Indian Resurgence: Beautiful Bikes, Iconic Brand, Long Awaited Choice PG&A Accelerates Growth & Profitability, Klim Contributes Faster Growth in Small Vehicles, Military and Commercial Vehicles EMEA Down Slightly Despite Share Gains; APLA Growth Continues Monterrey Savings $30M+ in 2013, European Factory Investment Begins LEAN Momentum Builds to Reduce Inventory, Costs, and Time-to-Market 27 Q4-2012
28 Q4-2012 Thank you Q & A