Attached files
| file | filename |
|---|---|
| 8-K - FORM 8-K - TEXAS CAPITAL BANCSHARES INC/TX | d472911d8k.htm |
| EX-99.1 - PRESS RELEASE - TEXAS CAPITAL BANCSHARES INC/TX | d472911dex991.htm |
 TCBI Q4 2012
Earnings
Exhibit 99.2 |
 2
Certain matters discussed on this call may contain forward-looking
statements, which are subject to risks and uncertainties and are
based on Texas Capital’s current estimates or expectations
of future events or future results. Texas Capital is under no obligation, and
expressly disclaims such obligation, to update, alter or revise its
forward-looking statements, whether as a result of new information,
future events or otherwise. A number of factors, many of which are
beyond Texas Capital’s control, could cause actual results to differ
materially from future results expressed or implied by such
forward-looking statements. These risks and uncertainties include the risk
of adverse impacts from general economic conditions, competition,
interest rate sensitivity and exposure to regulatory and legislative
changes. These and other factors that could cause results to differ
materially from those described in the forward-looking statements
can be found in the prospectus supplements, the Annual Report on Form
10-K and other filings made by Texas Capital with the
Securities and Exchange Commission (SEC). |
 Opening Remarks
•
Achieved record earnings in 2012
•
Reduction in credit costs and improvement in NPAs in 2012
•
Strong growth in LHI and deposits in 2012 with exceptional growth in
DDAs
•
LHS levels remained high in 2012; taking advantage of market
demand 3 |
 Financial Review
Net Income and EPS
–
Outstanding growth in 2012 net income, increased 59% over 2011 net
income Operating Leverage, Core Earnings Power & NIM
–
Growth of Net Revenue
•
17% growth from Q4-2011 and 6% from Q3-2012
–
Strong growth in LHI and LHS
–
Growth in net interest income
•
NIM reduction due to growth and impact of debt offering
•
Strong LHS levels with favorable spreads, with yields down
slightly •
Improved funding profile at reduced cost
•
Growth in DDA and total deposits and matched funding of LHS
–
Reduced credit costs in 2012 with reduction in NPAs and low level of
NCOs Capital
–
Capital position enhanced with successful addition of $198 million of
new regulatory capital raised during Q3-2012
•
$87 million in common equity
•
$111 million 6.5% 30-year subordinated debt
4 |
 Financial Review
Loan Growth
–
Broad-based growth in LHI
•
Averages increased 6% from Q3-2012 and 23% from Q4-2011
•
Quarter-end balance 10%, above 2012 average
–
Average LHS balances up 9% from Q3-2012 and 27% from
Q4-2011 Funding
–
Funding profile still strong with continued DDA and total deposit
growth •
Average DDA increased 17% from Q3-2012 and 42% from
Q4-2011 •
Quarter-end balance $178.6 million, or 8%, above Q4-12
average –
LHS match funded with borrowings and deposits, producing excellent
spreads for highly liquid, short- duration earning
assets Credit Costs
–
Total credit costs of $5.5 million for Q4-2012
•
Provision of $4.5 million compared to $3.0 million in Q3-2012,
primarily related to growth •
OREO valuation cost of $955,000 compared to $64,000 in
Q3-2012 •
NCOs of $3.5 million (21 bps) compared to $1.2 million (8 bps) in
Q3-2012 –
Favorable trend in NPA ratio with $4.5 million (6%) decrease from
Q3-12, including OREO reduction of $3.1 million (16%)
5 |
 Income Statement -
Quarterly
6
Q4-12
Q3-12
Q2-12
Q1-12
Q4-11
Net interest income
$ 101,155
$ 96,855
$ 90,640
$ 88,229
$ 88,147
Non-interest income
12,836
10,552
10,462
9,190
8,994
Net revenue
113,991
107,407
101,102
97,419
97,141
Provision for credit losses
4,500
3,000
1,000
3,000
6,000
OREO valuation and write-down expense
955
64
3,123
2,741
1,091
Total provision and OREO valuation
5,455
3,064
4,123
5,741
7,091
Non-interest expense
59,119
53,457
50,850
49,535
49,262
Income before income taxes
49,417
50,886
46,129
42,143
40,788
Income tax expense
17,982
18,316
16,506
15,062
15,043
Net income
$ 31,435
$ 32,570
$ 29,623
$ 27,081
$ 25,745
Diluted EPS
$ .76
$ .80
$ .76
$ .70
$ .67
Net interest margin
4.27%
4.36%
4.49%
4.54%
4.60%
ROA
1.27%
1.40%
1.40%
1.33%
1.28%
ROE
15.35%
17.27%
18.08%
17.36%
17.05%
Efficiency
(1)
48.4%
49.8%
50.3%
50.8%
50.7%
(1) Excludes OREO valuation charge and $4 million litigation
settlement in Q4-12 |
 Income Statement -
Annual
7
2012
2011
2010
2009
2008
Net interest income
$ 376,879
$ 302,937
$ 241,674
$ 196,691
$ 151,737
Non-interest income
43,040
32,232
32,263
29,260
22,470
Net revenue
419,919
335,169
273,937
225,951
174,207
Provision for credit losses
11,500
28,500
53,500
43,500
26,750
OREO valuation and write-down expense
6,883
6,798
8,504
7,809
–
Total provision and OREO valuation
18,383
35,298
62,004
51,309
26,750
Non-interest expense
212,961
181,403
154,984
137,733
109,651
Income before income taxes
188,575
118,468
56,949
36,909
37,806
Income tax expense
67,866
42,366
19,626
12,522
12,924
Net income
$ 120,709
$ 76,102
$ 37,323
$ 24,387
$ 24,882
Diluted EPS
$ 3.01
$ 1.99
$ 1.00
$ .56
$ .89
Net interest margin
4.41%
4.68%
4.28%
3.89%
3.54%
ROA
1.35%
1.12%
.63%
.46%
.55%
ROE
16.93%
13.39%
7.23%
5.15%
7.46%
Efficiency
(1)
49.8%
54.1%
56.6%
61.0%
62.9%
(1) Excludes OREO valuation charge and $4 million litigation
settlement in 2012 |
 QTD Average Balances, Yields and Rates
8
(in thousands)
Q4 2012
Q3 2012
Q4 2011
Avg. Bal.
Yield Rate
Avg. Bal.
Yield Rate
Avg. Bal.
Yield Rate
Assets
Securities
$ 103,483
4.55%
$ 110,300
4.53%
$ 139,826
4.43%
Fed funds sold & liquidity investments
91,503
.27%
74,219
.30%
51,149
.36%
Loans held for sale
2,658,092
3.96%
2,432,027
4.00%
2,093,883
4.23%
Loans held for investment
6,662,817
4.79%
6,313,263
4.81%
5,395,253
5.09%
Total loans, net of reserve
9,246,997
4.59%
8,672,917
4.63%
7,421,922
4.89%
Total earning assets
9,441,983
4.55%
8,857,436
4.59%
7,612,897
4.85%
Total assets
$9,869,282
$9,256,864
$7,995,474
Liabilities and Stockholders’
Equity
Total interest bearing deposits
$4,662,116
.28%
$4,649,823
.29%
$3,965,614
.35%
Other borrowings
1,725,129
.19%
1,639,953
.21%
1,588,198
.17%
Subordinated notes
111,000
6.56%
12,065
6.86%
–
–
Long-term debt
113,406
2.33%
113,406
2.43%
113,406
2.34%
Total interest bearing liabilities
6,611,651
.40%
6,415,247
.32%
5,667,218
.34%
Demand deposits
2,356,758
2,010,694
1,659,132
Stockholders’
equity
814,565
750,113
598,982
Total liabilities and stockholders’
equity
$9,869,282
.27%
$9,256,864
.22%
$7,995,474
.24%
Net interest margin
4.27%
4.36%
4.60% |
 Financial Summary
9
(in thousands)
QTD Averages
Q4 2012
Q3 2012
Q4 2011
Q4/Q3 %
Change
YOY %
Change
Total assets
$9,869,282
$9,256,864
$7,995,474
7%
23%
Loans held for investment
6,662,817
6,313,263
5,395,253
6%
23%
Loans held for sale
2,658,092
2,432,027
2,093,883
9%
27%
Total loans
9,320,909
8,745,290
7,489,136
7%
24%
Securities
103,483
110,300
139,826
(6)%
(26)%
Demand deposits
2,356,758
2,010,694
1,659,132
17%
42%
Total deposits
7,018,874
6,660,517
5,624,746
5%
25%
Stockholders’
equity
814,565
750,113
598,982
9%
36% |
 Financial Summary
10
(in thousands)
YTD Averages
2012
2011
YOY % Change
Total assets
$8,965,961
$6,819,088
31%
Loans held for investment
6,148,860
5,059,134
22%
Loans held for sale
2,298,651
1,210,954
90%
Total loans
8,447,511
6,270,088
35%
Securities
117,375
157,120
(25)%
Demand deposits
1,984,171
1,515,021
31%
Total deposits
6,444,007
5,361,475
20%
Stockholders’
equity
713,190
568,147
26% |
 Financial Summary
11
(in thousands)
Period End
Q4 2012
Q3 2012
Q4 2011
Q4/Q3 %
Change
YOY %
Change
Total assets
$10,540,542
$9,881,362
$8,137,225
7%
30%
Loans held for investment
6,785,535
6,549,089
5,572,371
4%
22%
Loans held for sale
3,175,272
2,818,622
2,080,081
13%
53%
Total loans
9,960,807
9,367,711
7,652,452
6%
30%
Securities
100,195
107,288
143,710
(7)%
(30)%
Demand deposits
2,535,375
2,114,279
1,751,944
20%
45%
Total deposits
7,440,804
6,717,579
5,556,257
11%
34%
Stockholders’
equity
836,242
802,406
616,331
4%
36% |
 Revenue and Income Growth
($ in thousands)
Non-Interest Income
12
(1) Excludes OREO valuation charge for 2012, 2011 and 2010.
98,606
109,651
137,733
154,985
181,403
212,961
160,379
174,207
225,951
273,937
335,169
419,919
0
50,000
100,000
150,000
200,000
250,000
300,000
350,000
400,000
450,000
2007
2008
2009
2010
2011
2012
Non
-Interest Expense
Net Interest Income
Operating Revenue CAGR: 21%
Net Interest
Income CAGR:
22%
Non-interest Income CAGR: 16%
Non-interest Expense CAGR: 17%
Net Income CAGR: 31% |
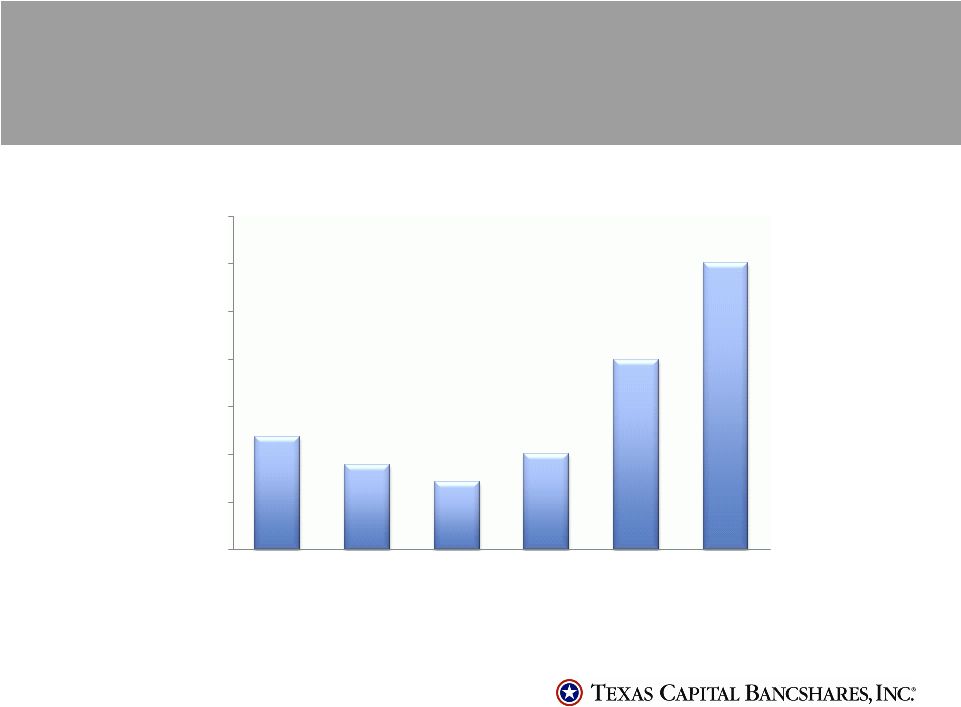 EPS Growth
2007
2008
2009^
2010
2011
5 Year EPS CAGR: 21%
2012
^Excludes $.15 effect of preferred TARP dividend during 2009. Reported
EPS was $0.56. 13
$1.18
$0.89
$0.71
$1.00
$1.99
$3.01
$0.00
$0.50
$1.00
$1.50
$2.00
$2.50
$3.00
$3.50 |
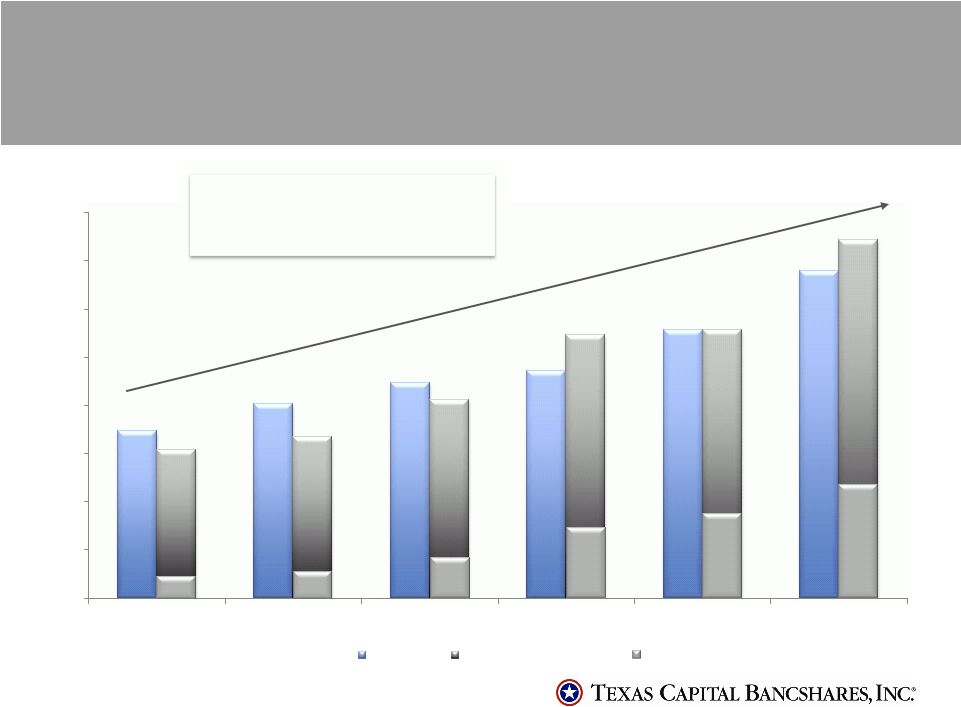 3462
4028
4457
4711
5572
6786
3066
3333
4121
5455
5557
7441
0
1000
2000
3000
4000
5000
6000
7000
8000
2007
2008
2009
2010
2011
2012
Loans HFI
Interest Bearing Deposits
Deposit and Loan Growth
($ in millions)
Demand Deposits
14
Demand Deposit CAGR: 37%
Total Deposit CAGR: 19%
Loans Held for Investment CAGR: 14% |
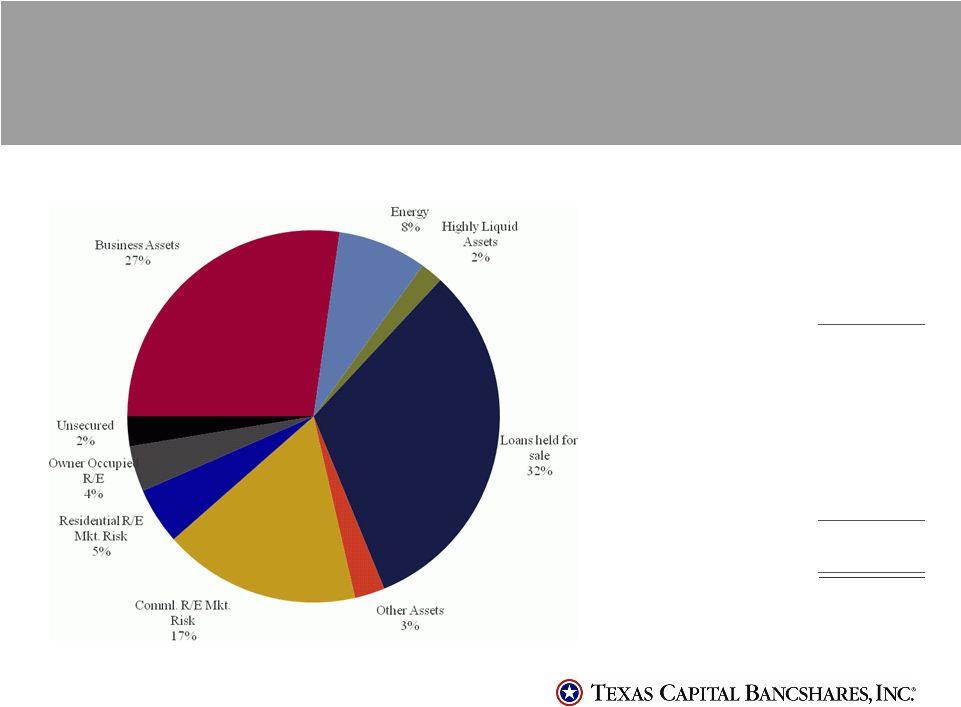 Loan Portfolio Statistics
15
Non-accrual loans
Commercial
$ 15,373
Construction
17,217
Real estate
23,066
Consumer
57
Equipment leases
120
Total non-accrual loans
$ 55,833
Non-accrual loans as % of
loans held for investment
.82%
Non-accrual loans as % of
total loans
.56%
OREO
15,991
Total Non-accruals +
OREO
$ 71,824
Non-accrual loans + OREO
as % of loans held for
investment + OREO
1.06%
Total Loans $9,960,807
All numbers in thousands.
Loan Collateral by Type 12/31/12 |
 Credit Quality
Improved Credit Trends
–
Total credit cost of $5.5 million for Q4-2012, compared to $3.1
million in Q3-2012 and $7.1 million in Q4-2011
•
Provision of $4.5 million for Q4-2012 compared to $3.0 million for
Q3-2012 and $6.0 million in Q4-2011, reflecting better
credit trends in 2012, but increases for growth
•
NCOs for YTD of 10 bps, with $3.5 million (21 bps) in Q4-2012
compared to 25 bps in Q4-2011
•
OREO valuation charge of $955,000 compared to $64,000 in Q4-2012
and $1.1 million in Q4-2011
–
NPA ratio continues to decline
•
Reduction of $16.8 million (19%) from Q4-2011 and $4.5 million
(6%) from Q3-2012 •
NPA ratio of 1.06% compared to 1.16 % in Q3-2012 and 1.58% in
Q4-2011 •
NPLs at $55.8 million, down $1.4 million from Q3-2012 and down
$1.3 million from Q4- 2011
•
NPL
ratio
at
0.56%
of
total
loans
and
0.82%
of
LHI
•
OREO reduction of $3.1 million (16%) from Q3-2012 and $18.1
million (53%) from Q4- 2011
–
Achieved reduction in 2012 credit costs consistent with improvement in
credit metrics 16 |
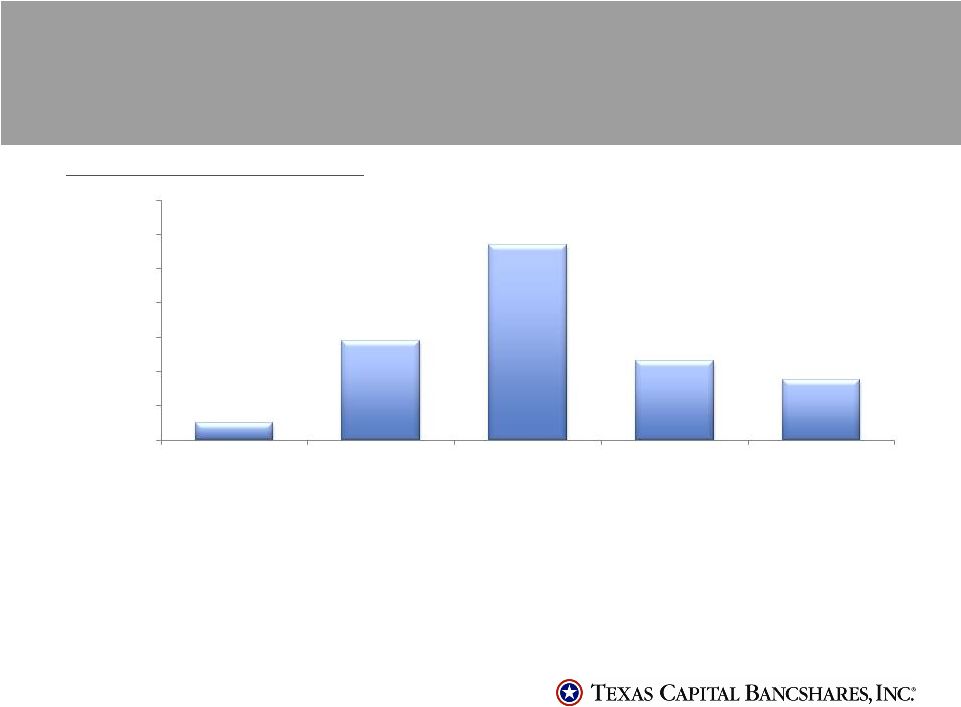  Credit Quality
17
Net Charge-offs / Average Loans
* Excludes loans held for sale.
Combined reserve /
Loans
*
1.15%
1.31%
1.56%
1.59%
1.16%
Non-accrual loans +
OREO to loans
*
+
OREO
1.06%
1.58%
3.25%
2.74%
1.81%
Combined reserve to
non-accruals
1.3x
1.3x
.6x
.7x
1.0x
0.00%
0.20%
0.40%
0.60%
0.80%
1.00%
1.20%
1.40%
2012
2011
2010
2009
2008
0.10%
0.58%
1.14%
0.46%
0.35% |
 Closing Comments
•
Strong core earnings and growth to continue in 2013
•
Credit costs in 2013 expected to be slightly lower than 2012
•
Strong LHI pipeline and new commitments present opportunity for growth
potential
•
LHS
balances
to
stay
high
and
could
grow
modestly
with
increased
market
share and participation program
18 |
 Q&A
19 |