Attached files
| file | filename |
|---|---|
| 8-K - FORM 8-K - POPULAR, INC. | d472057d8k.htm |
 Financial
Results Financial Results
Fourth Quarter 2012
Fourth Quarter 2012
Exhibit 99.1 |
 The
information
contained
in
this
presentation
includes
forward-looking
statements
within
the
meaning
of
the
Private
Securities
Litigation
Reform
Act
of
1995.
These
forward-looking
statements
are
based
on
management’s
current
expectations
and
involve
risks
and
uncertainties
that
may
cause
the
Company's
actual
results
to
differ
materially
from
any
future
results
expressed
or
implied
by
such
forward-looking
statements.
Factors
that
may
cause
such
a
difference
include,
but
are
not
limited
to
(i)
the
rate
of
growth
in
the
economy
and
employment
levels,
as
well
as
general
business
and
economic
conditions;
(ii)
changes
in
interest
rates,
as
well
as
the
magnitude
of
such
changes;
(iii)
the
fiscal
and
monetary
policies
of
the
federal
government
and
its
agencies;
(iv)
changes
in
federal
bank
regulatory
and
supervisory
policies,
including
required
levels
of
capital;
(v)
the
relative
strength
or
weakness
of
the
consumer
and
commercial
credit
sectors
and
of
the
real
estate
markets
in
Puerto
Rico
and
the
other
markets
in
which
borrowers
are
located;
(vi)
the
performance
of
the
stock
and
bond
markets;
(vii)
competition
in
the
financial
services
industry;
(viii)
possible
legislative,
tax
or
regulatory
changes;
(ix)
the
impact
of
the
Dodd-Frank
Act
on
our
businesses,
business
practice
and
cost
of
operations;
and
(x)
additional
Federal
Deposit
Insurance
Corporation
assessments.
Other
than
to
the
extent
required
by
applicable
law,
the
Company
undertakes
no
obligation
to
publicly
update
or
revise
any
forward-looking
statement.
Please
refer
to
our
Annual
Report
on
Form
10-K
for
the
year
ended
December
31,
2011
and
other
SEC
reports
for
a
discussion
of
those
factors
that
could
impact
our
future
results.
The
financial
information
included
in
this
presentation
for
the
quarter
ended
December
31,
2012
is
based
on
preliminary
unaudited
data
and
is
subject
to
change.
1
Forward Looking Statements |
 Highlights
•
Non performing loans held in portfolio declined by $125 million QoQ and down
$313 million YoY
•
Commercial,
construction
and
legacy
NPL
inflows
decreased
by
$73
million,
or
51%
QoQ, $402 million YoY ; lowest level in three years
•
Strong capital ratios: Common Equity Tier One ratio at 13.18%; excess of $1.9 billion
over well capitalized threshold
•
Well positioned to exceed proposed Basel III capital requirements
•
Tangible Book Value/Share $32.55 and $28.32 (ex TARP discount)
•
$24 million cash dividend from EVERTEC; 48.5% stake carried at $74 million
•
Improved performance from covered loan portfolio
•
Net interest margin of 4.41%
•
Puerto
Rico
mortgage
business
had
its
highest
origination
volume
in
2012
since
2005
•
Fitch recently upgraded Popular’s senior unsecured rating to BB-
2
•
Q4 net income $84 million which includes EVERTEC tax benefit of $27 million*
•
2012 net income $245 million
Earnings
Credit
(excludes covered loans)
Capital
Other
*EVERTEC tax benefit impact of $32 million before tax
Commercial NPLs declined $107 million QoQ driven by improved credit mostly in
PR |
 Addressing Key
Areas of Shareholder Focus •
Reducing non-performing loans
Total NPLs held in portfolio declined $313 million in 2012
–
Commercial, mortgage and construction NPLs decreased by $165 million, $56
million and $53 million respectively
Reduced HFS balance (excluding mortgages) to $96 million from $473
million in Q4 2010
Provision expense for the year is 22% lower, declining to $334 million
Continue to actively pursue NPL sales that make economic sense
•
TARP exit framework
No contractual maturity and no US Treasury “call”
Rate reset is not a consideration
–
December
2013
reset
will
have
no
material
impact
on
earnings,
as
the
effective interest expense is approximately 9% of the par value of $935
million
We will exit at appropriate time with least possible dilution
–
Could be series of partial payments, lump-sum or a secondary market
transaction by the US Treasury
3
Credit
(excludes covered loans)
TARP |
 Fundamental
Strengths •
Premier franchise in PR with #1 market position in most product categories
and strong revenue generating capacity
PR mortgage business (~32% market share) increased originations by 15%
in Q4 and by 21% for the full year with $1.5 billion
PR commercial loans increased by $113 million during Q4 (ex. covered
loans)
BPPR margin was 5.18%
•
US commercial loans (excluding legacy loans) increased by $117 million in
the fourth quarter
•
In 2012, supplemented originations with $800 million in high-quality loan
purchases
$475 million in US mortgages and $321 million in Puerto Rico consumer
and mortgage loans
•
Revenue generating capacity remains strong; gross revenues at $1.8 billion
for 2012
4 |
 Financial
Results (Unaudited) 5
In thousands, except per share amount
Q4 2012
Q3 2012
Variance
Net interest income
$350,411
$343,426
$6,985
Service fees & other oper. income
150,249
114,840
35,409
Gain on sale of investments, loans & trading profits
19,576
7,576
12,000
FDIC loss-share expense
(36,824)
(6,707)
(30,117)
Gross revenues
483,412
459,135
24,277
Provision for loan losses
(excluding covered loans)
86,256
83,589
2,667
Provision for loan
losses (covered WB loans)
(3,445)
22,619
(26,064)
Net revenues
400,601
352,927
47,674
Personnel costs
116,325
111,550
4,775
Other operating expenses
180,422
178,805
1,617
Total operating expenses
296,747
290,355
6,392
Income before tax
103,854
62,572
41,282
Income tax expense
19,914
15,384
4,530
Net income
$83,940
$47,188
$36,752
EPS
$0.81
$0.45
$0.36
NIM
4.41%
4.37%
0.04%
Tangible book value per share (quarter end)
$32.55
$32.15
$0.40
Market price (quarter end)
$20.79
$17.45
$3.34 |
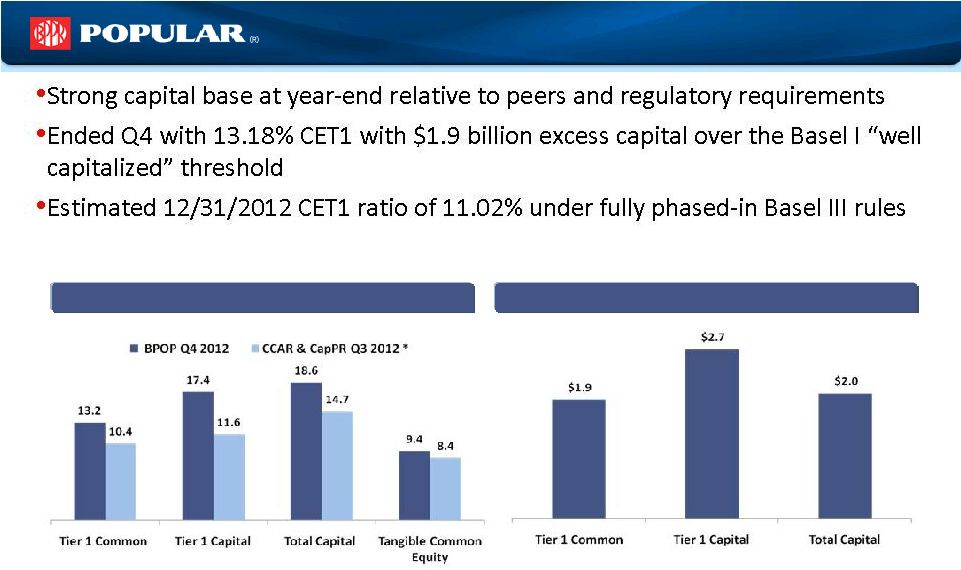 Capital
6
Current Risk Weighted Assets are approximately $23.4 billion at Q4
Capital Ratios %
Excess Capital ($) in billions **
**Excess capital over “well capitalized”
Basel I threshold
*Comprehensive
Capital
Analysis
and
Review
(CCAR)
of
19
firms
as
well
as
the
Capital
Plan
Review
(CapPR)
of
an
additional
11
bank
holding
companies
with
$50
billion
or
more
of
total
consolidated
assets. |
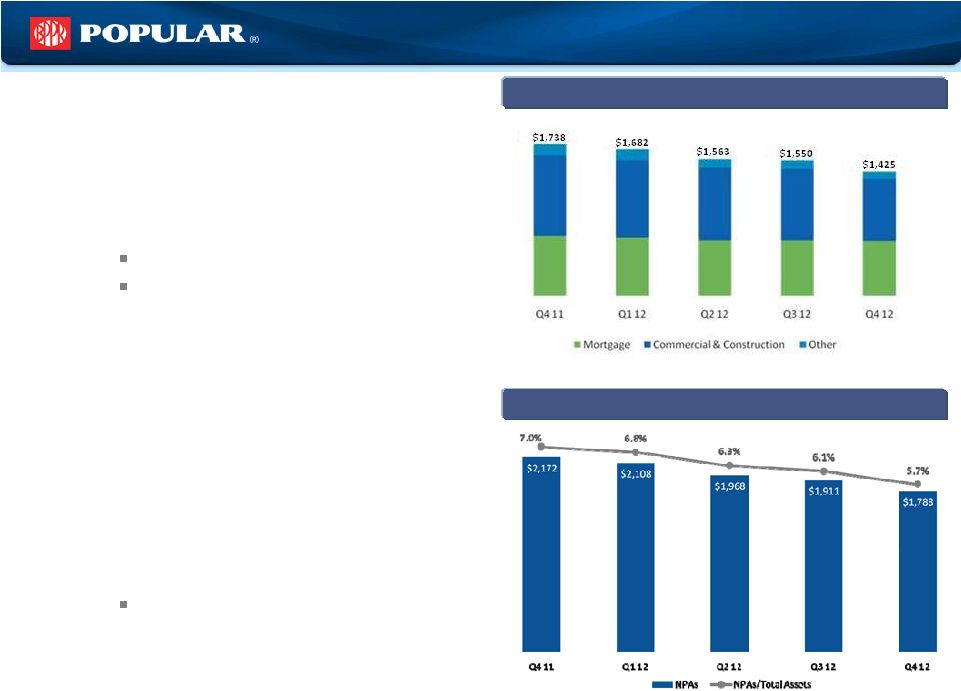 Consolidated
Credit Summary (Excluding Covered Loans) Continued improvement in
key credit quality metrics:
•
Non performing loans held-in-
portfolio declined:
$125 million or 8% QoQ
$313 million or 18% YoY
•
PR Commercial NPLs held-in-portfolio
are down by $90 million QoQ and
$108 million YoY
•
Non performing assets declined by
$123 million, or 6% QoQ and declined
$384 million or 18% YoY
NPLs held for sale are $166
million down YoY
Non-Performing Loans HIP ($M)
7
Non-Performing Assets ($M) |
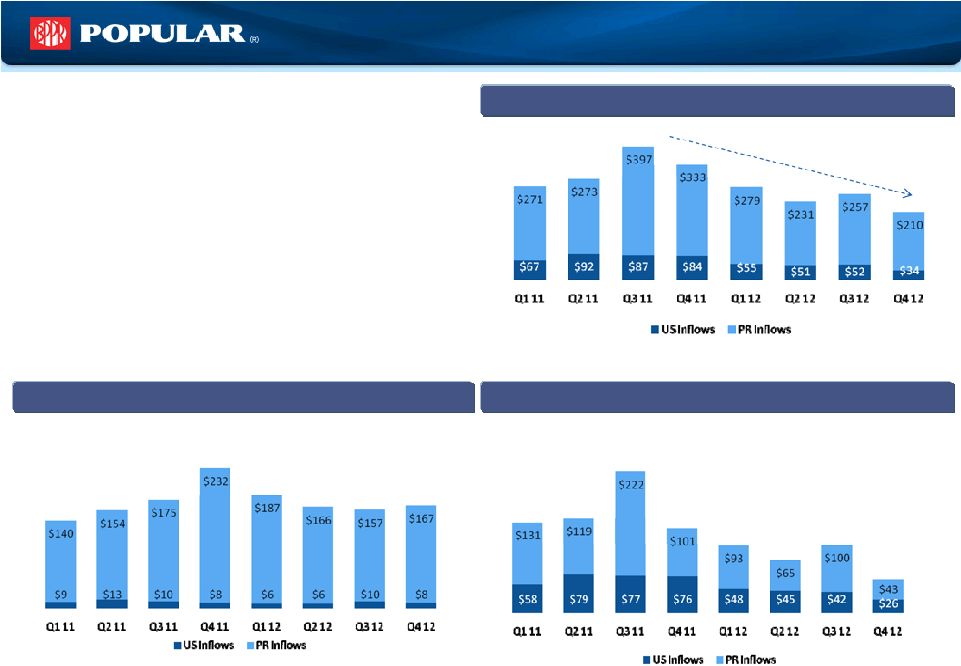 Total NPL
Inflows ($M) NPL inflows at 3-year lows
•
Total NPL inflows decreased by $65 million
QoQ and are at the lowest level in three years
•
Commercial, construction and legacy NPL
inflows decreased by $73 million QoQ driven
by credit improvements in both PR and the US
•
Mortgage NPL inflows increased by $8 million
QoQ but charge offs remain low in Q4
Mortgage NPL Inflows ($M)
Commercial, Construction & Legacy NPL Inflows ($M)
8
Excludes consumer loans |
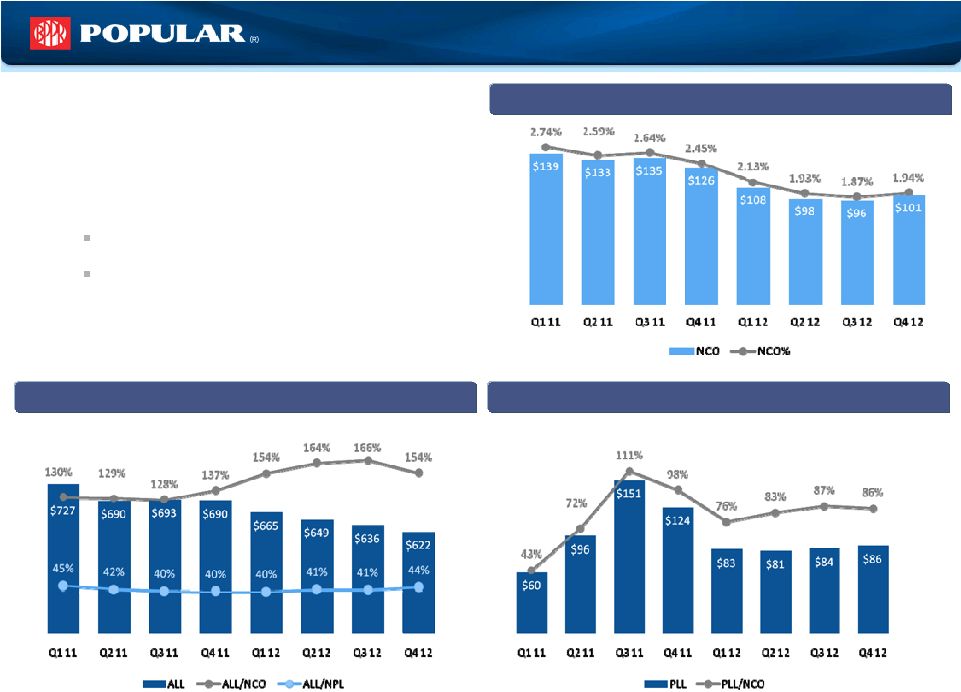 Credit Quality
Overview (Excluding Covered Loans) •
NCO ratio under 2% for the year; at lowest
point since 2007
•
Provision increased slightly to $86 million
driven by PR
PR PLL/NCO –
100%
US PLL/NCO –
36%
•
ALL/NPL increased to 44% driven by the
reduction in NPLs
ALLL ($M), ALLL-to-NCO and ALLL-to-NPL Ratios
NCO ($M) and NCO-to-HIP Loan Ratio
Provision ($M) and Provision-to-NCO Ratio
9 |
 Continue to
Leverage Strengths and Drive Value •
Drivers of shareholder value in 2013
Continue to reduce NPLs through aggressive loss
mitigation efforts and sales that make economic sense
Capitalize on our leading market position to drive
originations and sustain above average margins
Make further improvements in our US franchise
Continue to build financial strength and flexibility
•
Investor Day March 1
, 2013 in San Juan, PR
10
st |
 Appendix
 |
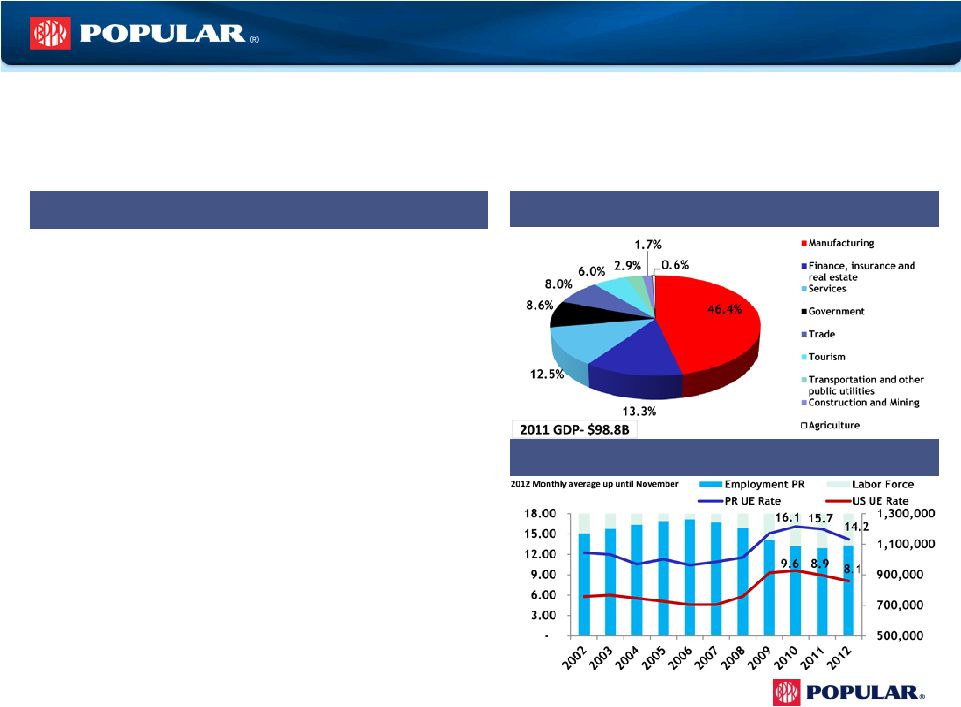 12
PR Economic Overview
•
11.5% increase of real gross domestic investment in FY
2010-11 marks largest increase in more than a decade
•
Housing Stimulus: extended through 6/30/13
•
Public/Private Partnerships (PPPs): $2.6B Airport, $1.4B toll
roads, $878 million schools
•
Unemployment rate for December 14%; down 12% from
the peak
•
Hotel registration of non-residents registered highest
occupancy rates in the last few years
•
GDB-EAI for the month of October registered a 0.2% YoY
increase, maintaining the upward trend started in
December 2011
GDP –
Composition by sector
Recent Trends
•
Official forecast calls for first positive GNP growth since 2005. Forecast is +0.4% (fiscal
2012) and +0.6% (fiscal 2013)
•
In
the
last
several
quarters,
indicators
such
as
retail
and
auto
sales,
home
sales,
cement
sales
and
sales
&
use
tax
among others show stabilization
Source: Government Development Bank of PR bgfpr.com, PR Finance
Housing Authority, PR commissioner of Financial Institutions
PR Labor Market |
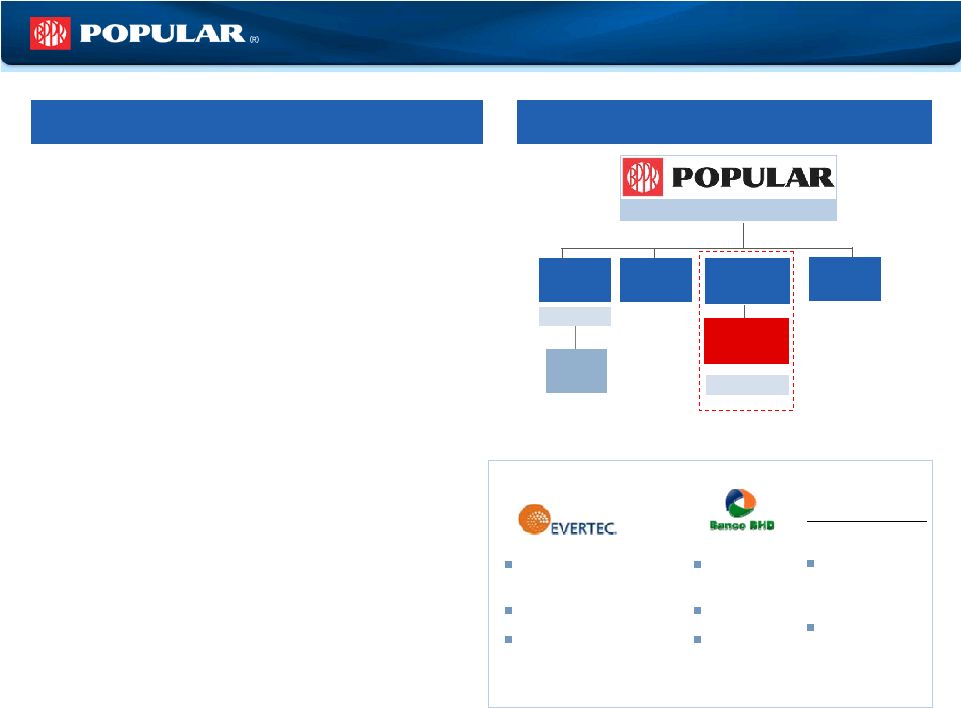 Who We Are
– Popular, Inc.
Franchise
•
Financial services company
•
Headquartered in San Juan, Puerto Rico
•
$37 billion in assets (top 50 bank holding company in
the U.S.)
•
$25 billion in total loans
•
$27 billion in total deposits
•
279 branches serving customers in Puerto Rico, New
York, California, Florida, Illinois, U.S. Virgin Islands,
and New Jersey
•
NASDAQ ticker symbol: BPOP
•
Market Cap: $2.1 billion¹
1
As of December 31, 2012
*Doing business as Popular Community Bank.
Summary Corporate Structure
Assets = $36.5bn
Popular Auto,
Inc.
Banco Popular
de Puerto Rico
Popular
Securities, Inc.
Assets = $27.6 bn
Assets = $8.7bn
Banco Popular
North America*
Puerto Rico operations
Selected
equity
investments
(first
two
under
“corporate”
segment
and
third
under
PR):
Popular
Insurance, Inc.
Popular North
America, Inc.
U.S. banking operations
Transaction processing,
business processes outsourcing
48.5% stake
Adjusted EBITDA of $117.8
million for the first 9 months of
2012
Dominican
Republic bank
19.99% stake
2011 approximate
income $100
million
PRLP 2011 Holdings
Construction and
commercial loans
vehicle
24.9% stake
13 |
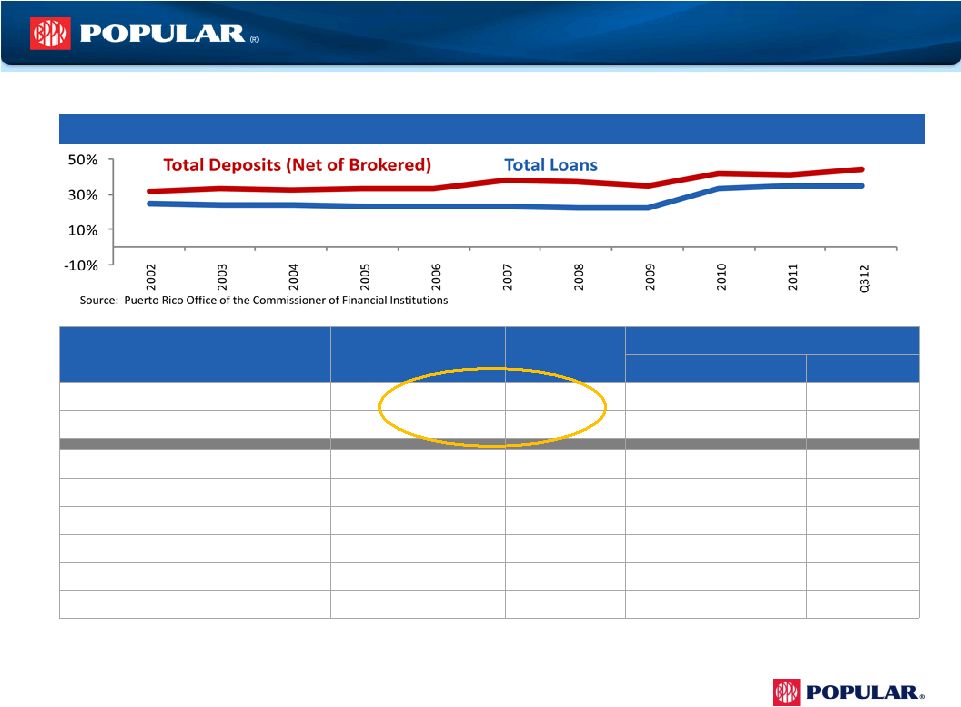 PR Franchise
Value Built Over 119 Years Category
Market Position as of
Q3 2012
Market Share
as of Q3 2012
Top Competitor
Institution/Group
Share
Total Deposits (Net of Brokered)
1
38%
Santander
14%
Total Loans
1
35%
FirstBank
16%
Commercial & Construction Loans
1
41%
FirstBank
18%
Credit Cards
1
50%
FirstBank
15%
Mortgage Loan Production
1
30%
Doral
16%
Personal Loans
1
35%
FirstBank
9%
Auto Loans/Leases
3
16%
Reliable
26%
Assets Under Management
3
13%
UBS
47%
•
Indisputable, sustained market leadership
Market Share Trend (2002–
2012)
14
Source: Puerto Rico Office of the Commissioner of Financial Institutions & 10K
reports Credit Unions: A total of 115 credit unions were in business as of
September 30, 2012, guaranteed by the (COSSEC). Total loans $4.3
billion with a 8% market share (49.% in personal loans; market share 50%).
1
1
1 |
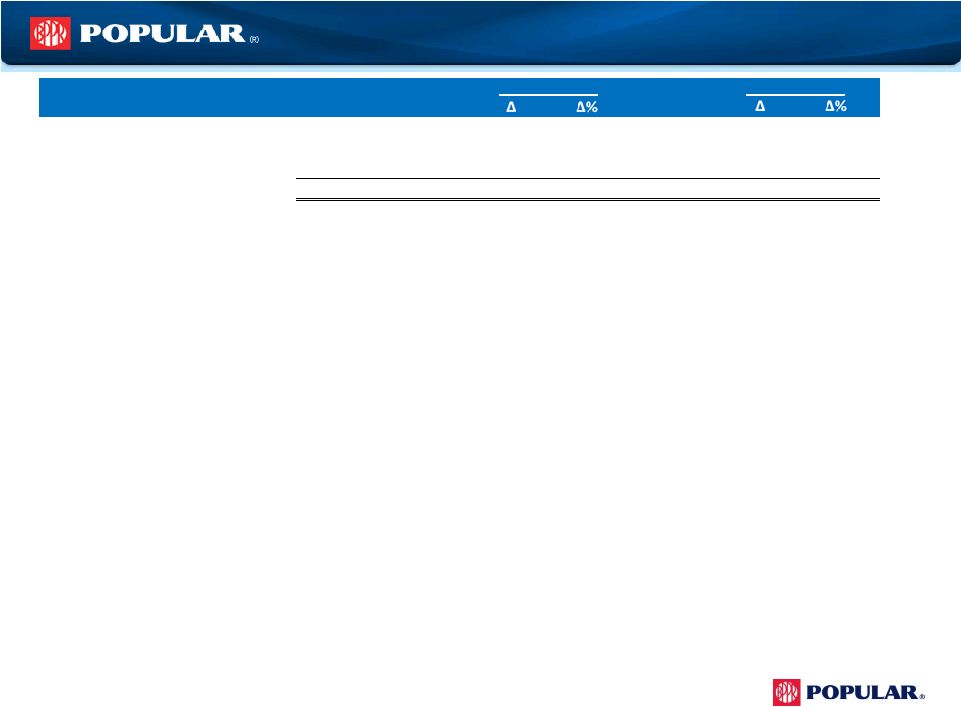
  $ in millions
(Unaudited) Q4 12
Q3 12
Variance
Q4 12
Q3 12
Variance
Net Interest Income
$309
$300
$9
$68
$70
($2)
Non Interest Income
90
114
(24)
15
11
4
Gross Revenues
399
414
(15)
83
81
2
Provision (non-covered)
78
69
9
8
14
(6)
Provision (covered WB)
(3)
23
(26)
-
-
-
Provision for loan losses
75
92
(17)
8
14
(6)
Expenses
240
232
8
57
57
0
Tax Expense
19
17
2
1
1
0
Net Income
$65
$73
($8)
$17
$9
$8
NPLs (HIP) ¹
$1,192
$1,284
($92)
$233
$266
($33)
NPLs (HIP + HFS) ¹
1,286
1,387
(101)
235
272
(37)
Loan loss reserve ¹
445
445
- 176
191
(15)
Assets
$27,600
$27,683
($83)
$8,652
$8,573
$79
Loans (HIP)
18,959
18,948
11
5,751
5,710
41
Loans (HIP + HFS)
19,309
19,277
32
5,755
5,718
37
Deposits
20,989
20,351
638
6,076
6,029
47
NIM
5.18%
5.11%
0.07%
3.51%
3.57%
-0.06%
PR
US
PR & US Business
15
1
Excludes covered loans |
 16
Consolidated Credit Summary (Excluding Covered Loans)
$ in millions
Q4 12
Q3 12
Q4 11
Loans Held in Portfolio (HIP)
$20,984
$20,754
$230
1.1%
$20,603
$381
1.9%
Performing HFS
258
228
30
13.2%
101
157
155.4%
NPL HFS
96
109
(13)
-11.6%
262
(166)
-63.3%
Total Non Covered Loans
21,338
21,091
$247
1.2%
20,966
$372
1.8%
Non-performing loans (NPLs)
$1,425
$1,551
($126)
-8.1%
$1,738
($314)
-18.0%
Commercial
$665
$772
($107)
-13.8%
$830
($165)
-19.9%
Construction
$43
$50
($7)
-13.3%
$96
($53)
-55.0%
Legacy
$41
$49
($8)
-16.9%
$76
($35)
-46.2%
Mortgage
$630
$632
($2)
-0.3%
$687
($56)
-8.2%
Consumer
$46
$48
($2)
-5.0%
$49
($4)
-7.5%
NPLs HIP to loans HIP
6.79%
7.47%
-0.7%
-9.1%
8.44%
-1.64%
-19.5%
Net charge-offs (NCOs)
$101
$96
$5
5.1%
$126
($25)
-20.0%
Commercial
$49
$47
$2
3.4%
$72
($23)
-32.1%
Construction
($2)
($1)
($1)
NM
$5
($7)
NM
Legacy
$3
$4
($1)
-15.8%
$6
($2)
-42.1%
Mortgage
$20
$16
$4
27.1%
$9
$12
NM
Consumer
$31
$30
$1
3.3%
$35
($4)
-11.4%
NCOs to average loans HIP
1.94%
1.87%
0.1%
3.7%
2.46%
-0.5%
-21.1%
Provision for loan losses (PLL)
$86
$84
$2
2.9%
$124
($38)
-30.6%
PLL to average loans HIP
1.66%
1.63%
0.0%
1.8%
2.42%
-0.8%
-31.4%
PLL to NCOs
0.86x
0.87x
-0.01x
-1.2%
0.98x
-0.12x
-12.6%
Allowance for loan losses (ALL)
$622
$636
($14)
-2.3%
$690
($68)
-9.9%
ALL to loans HIP
2.96%
3.07%
-0.1%
-3.6%
3.35%
-0.4%
-11.6%
ALL to NPLs HIP
43.62%
41.04%
2.6%
6.3%
39.73%
3.9%
9.8%
Q4 12 vs Q3 12
Q4 12 vs Q4 11 |
 Credit Ratings
Update •
Our senior unsecured ratings have been gradually improving since
2010:
Moody’s:
B1
Stable Outlook (Revised December 2012)
S&P:
B+
Stable Outlook (No Change)
Fitch:
BB-
Stable Outlook (Revised January 2013)
•
January 2013: Fitch raised to BB-
from B+; outlook revised to stable
•
December 2012: Moody’s downgraded BPOP by two notches to B1; stable outlook
assigned
•
April 2012: Moody’s placing most of the PR banks under review with the possibility
of
downgrades, due to the state of the Puerto Rico economy
•
January 2012: Fitch raised BPOPs outlook to positive
•
December 2011: S&P raised its ratings on BPPR to BB from BB-
and changed outlook to
stable given revised bank criteria to Regional banks
•
July 2011: S&P raised our senior unsecured rating by one notch to B+
•
As the P.R. economy stabilizes and our credit metrics improve, we should see upward
pressure on the ratings
17 |
 Financial
Results Financial Results
Fourth Quarter 2012
Fourth Quarter 2012 |