Attached files
| file | filename |
|---|---|
| 8-K - FORM 8-K - KEYCORP /NEW/ | d471601d8k.htm |
| EX-99.3 - EX-99.3 - KEYCORP /NEW/ | d471601dex993.htm |
| EX-99.1 - EX-99.1 - KEYCORP /NEW/ | d471601dex991.htm |
 KeyCorp
Fourth Quarter 2012 Earnings Review
January 24, 2013
Beth E. Mooney
Chairman and
Chief Executive Officer
Jeffrey B. Weeden
Chief Financial Officer
Exhibit 99.2 |
 2
FORWARD-LOOKING STATEMENTS AND ADDITIONAL
INFORMATION DISCLOSURE
This presentation contains and we may, from time to time, make forward-looking
statements within the meaning of the Private Securities Litigation Reform Act of
1995, including statements about Key’s financial condition, results of operations,
earnings outlook, asset quality trends, capital levels and profitability. Forward-
looking statements are not historical facts but instead represent only management’s
current expectations and forecasts regarding future events, many of which, by their
nature, are inherently uncertain and outside of Key’s control. Forward-looking statements usually can be identified by the use of words such as “goal,”
“objective,” “plan,” “expect,” “anticipate,”
“intend,” “project,” “believe,” “estimate” or other words of similar meaning.
Our forward-looking statements are subject to the following principal risks and
uncertainties: the economic recovery may face challenges causing its momentum to
falter or a further recession; the Dodd-Frank Wall Street Reform and Consumer Protection
Act and other reforms will subject us to a variety of new and more stringent legal
and regulatory requirements, including increased scrutiny from our regulators; changes in local, regional and international business, economic or
political conditions in the regions where we operate or have significant assets; changes in
trade, monetary and fiscal policies of various governmental bodies and central banks
could affect the economic environment in which we operate; our ability to effectively deal with an economic slowdown or other economic or market
difficulty; adverse changes in credit quality trends; our ability to determine accurate
values of certain assets and liabilities; adverse behaviors in foreign exchange
rates, securities, public debt, and capital markets, including changes in market liquidity
and volatility; our ability to anticipate interest rate changes correctly and
manage interest rate risk presented through unanticipated changes in our interest rate risk
position and/or short- and long-term interest rates; unanticipated changes
in our liquidity position, including but not limited to our ability to enter the financial
markets to manage and respond to any changes to our liquidity position; adequacy
of our risk management program; reduction of the credit ratings assigned to KeyCorp and
KeyBank; increased competitive pressure due to industry consolidation; unanticipated
adverse affects of acquisitions and dispositions of assets, business units or affiliates; and operational or risk management failures due to technological,
cybersecurity threats or other factors.
We provide greater detail regarding some of these factors in our 2011 Form 10-K,
including in Item 1A. Risk Factors and in Item 7. Management’s Discussion and
Analysis of Financial Condition and Results of Operation under the heading “Risk
Management,” as well as in our subsequent SEC filings, all of which are accessible
on our website at www.key.com/ir and on the SEC’s website at www.sec.gov.
Key does not undertake any obligation to update the forward-looking statements to
reflect the impact of circumstances or events that may arise after the date of the
forward-looking statements. Actual results or future events could differ, possibly
materially, from those anticipated in forward-looking statements, as well as from
historical performance.
This presentation also includes certain Non-GAAP financial measures related to
“tangible common equity, “Tier 1 common equity,” “pre-provision net revenue,” and
“cash efficiency ratio.” Management believes these ratios may assist
investors, analysts and regulators in analyzing Key’s financials. Although Key has procedures
in place to ensure that these measures are calculated using the appropriate GAAP or
regulatory components, they have limitations as analytical tools and should not be
considered in isolation, or as a substitute for analysis of results under GAAP. For more information on these calculations and to view the reconciliations to the
most comparable GAAP measures, please refer to the Appendix to this presentation or our most
recent earnings press release, which is accessible at
www.key.com/ir.
Web addresses referenced in this slide are inactive textual references only.
Information on these websites is not part of this document.
|
 3
Increased revenue 4% from 2011
Improved net interest margin, up 24 bps in 4Q12 compared to the prior year
Grew average C&I loans by 21% in 2012
Invested in growth opportunities: payments, healthcare and technology
Continued progress on efficiency initiatives; targeted savings of $150
million to $200 million by December 2013
Initiated next phase of branch positioning; 19 closures in 2012
Pursued opportunities to variablize cost base
Improve
Efficiency
Leveraged strong capital position for branch and credit card acquisitions
Repurchased $256 million in common shares
Increased quarterly dividend from $.03 to $.05 per common share
Positioned for Basel III
Optimize and
Grow
Revenue
2012 Investor Highlights
Execution of strategy and differentiated business model driving results
Effectively
Manage
Capital |
 2013
Focus Areas Execute Strategy with Distinctive Business Model
Maintain Moderate Risk Profile
Accelerate Revenue Growth with Opportunistic Investing
Leverage Strong Capital Position to Maximize Value
Align Cost Structure with Operating Environment
4 |
 5
Financial Review |
 6
Financial Summary –
Fourth Quarter 2012
Capital
(b)
Asset Quality
(a)
Financial
Performance
(a)
TE = Taxable equivalent, EOP = End of Period
(a)
From continuing operations
(b)
From consolidated operations
(c)
12-31-12 ratios are estimated
(d)
Non-GAAP measure: see Appendix for reconciliation
Income from continuing operations attributable to Key
$.21
$.23
$.21
common shareholders
Net interest margin (TE)
3.37%
3.23%
3.13%
Return on average total assets
.97
1.08
1.01
Tier 1 common equity
(c), (d)
11.2%
11.3%
11.3%
Tier 1 risk-based capital
(c)
11.9
12.1
13.0
Tangible common equity to tangible assets
(d)
10.2
10.4
9.9
Book value per common share
$10.78
$10.64
$10.09
Net loan charge-offs to average loans
.44%
.86%
.86%
NPLs to EOP portfolio loans
1.28
1.27
1.47
NPAs to EOP portfolio loans + OREO + Other NPAs
1.39
1.39
1.73
Allowance for loan losses to period-end loans
1.68
1.73
2.03
Allowance for loan losses to NPLs
131.8
136.0
138.1
4Q12
3Q12
4Q11
Metrics |
 $0
$10
$20
$30
$40
$50
$60
1Q11
2Q11
3Q11
4Q11
1Q12
2Q12
3Q12
4Q12
7
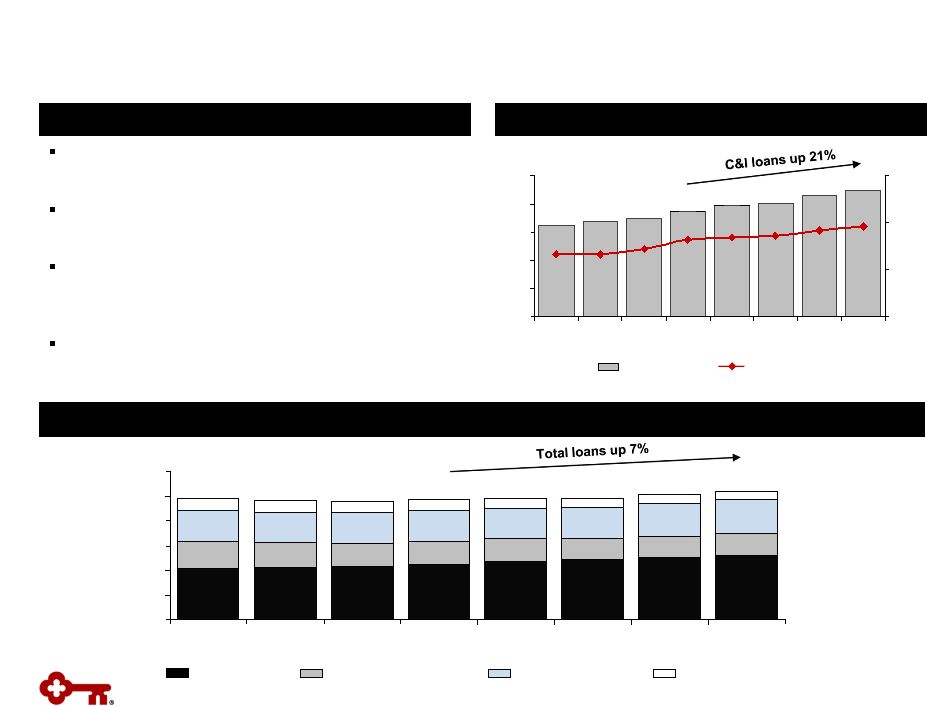
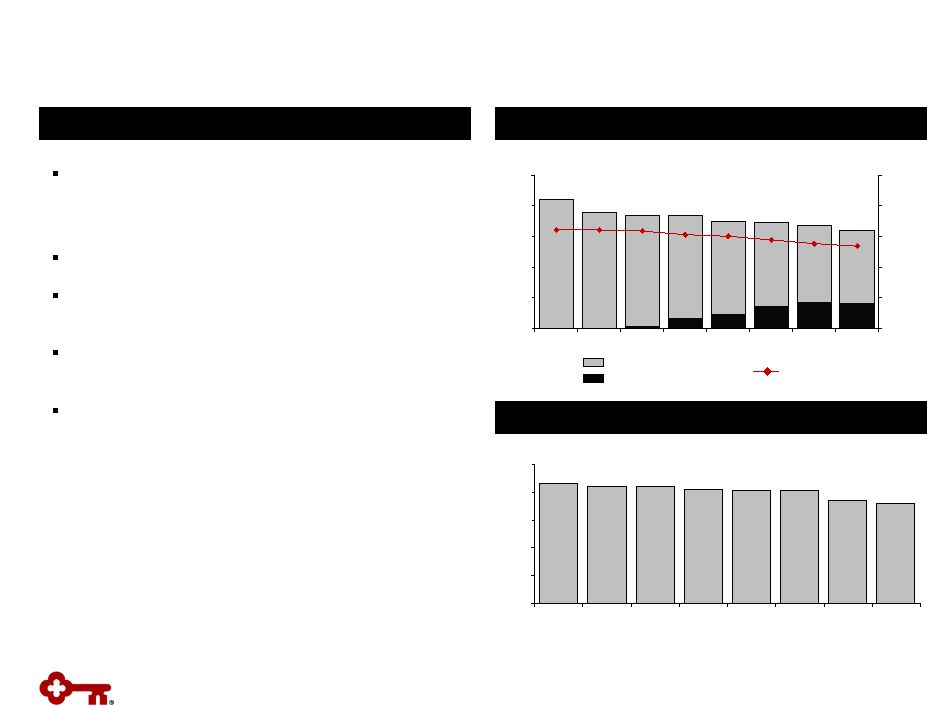
Average loan growth driven by C&I, while the exit
portfolio continues to run-off
Branch and credit card portfolio acquisitions
contributed $1 billion to 4Q12 average loans
Originated $10.2 billion in new or renewed
lending commitments during 4Q12 and $37.8
billion for 2012
C&I commitment utilization increased to 49.1%.
Loan Growth
$ in billions
Highlights
Average Commercial & Industrial Loans
C&I loans
Utilization rate
Average Loans
Exit Portfolios
Home Equity & Other
C&I & Leasing
Commercial Real Estate
$ in billions
$22.4
$16.3
$18.6
46.3%
43.2%
49.1%
$0
$5
$10
$15
$20
$25
1Q11
2Q11
3Q11
4Q11
1Q12
2Q12
3Q12
4Q12
30%
40%
50%
60%
$48.7
$49.3
$51.9 |
 8
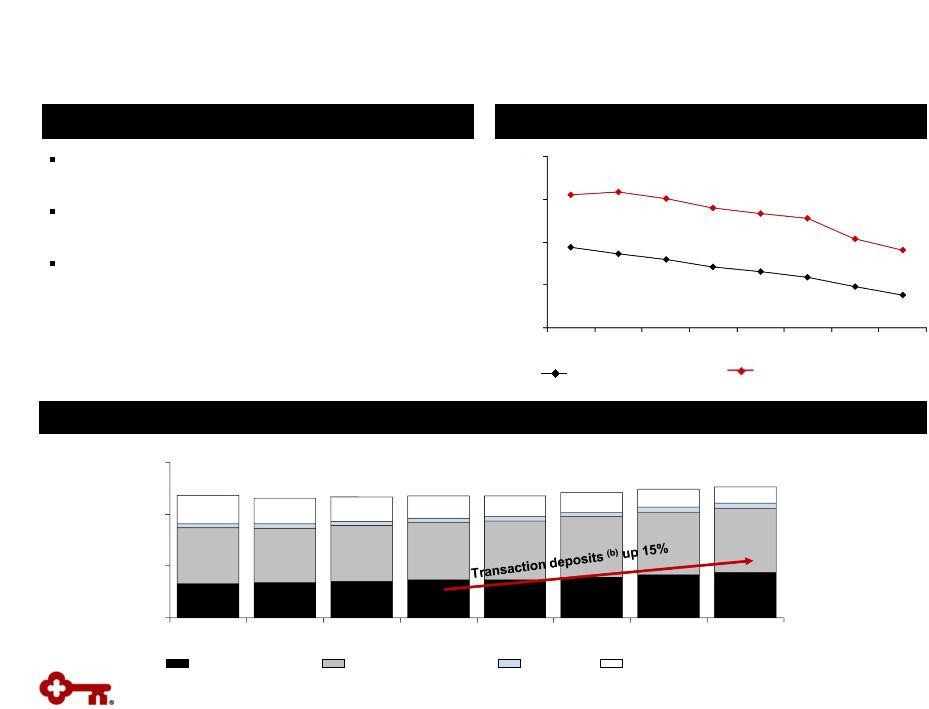
Improving Deposit Mix
Highlights
Funding Cost
Overall funding cost continues to improve, with
total deposit cost declining to 31 bps
Branch acquisition contributed $2 billion to 4Q12
average deposit balances
Total CD maturities and average cost
–
2013: $5.0 billion at 1.20%
–
2014: $1.6 billion at 2.63%
–
2015 & beyond: $.9 billion at 3.06%
Average
Deposits
(a)
$ in billions
(a)
Excludes deposits in foreign office
(b)
Transaction deposits include noninterest-bearing, NOW, and MMDA
Cost of total deposits
(a)
Interest-bearing liability cost
CDs and other time deposits
Savings
Noninterest-bearing
NOW and MMDA
1.24%
1.12%
.73%
.75%
.57%
.31%
1.60%
1.20%
.80%
.40%
.00%
1Q11
2Q11
3Q11
4Q11
1Q12
2Q12
3Q12
4Q12
$59.0
$58.9
$63.1
$75
$50
$25
$0
1Q11
2Q11
3Q11
4Q11
1Q12
2Q12
3Q12
4Q12 |
 9
Total Revenue
TE = Taxable equivalent
Continuing Operations
Net interest margin
Highlights
Net Interest Margin (TE) Trend
Net interest income increased
–
Net interest margin up 14 bps from 3Q12
and up 24 bps from 4Q11
–
Benefit from improved funding mix and
loan growth
Strong noninterest income
–
Up $52 million, 12.6%, from 4Q11
–
Down from prior quarter due to 3Q12 gains
–
Gains from loan sales reflect higher CRE
mortgage banking activity
Total Revenue Mix
Noninterest income
$ in millions
$604
$607
$457
$466
$563
$414
$0
$400
$800
$1,200
1Q11
2Q11
3Q11
4Q11
1Q12
2Q12
3Q12
4Q12
Impact of leveraged lease
early termination
Net interest income (TE)
$977
$1,073
$1,061
3.30%
3.13%
3.19%
3.50%
3.00%
2.50%
2.00%
1Q11
2Q11
3Q11
4Q11
1Q12
2Q12
3Q12
4Q12
3.25%
3.19%
3.09%
3.13%
3.16%
3.06%
3.23%
3.37% |
 10
$371
$330
$433
$387
$323
$330
$0
$300
$600
$900
1Q11
2Q11
3Q11
4Q11
1Q12
2Q12
3Q12
4Q12
Focused Expense Management
Noninterest Expense
Personnel expense
$ in millions
Highlights
Expenses elevated from prior year, driven by:
–
Acquisitions
–
Technology investments
–
Efficiency initiatives (Fit for Growth)
–
Employee benefits
Acquisition of branches and the credit card
portfolio contributed $30 million to 4Q12 expense
Fit for Growth initiatives contributed $16 million
to 4Q12 expense
Approximately $60 million in annualized expense
run rate savings realized in 2012
On target for $150 million to $200 million in
expense reductions by December 2013, with full-
year impact expected in 2014
Non-personnel expense
$701
$717
$756
$734
$11
$10
$8
$(11)
$4
$756
$600
$650
$700
$750
$800
Q-o-Q Change in Noninterest Expense
(a)
(a)
Includes ongoing, onetime and amortization expenses
$ in millions |
 11
$859
$1,089
$735
1.82%
1.47%
1.28%
$0
$400
$800
$1,200
1Q11
2Q11
3Q11
4Q11
1Q12
2Q12
3Q12
4Q12
0.00%
1.00%
2.00%
3.00%
$58
$193
$105
$57
$(22)
$(40)
1.59%
.86%
.44%
-$100
$0
$100
$200
$300
1Q11
2Q11
3Q11
4Q11
1Q12
2Q12
3Q12
4Q12
-1.00%
1.00%
3.00%
Nonperforming Assets
Net Charge-offs & Provision for Loan and Lease Losses
NPLs
NPLs to period-end loans
NCOs
Provision for loan and
lease losses
NCOs to average loans
$ in millions
$ in millions
NPLs held for sale,
OREO & other NPAs
Continued Improvement in Asset Quality
Highlights
Net loan charge-offs decreased $51 million from
elevated 3Q12
Net charge-offs to average loans of 44 bps,
within targeted range of 40 bps –
60 bps
Asset quality reaching normalized levels, with
net charge-offs expected to remain within
targeted range
* |
 12
Strong capital position supports growth
Disciplined capital management process
–
Repurchased $89 million in common
shares during 4Q12; $256 million YTD
–
Remaining repurchase authority of up to
$88 million
Estimated Basel III tier 1 common equity ratio of
10.2%
(a), (b)
Tier 1 Common Equity
(b), (c)
Tangible Common Equity to Tangible Assets
(b)
Strong Capital Ratios
Highlights
Book Value per Share
10.2%
9.2%
9.9%
0.0%
3.0%
6.0%
9.0%
12.0%
1Q11
2Q11
3Q11
4Q11
1Q12
2Q12
3Q12
4Q12
$10.78
$10.09
$9.58
$8.00
$9.00
$10.00
$11.00
1Q11
2Q11
3Q11
4Q11
1Q12
2Q12
3Q12
4Q12
11.2%
10.7%
11.3%
0.0%
3.0%
6.0%
9.0%
12.0%
1Q11
2Q11
3Q11
4Q11
1Q12
2Q12
3Q12
4Q12
(a)
Based upon December 31, 2012 pro forma analysis; see Appendix for further detail
(b)
Non-GAAP measure: see Appendix for reconciliations
(c)
12-31-12 ratio is estimated |
 Appendix
13 |
 14
(a)
Continuing operations, unless otherwise noted
(b)Represents period-end consolidated total loans and loans held for sale (excluding education
loans in the securitization trusts) divided by period-end consolidated total deposits
(excluding deposits in foreign office) (c)Excludes intangible asset amortization; Non-GAAP
measure: see slide 21 for reconciliation Progress on Targets for Success
KEY Business
Model
KEY Metrics
(a)
KEY
4Q12
KEY
3Q12
Targets
Action Plans
Core funded
Loan to deposit ratio
(b)
86%
86%
90-100%
Leverage integrated model to grow
relationships and loans
Improve deposit mix
Returning to a
moderate risk
profile
NCOs to average loans
.44%
.86%
40-60 bps
Focus on relationship clients
Exit noncore portfolios
Limit concentrations
Focus on risk-adjusted returns
Provision to average
loans
.44%
.86%
Growing high
quality, diverse
revenue streams
Net interest margin
3.37%
3.23%
>3.50%
Improve funding mix
Focus on risk-adjusted returns
Grow client relationships
Leverage Key’s total client solutions and
cross-selling capabilities
Noninterest income
to total revenue
43%
48%
>40%
Creating positive
operating
leverage
Cash
efficiency
ratio
(c)
69%
65%
60-65%
Improve efficiency and effectiveness
Leverage technology
Change cost base to more variable from
fixed
Executing our
strategies
Return on average
assets
.97%
1.08%
1.00-1.25%
Execute our client insight-driven
relationship model
Focus on operating leverage
Improved funding mix with lower cost core
deposits |
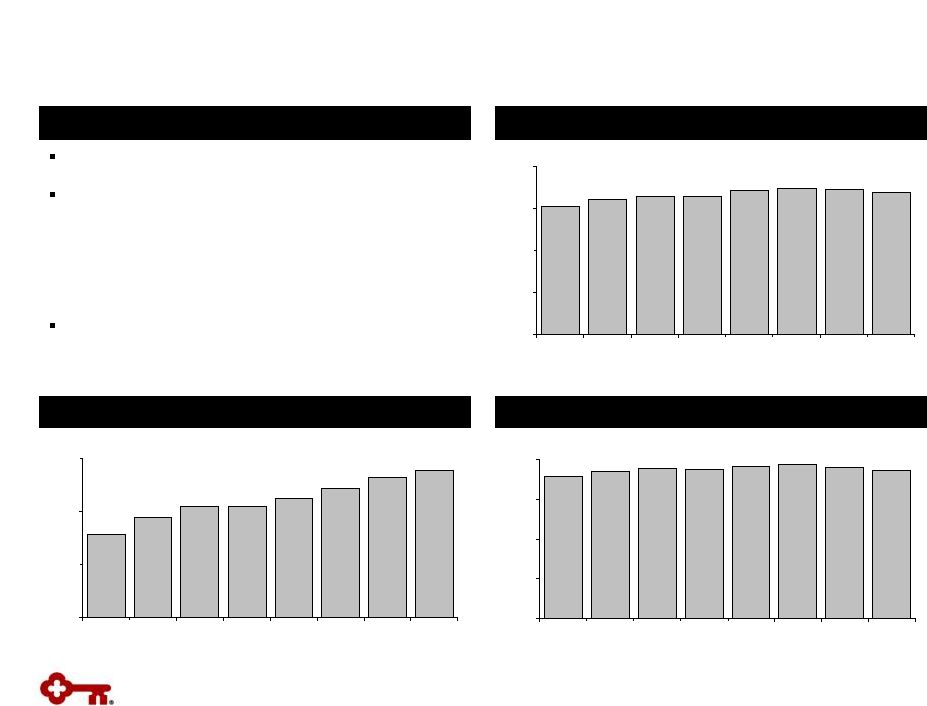
 15
$16.0
$18.4
$21.2
2.69%
3.07%
3.21%
$0
$5
$10
$15
$20
$25
1Q11
2Q11
3Q11
4Q11
1Q12
2Q12
3Q12
4Q12
0.00%
1.00%
2.00%
3.00%
4.00%
5.00%
Average Total Investment Securities
Highlights
Average AFS securities
$ in billions
High Quality Investment Portfolio
Portfolio composed of Agency or GSE backed:
GNMA, Fannie & Freddie
–
No private label MBS or financial paper
Average portfolio life at 12/31/12: 2.4 years
Unrealized net gain of $366 million on available-
for-sale securities portfolio at 12/31/12
Mortgage cash flows of $1.6 billion in 4Q12
and 3Q12
Investment securities declined as cash flows
funded loan growth and acquired assets
Securities to Total Assets
(b)
(a) Yield is calculated on the basis of amortized cost
(b) Includes end of period held-to-maturity and available-for-sale securities
18%
20%
22%
0%
5%
10%
15%
20%
25%
1Q11
2Q11
3Q11
4Q11
1Q12
2Q12
3Q12
4Q12
Average yield
(a)
Average HTM securities |
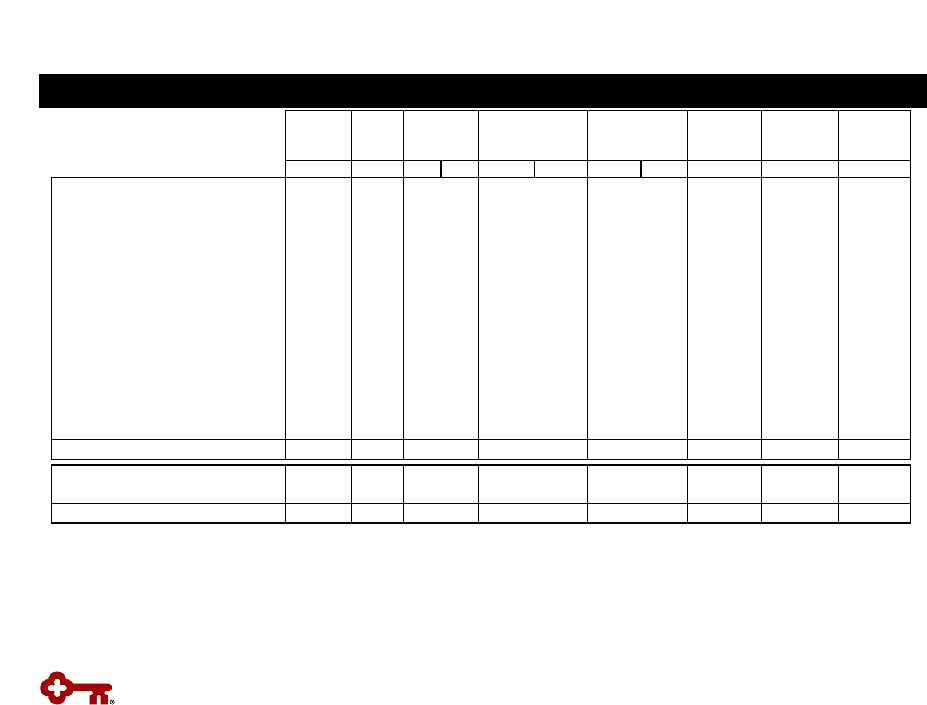 Credit Quality by Portfolio
16
Credit Quality
$ in millions
N/M = Not Meaningful
(a) Ending and average loans for fourth quarter 2012 include commercial credit card
balances of $90 million each
(b)
Net loan charge-off amounts are annualized in calculation. NCO ratios for
discontinued operations and consolidated Key exclude education loans in the securitization
trusts since valued at fair-market value
(c)
12-31-12 and 9-30-12 NPL amounts exclude $23 million and $25 million
respectively of purchased credit impaired loans acquired in July 2012.
(d)
12-31-12 allowance by portfolio is estimated. Allowance/period loans ratios for discontinued
operations and consolidated Key exclude education loans in the securitization trusts since
valued at fair-market value (e)
Further review of the loans subject to updated regulatory guidance in the third quarter
of 2012 was performed during the fourth quarter of 2012. This review resulted in a
partial home equity loan charge-off reversal and reallocation of the updated charge-off amounts to other consumer loan portfolios.
Home equity — Key Community Bank charge-offs were $18 million prior to adjustments made from
this review. Prior to reallocation, Real estate — residential mortgage, Home equity
— Other, Consumer other — Marine, and Consumer other — Other charge-offs were $3 million, $6 million, $11 million,
and $1 million, respectively
(f)
12-31-12 ending loans include purchased loans of $217 million of which $23
million were purchased credit impaired.
Period-end
loans
Average
loans
12/31/12
4Q12
4Q12
3Q12
4Q12
3Q12
12/31/12
9/30/12
12/31/12
12/31/12
12/31/12
Allowance /
period-end
loans
(d)
Allowance /
NPLs
Net loan
charge-offs
Net
loan
charge-offs
(b)
/
average loans
Nonperforming
loans
(c)
Ending
allowance
(d)
Commercial, financial and agricultural
(a)
$23,242
$22,436
$(8)
$7
(.14)
%
.13
%
$99
$132
$327
1.41
%
330.30
%
Commercial real estate:
Commercial mortgage
7,720
7,555
28
21
1.47
1.12
120
134
198
2.56
165.00
Construction
1,003
1,070
3
2
1.12
.71
56
53
41
4.09
73.21
Commercial lease financing
4,915
4,869
3
(8)
.25
(.63)
16
18
55
1.12
343.75
Real estate -
residential mortgage
(e)
2,174
2,164
7
6
1.29
1.14
103
83
29
1.33
28.16
Home equity:
Key Community Bank
(e)
9,816
9,807
(18)
62
(.73)
2.53
210
171
105
1.07
50.00
Other
(e)
423
411
11
5
10.65
4.25
21
18
25
5.91
119.05
1,349
1,339
8
7
2.38
2.15
2
3
38
2.82
N/M
Credit cards
729
714
9
2
5.01
1.84
11
8
27
3.70
245.45
Consumer other:
Marine
(e)
1,358
1,403
14
6
3.97
1.60
34
31
39
2.87
114.71
Other
(e)
93
91
1
(1)
4.37
(3.94)
2
2
4
4.30
200.00
Continuing total
(f)
$52,822
$51,859
$58
$109
.44
%
.86
%
$674
$653
$888
1.68
%
131.75
%
Discontinued
operations
-
education
lending business
5,201
5,263
15
12
2.12
1.67
20
22
55
1.06
275.00
Consolidated total
$58,023
$57,122
$73
$121
.53
%
.90
%
$694
$675
$943
1.63
%
135.88
%
Consumer other— Key Community Bank
|
 Vintage (% of Loans)
Loan Balances
Average Loan
Size ($)
Average
FICO
Average
LTV
% of Loans
LTV>90%
2011 and
later
2010
2009
2008
2007 and
prior
Home equity loans and lines
First lien
5,364
$
63,796
$
758
66
%
.6
%
33
%
5
%
6
%
9
%
47
%
Second lien
4,452
47,201
756
75
2.9
23
5
5
15
52
Total home equity loans and lines
9,816
$
55,022
$
757
70
1.8
28
5
6
12
49
Nonaccrual loans
First lien
105
$
60,837
$
713
73
%
1.0
%
3
%
4
%
5
%
4
%
84
%
Second lien
105
47,854
713
78
3.0
1
2
3
15
79
Total home equity nonaccrual loans
210
$
53,579
$
713
75
1.8
2
2
4
10
82
Community Bank - Home Equity
Fourth quarter net charge-offs
(18)
$
-
-
4
%
16
%
80
%
Net loan charge-offs to average loans
(.73)
%
Vintage (% of Loans)
Loan Balances
Average Loan
Size ($)
Average
FICO
Average
LTV
% of Loans
LTV>90%
2011 and
later
2010
2009
2008
2007 and
prior
Home equity loans and lines
First lien
19
$
22,803
$
745
34
%
.3
%
-
-
2
%
1
%
97
%
Second lien
404
23,817
730
82
32.2
-
-
-
2
98
Total home equity loans and lines
423
$
23,769
$
730
80
30.7
-
-
-
2
98
Nonaccrual loans
First lien
1
$
25,840
$
716
41
%
-
%
-
-
-
-
100
%
Second lien
20
25,676
707
83
35.1
-
-
-
2
%
98
Total home equity nonaccrual loans
21
$
25,684
$
707
81
33.5
-
-
-
2
98
Exit Portfolio - Home Equity
Fourth quarter net charge-offs
11
$
-
-
-
2
%
98
%
Net loan charge-offs to average loans
10.65
%
17
(a)
Average LTVs are at origination. Current average LTVs for Community Bank total
home equity loans and lines is approximately 77%, which compares to 79% at
the end of the third quarter 2012. Community Bank –
Home Equity
Exit Portfolio –
Home Equity
$ in millions, except average loan size
$ in millions, except average loan size
(a)
(a)
Home Equity Loans –
12/31/12 |
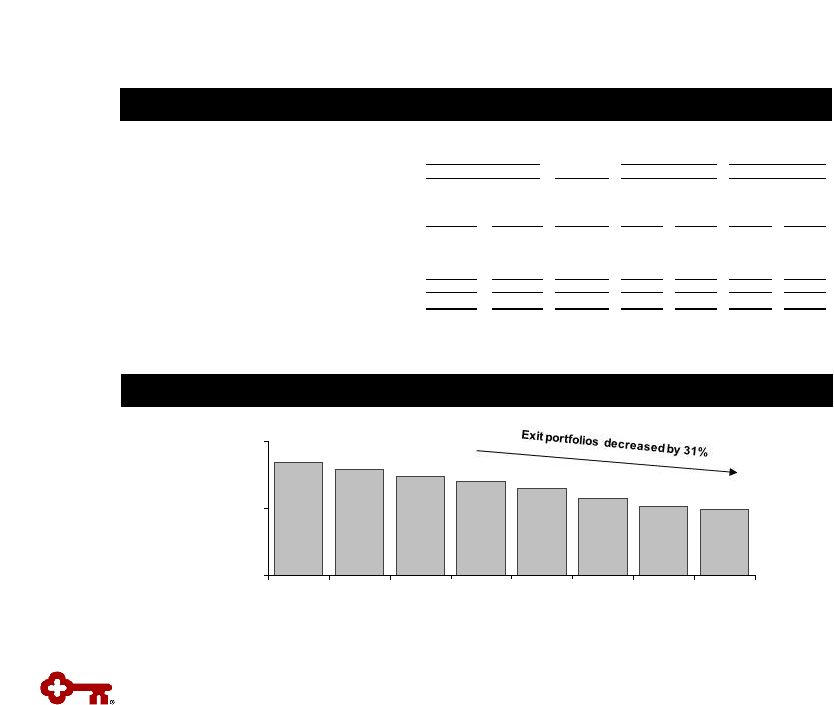 18
Exit Loan Portfolio Trend (Excluding Discontinued Operations)
Exit Loan Portfolio
$ in millions
(a)
Includes (1) the business aviation, commercial vehicle, office products,
construction and industrial leases; (2) Canadian lease financing portfolios;
and (3) all remaining balances related to lease in, lease out; sale in, lease out;
service contract leases; and qualified technological equipment leases (b)
Includes loans in Key’s consolidated education loan securitization
trusts (c)
Credit amounts indicate recoveries exceeded charge-offs
(d)
This loan category was impacted by the $45 million in net loan charge-offs
taken in the third quarter of 2012 related to the updated regulatory
guidance. During the fourth quarter of 2012, updated charge-off amounts
were reallocated to other loan categories. This amount would have been
$454 million exclusive of the above-referenced net loan charge-offs at
September 30, 2012 $ in millions
Exit Loan Portfolio
(d)
$2,928
$4,217
$5,048
$0
$3,000
$6,000
1Q11
2Q11
3Q11
4Q11
1Q12
2Q12
3Q12
4Q12
Change
12-31-12 vs.
12-31-12
9-30-12
9-30-12
4Q12
3Q12
(c)
12-31-12
9-30-12
Residential
properties
–
homebuilder
$24
$31
$(7)
$1
-
$10
$6
Marine and RV floor plan
33
35
(2)
-
$(1)
10
12
Commercial lease financing
(a)
997
1,035
(38)
-
(3)
6
8
Total commercial loans
1,054
1,101
(47)
1
(4)
26
26
Home
equity
–
Other
423
409
14
11
5
21
18
Marine
1,358
1,448
(90)
14
6
34
31
RV and other consumer
93
98
(5)
1
(1)
2
2
Total consumer loans
1,874
1,955
(81)
26
10
57
51
Total exit loans in loan portfolio
$2,928
$3,056
$(128)
$27
$6
$83
$77
Discontinued
operations
-
education
lending business (not included in exit loans above)
(b)
$5,201
$5,328
$(127)
$15
$12
$20
$22
Balance on
Nonperforming
Status
Balance
Outstanding
Charge-offs
Net Loan |
 19
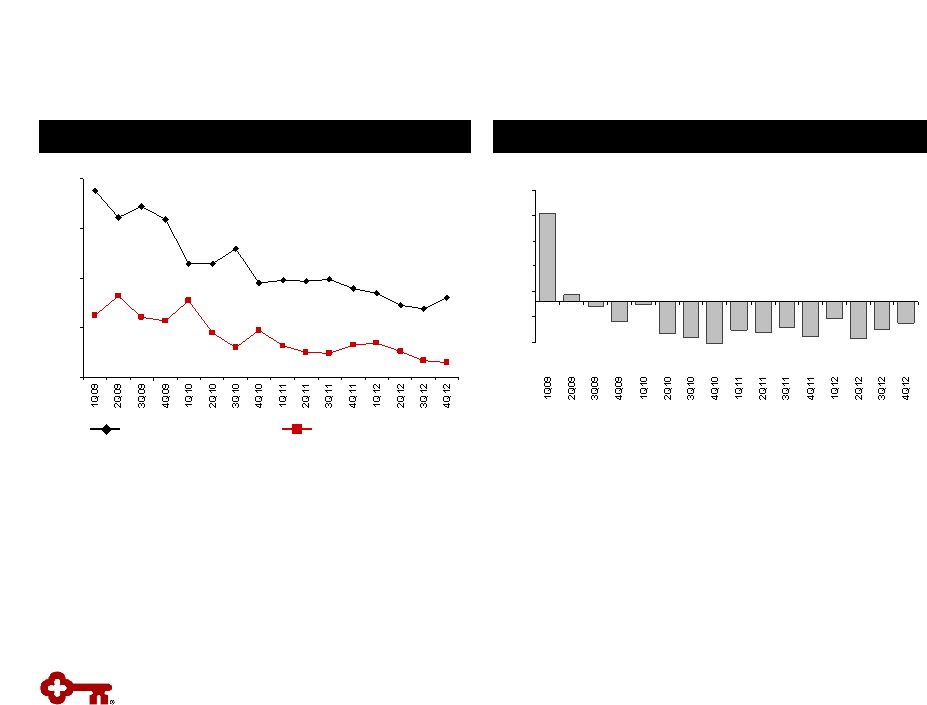
Credit Quality Trends
Quarterly Change in Criticized Outstandings
(a)
Delinquencies to Period-end Total Loans
(a)
Loan and Lease Outstandings
.80%
1.87%
.62%
.15%
.00%
.50%
1.00%
1.50%
2.00%
30 –
89 days delinquent
90+ days delinquent
(8)%
35%
(16)%
(6)%
4%
14%
24%
34%
44% |
 GAAP
to Non-GAAP Reconciliation $ in millions
20
(a)
Three months ended December 31, 2012 and September 30, 2012 exclude $123 million and $130 million,
respectively, of period end purchased credit card receivable intangible assets. Three
months ended December 31, 2012 and September 30, 2012 exclude $126 million and $86 million, respectively, of
average ending purchased credit card receivable intangible assets
(b)
Includes net unrealized gains or losses on securities available for sale (except for net unrealized
losses on marketable equity securities), net gains or losses on cash flow hedges, and amounts
resulting from the application of the applicable accounting guidance for defined benefit and other postretirement plans
(c)
Other assets deducted from Tier 1 capital and net risk-weighted assets consist of disallowed
intangible assets (excluding goodwill) and deductible portions of nonfinancial equity
investments. There were no disallowed deferred tax assets at December 31, 2012, September 30, 2012, and December 31, 2011
(d)
12-31-12 amount is estimated
Three months ended
12-31-12
9-30-12
12-31-11
Tangible common equity to tangible assets at period end
Key shareholders’
equity (GAAP)
$
10,271
$
10,251
$
9,905
Less:
Intangible assets
(a)
1,027
1,031
934
Preferred Stock, Series A
291
291
291
Tangible common equity (non-GAAP)
$
8,953
$
8,929
$
8,680
Total
assets
(GAAP)
$
89,236
$
86,950
$
88,785
Less:
Intangible
assets
(a)
1,027
1,031
934
Tangible assets (non-GAAP)
$
88,209
$
85,919
$
87,851
Tangible common equity to tangible assets ratio (non-GAAP)
10.15
%
10.39
%
9.88
%
Tier 1 common equity at period end
Key shareholders' equity (GAAP)
$
10,271
$
10,251
$
9,905
Qualifying capital securities
339
339
1,046
Less:
Goodwill
979
979
917
Accumulated
other
comprehensive
income
(loss)
(b)
(172)
(109)
(72)
Other assets
(c)
117
121
72
Total Tier 1 capital (regulatory)
9,686
9,599
10,034
Less:
Qualifying capital securities
339
339
1,046
Preferred Stock, Series A
291
291
291
Total Tier 1 common equity (non-GAAP)
$
9,056
$
8,969
$
8,697
Net risk-weighted
assets
(regulatory)
(c),
(d)
$
81,150
$
79,363
$
77,214
Tier 1 common equity ratio (non-GAAP)
(d)
11.16
%
11.30
%
11.26
%
Pre-provision net revenue
Net interest income (GAAP)
$
601
$
572
$
557
Plus:
Taxable-equivalent adjustment
6
6
6
Noninterest income
466
544
414
Less:
Noninterest expense
756
734
717
Pre-provision
net
revenue
from
continuing
operations
(non-GAAP)
$
317
$
388
$
260 |
 GAAP
to Non-GAAP Reconciliation (continued) $ in millions
21
(a)
Three months ended December 31, 2012 and September 30, 2012 exclude $123 million and $130 million,
respectively, of period end purchased credit card receivable intangible assets. Three
months ended December 31, 2012 and September 30, 2012 exclude $126 million and $86 million, respectively, of
average ending purchased credit card receivable intangible assets
Three months ended
12-31-12
9-30-12
12-31-11
Average tangible common equity
Average Key shareholders' equity (GAAP)
$
10,261
$
10,222
$
9,943
Less:
Intangible assets (average)
(a)
1,030
1,026
934
Preferred Stock, Series A (average)
291
291
291
Average
tangible
common
equity
(non-GAAP)
$
8,940
$
8,905
$
8,718
Return on average tangible common equity from continuing operations
Net
income
(loss)
from
continuing
operations
attributable
to
Key
common
shareholders
(GAAP)
$
193
$
214
$
201
Average
tangible
common
equity
(non-GAAP)
8,940
8,905
8,718
Return on average tangible common equity from continuing operations
(non-GAAP) 8.59
%
9.56
%
9.15
%
Return on average tangible common equity consolidated
Net income (loss) attributable to Key common shareholders (GAAP)
$
197
$
214
$
194
Average tangible common equity (non-GAAP)
8,940
8,905
8,718
Return on average tangible common equity consolidated (non-GAAP)
8.77
%
9.56
%
8.83
%
Cash efficiency ratio
Noninterest expense
(GAAP)
$
756
$
734
$
717
Less:
Intangible asset amortization on credit cards
8
6
—
Other intangible asset amortization
4
3
1
Adjusted noninterest expense (non
-GAAP)
$
744
$
725
$
716
Net inter
est income (GAAP)
$
601
$
572
$
557
Plus:
Taxable
-equivalent adjustment
6
6
6
Noninterest income
466
544
414
Total taxable-equivalent revenue (non
-GAAP)
$
1,073
$
1,122
$
977
Cash efficiency ratio (non-GAAP)
69.34
%
64.62
%
73.29
% |
 (a) Tier 1
common equity is a non-generally accepted accounting principle (GAAP) financial measure that is used by investors,
analysis and bank regulatory agencies to assess the capital position of financial services
companies. Management reviews Tier 1 common equity along with other measures of capital
as part of its financial analyses (b) Includes AFS mark-to-market, cash flow
hedges on items recognized at fair value on the balance sheet, and defined benefit pension
liability (c) Deferred tax asset subject to future taxable income for realization,
primarily tax credit carryforwards (d) The amount of regulatory capital and risk-weighted
assets estimated under Basel III (as fully phased-in on January 1, 2019) is based upon the
federal banking agencies' notices of proposed rulemaking, which implement Basel III and the Standardized
Approach
Tier 1 Common Equity under Basel III (estimated)
KeyCorp & Subsidiaries
22
TIER 1 COMMON EQUITY UNDER BASEL III (ESTIMATES)
Quarter ended
Dec 31,
$ in billions
2012
Tier 1 Common Equity under Basel I
$9.1
Adjustments from Basel I to Basel III:
(0.2)
(0.1)
$8.8
Total risk-weighted assets under Basel I
$81.1
Adjustments from Basel I to Basel III:
Market Risk Impact
1.2
Loan Commitments < 1 Year
1.0
Residential Mortgage Loans & Home Equity
1.9
Other
1.2
Total risk-weighted assets under Basel III
$86.4
Tier 1 common equity to total risk-weighted assets
anticipated under Basel III
10.17%
Cumulative Other Comprehensive Income
Tier 1 common equity anticipated under Basel III
Deferred Tax Assets
(a)
(b)
(d)
(c) |