Attached files
| file | filename |
|---|---|
| 8-K - FIRST MERCHANTS CORP - 4TH QTR 2012 EARNINGS SLIDES - FIRST MERCHANTS CORP | f8k4thqtr2012earningsslides.htm |

1
First Merchants Corporation
4th Quarter 2012
Earnings Call
4th Quarter 2012
Earnings Call
January 24, 2013

2
Michael C. Rechin
President
and Chief Executive Officer

3
The Corporation may make forward-looking statements about
its relative business outlook. These forward-looking statements
and all other statements made during this meeting that do not
concern historical facts are subject to risks and uncertainties
that may materially affect actual results.
Specific forward-looking statements include, but are not limited
Specific forward-looking statements include, but are not limited
to, any indications regarding the financial services industry, the
economy and future growth of the balance sheet or income
statement.
Please refer to our press releases, Form 10-Qs and 10-Ks
Please refer to our press releases, Form 10-Qs and 10-Ks
concerning factors that could cause actual results to differ
materially from any forward-looking statements.

4
EPS
§ 2012 Record Net Income of $40.6 Million
§ $1.41 Full-Year EPS
§ $0.32 4th Quarter EPS
Reported Total Revenue and Loan Growth
§ $189M Loan Growth,
7.0% Year-over-Year Increase
§ $158M Total Net-Interest Income-FTE,
6.0% Year-over-Year Increase
§ $64M Total Non-Interest Income,
31.0%Year-over-Year Increase
§ $222M Total Revenue,
12.2% Year-over-Year Increase

5
Mark K. Hardwick
Executive Vice President
and Chief Financial Officer
6
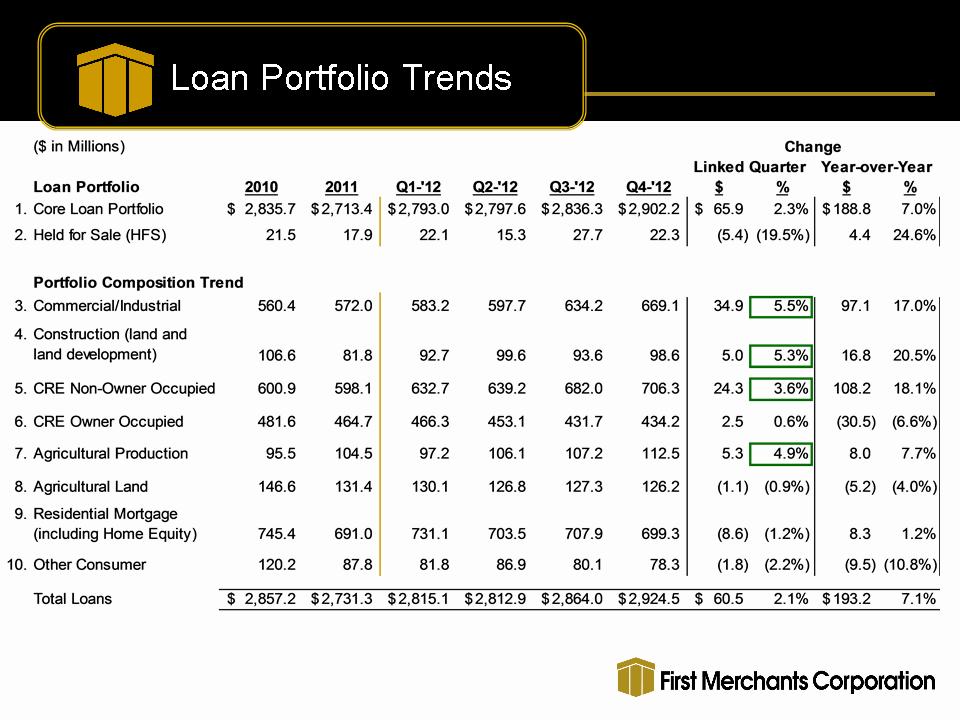
($ in Millions)
2010
2011 2012
1. Investments
$ 827 $ 946 $ 874
2. Loans Held for Sale 21 18 22
3. Loans 2,836 2,713 2,902
4. Allowance (83) (71) (69)
5. CD&I & Goodwill 154 150 150
6. BOLI 97 124 125
7. Other 319 293 301
8. Total Assets $4,171 $4,173 $4,305
7
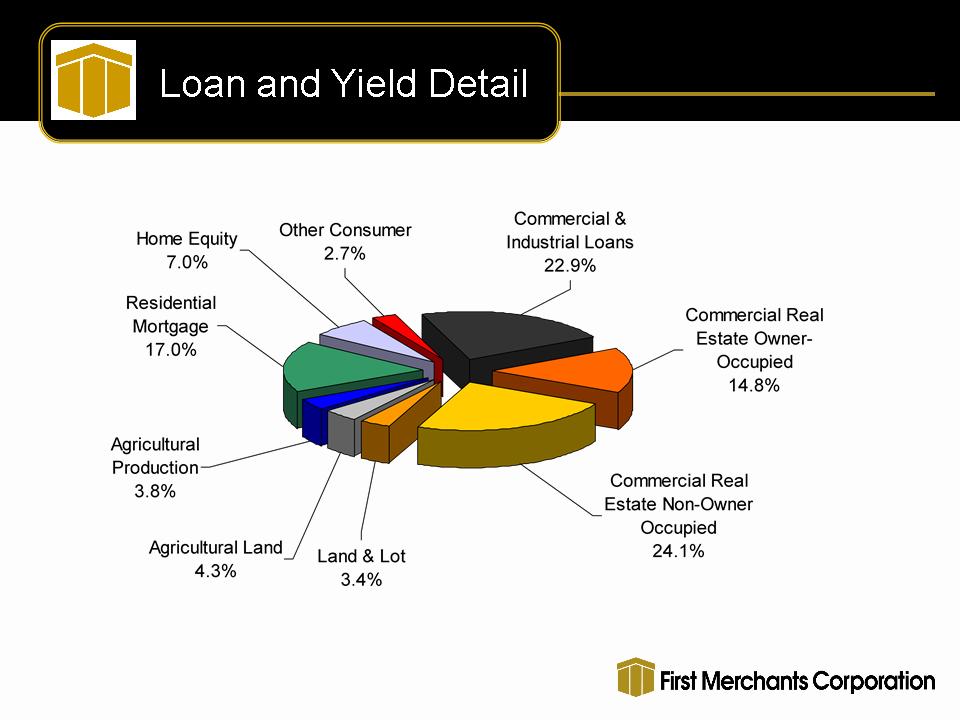
(as of 12/31/2012)
QTD Yield = 4.97%
YTD Yield = 5.16%
Total = $2.9B
8
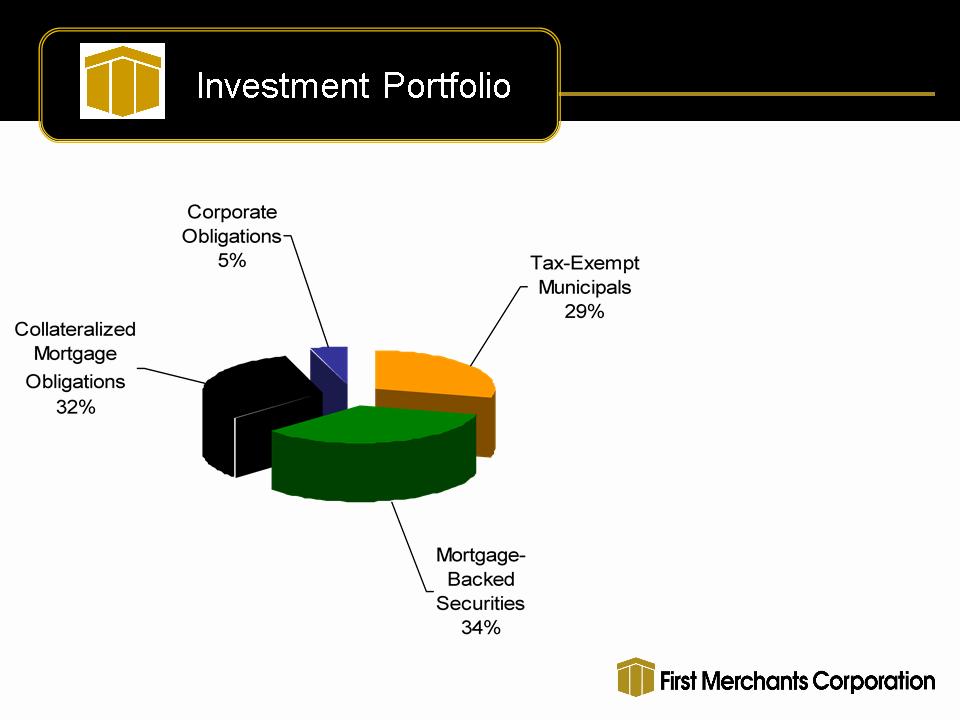
(as of 12/31/2012)
§ $874 Million Balance
§ Average duration - 3.7 years
§ Tax equivalent yield of 3.70%
§ Net unrealized gain of $39.6 million
9
2010
2011 2012
1. Customer Non-Maturity Deposits $2,127 $2,196 $2,479
2. Customer Time Deposits 996 816 739
3. Brokered Deposits 146 123 128
4. Borrowings 277 378 260
5. Other Liabilities 28 34 39
6. Hybrid Capital 142 111 107
7. Preferred Stock (CPP) 68 ― ―
8. Preferred Stock (SBLF) ― 91 91
9. Common Equity
387 424 462
10. Total Liabilities and Capital $4,171 $4,173 $4,305
($ in Millions)

10
(as of 12/31/2012)
11
2010
2011 2012
1. Total Risk-Based
Capital Ratio 15.74% 16.54% 16.34%
2. Tier 1 Risk-Based
Capital Ratio 12.82% 13.92% 14.15%
3. Leverage Ratio 9.50% 10.17% 11.03%
4. Tier 1 Common Risk-
Based Capital Ratio 7.64% 8.83% 9.62%
5. TCE/TCA 5.86% 6.84% 7.55%
12
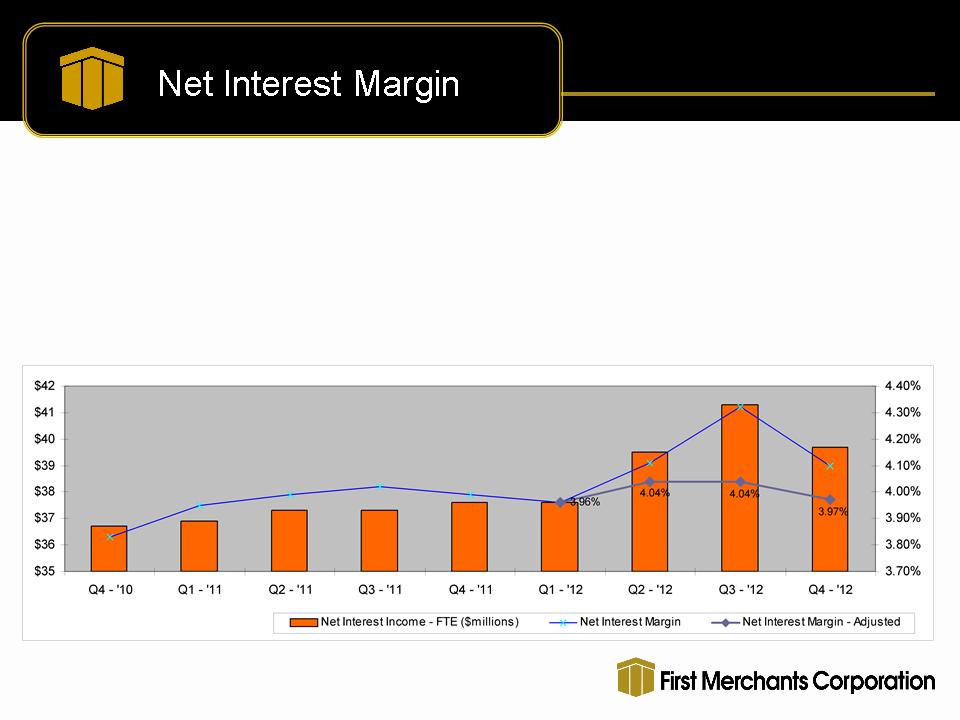
Q4-’10 Q1-’11 Q2-’11 Q3-’11 Q4-’11 Q1-’12 Q2-’12 Q3-’12 Q4-’12
Net Interest Income - FTE ($millions) $ 36.7
$ 36.9 $ 37.3 $ 37.3 $ 37.6 $ 37.6 $ 39.5 $ 41.3 $ 39.7
Tax Equivalent Yield on Earning Assets
5.13% 5.11% 5.04% 5.01% 4.83% 4.74% 4.75% 4.89% 4.58%
Cost of Supporting
Liabilities 1.30% 1.16% 1.05% 0.99% 0.84% 0.78% 0.64% 0.57% 0.48%
Net Interest Margin
3.83% 3.95% 3.99% 4.02% 3.99% 3.96% 4.11% 4.32% 4.10%
13
2010 2011 2012
1. Service Charges on Deposit Accounts $13.3 $12.0 $11.6
2. Trust Fees 7.7 7.7 7.9
3. Insurance Commission Income 6.2 5.7 6.2
4. Electronic Card Fees 6.1 6.5 7.3
5. Cash Surrender Value of Life Ins 2.1 2.6 3.4
6. Gains on Sales Mortgage Loans 6.8 7.4 10.6
7. Securities Gains/Losses 1.9 2.0 2.4
8. Gain on FDIC Acquisition ― ― 9.1
9. Other
4.4 5.2 5.8
10. Total $48.5 $49.1 $64.3
11. Adjusted Non-Interest Income1 $46.6 $47.1 $52.8
1Adjusted for Bond Gains & Losses and Gain on FDIC-Modified Whole-Bank Transaction
($ in Millions)

14
2010
2011 2012
1. Salary & Benefits $ 73.3 $ 74.7 $ 79.4
2. Premises & Equipment 17.2 16.9 17.4
3. Core Deposit Intangible 4.7 3.5 1.9
4. Professional Services 1.4 2.2 2.3
5. OREO/Credit-Related Expense 14.6 10.6 8.2
6. FDIC Expense 8.1 5.5 3.5
7. Outside Data Processing 5.1 5.7 5.7
8. Marketing 2.0 2.0 2.2
9. Other 15.9 14.8 16.5
10. Total $142.3 $135.9 $137.1
($ in Millions)
15
2010 2011 2012
1. Net Interest Income-FTE1 $149.4 $149.1 $153.5
2. Non Interest Income2 46.6 47.1 52.8
3. Non Interest Expense (142.3) (135.9) (137.1)
4. Pre-Tax Pre-Provision
Earnings $ 53.7 $ 60.3 $69.2
5. Provision ( 46.5) ( 22.6) ( 18.5)
6. Adjustments1,2
1.9 2.0 16.1
7. Taxes - FTE
( 2.3) ( 14.4) ( 21.7)
8. Gain /(Loss) on CPP/Trust Preferred 10.1 ( 12.3) ―
9. Preferred Stock Dividend ( 5.2)
( 4.0) ( 4.5)
10. Net Income Avail. for Distribution $ 11.7 $ 9.0 $40.6
11. EPS $ 0.48 $0.34 $1.41
1Adjusted for Fair Market Value Accretion
2Adjusted for Bond Gains & Losses and Gain on FDIC-Modified Whole-Bank Transaction
($ in Millions)
16
1
2
|
2010
|
Q1
|
Q2
|
Q3
|
Q4
|
Total
|
|
1. Reported
|
$ .01
|
$ .35
|
$ .02
|
$ .10
|
$ .48
|
|
2. Adjusted
|
$ .01
|
($ .05)
|
$ .02
|
$ .10
|
$ .08
|
|
2011
|
Q1
|
Q2
|
Q3
|
Q4
|
Total
|
|
3. Reported
|
$ .17
|
$ .18
|
($ .25)
|
$ .24
|
$ .34
|
|
4. Adjusted
|
$ .17
|
$ .18
|
$ .21
|
$ .24
|
$ .80
|
|
2012
|
Q1
|
Q2
|
Q3
|
Q4
|
Total
|
|
5. Reported
|
$ .46
|
$ .28
|
$ .35
|
$ .32
|
$1.41
|
|
6. Adjusted
|
$ .25
|
$ .26
|
$ .29
|
$ .29
|
$1.09
|
1Adjusted for gains and losses on CPP/Trust Preferred refinance and repayment net of taxes (Line 8 on slide 15)
2Adjusted for gain on FDIC-Modified Whole-Bank Transaction and Fair Market Value Accretion
1

17
John J. Martin
Senior Vice President
and Chief Credit Officer
18
18
19
19
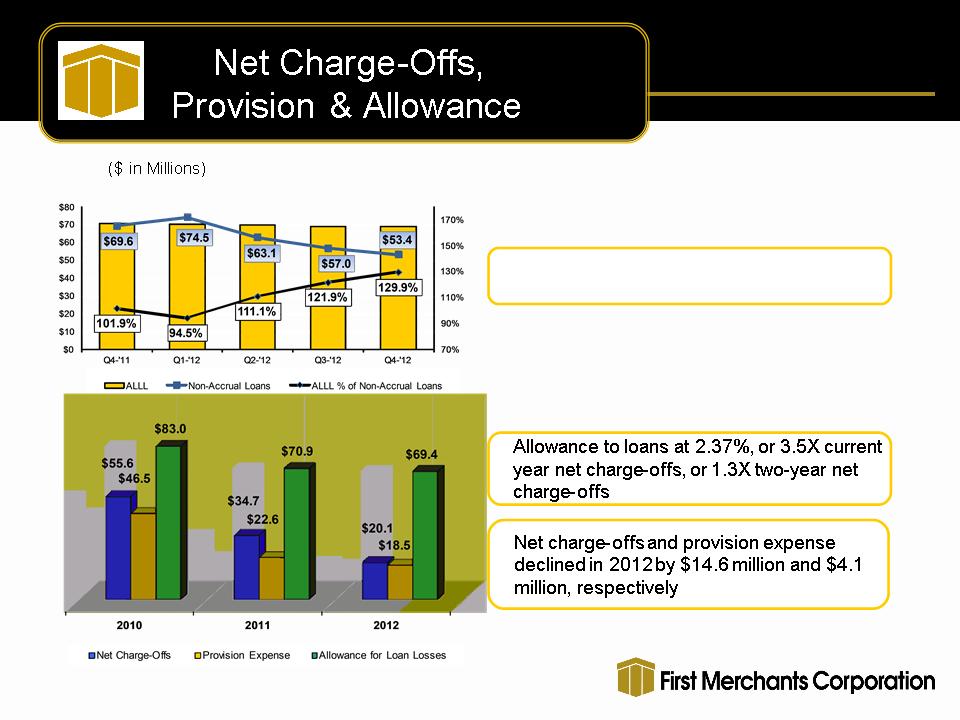
Allowance coverage of non-accrual loans
increased to 129.9%
increased to 129.9%
20
21
21
22
22
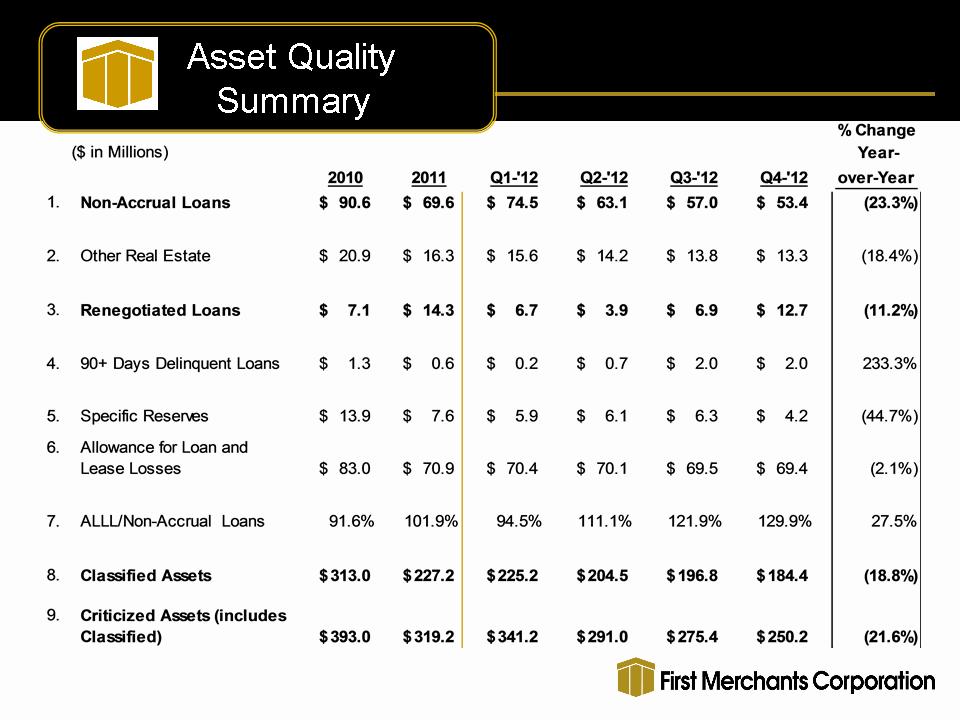
Classified Assets Reduced $42.8 Million, or 18.8%, and
Criticized Assets Reduced $69.0 Million, or 21.6% (YOY)
Renegotiated “A/B” Note Strategy Improving Asset Quality
Balanced Core Loan Portfolio Growth Led by C & I and CRE
OREO and Other Credit-Related Expenses Trending Lower in 2012

23
Michael C. Rechin
President
and Chief Executive Officer

24
Growth Company Performance Accomplishments
§ Commercial Pipelines Transitioned to the Balance Sheet
§ Non-Banking Lines-of-Business Showing Momentum
§ Integration Capabilities Affirmed and Retested
§ Earnings Drove Tangible Common Equity to 7.55%
§ Ample Reserve Level for Portfolio Risk
§ Developed a Growing and Strong Core Deposit Funding Base
§ Hired and Continued to Develop an Engaged, Energetic Workforce
Directed Towards Customers and Communities

25
Intensify Revenue-Generating Activity and Grow the Franchise
§ Add Market Coverage from Additional Business Banking Build-out
§ Evaluate Acquisition Opportunities and Execute on Those that Drive
Shareholder Value
Focus on Customer Experience and Improve Efficiency
§ Evaluate Commercial Lending Customer Experience, Making
Improvements while Improving Efficiency
§ Invest in Online/Mobile Banking Platforms that Enhance the Customer
Experience, Add Functionality and Achieve Greater Penetration
§ Make Necessary Investments in Cash Management Services that
Improve the Customer Experience and Achieve Greater Market
Acceptance
§ Simplify and Streamline Consumer Lending Processes to Achieve
Best-in-Class Community Banking
“Achieve Top-Tier
Performance”
Performance”
26
First Merchants Corporation common stock is traded
on the NASDAQ Global Select Market under the symbol FRME.
Additional information can be found at www.firstmerchants.com
Investor inquiries:
David L. Ortega, Investor Relations
Telephone: 765.378.8937
dortega@firstmerchants.com