Attached files
| file | filename |
|---|---|
| 8-K - FIRST HORIZON CORP | c72367_8k.htm |
| EX-99.2 - FIRST HORIZON CORP | c72367_ex99-2.htm |
| EX-99.3 - FIRST HORIZON CORP | c72367_ex99-3.htm |
Exhibit 99.1
EXCERPTS FROM EARNINGS MATERIALS FOR 8-K
The following information was made public by the Company in connection with its announcement on January 18, 2013 of earnings for the fourth quarter of 2012.
|
|
|
|
|
|
|
Earnings Release Highlights
The Company’s $250 million charge in second quarter 2012 to address the government sponsored entities mortgage repurchase issue led to a loss to common shareholders of $28 million for 2012 but resulted in no mortgage repurchase provision in both the third and fourth quarters of 2012.
The Company repurchased $131 million of common stock in 2012 compared to $44 million in 2011 under its previously-announced stock purchase program.
Income Statement Highlights – Quarterly/Unaudited
|
|
|
|
|
|
|
(Thousands) |
|
|
4Q12 |
|
|
Income Statement Highlights |
|
|
|
|
|
Net interest income |
|
$ |
170,598 |
|
|
Noninterest income |
|
|
151,143 |
|
|
Securities gains/(losses), net |
|
|
(4,700 |
) |
|
Total revenue |
|
|
317,041 |
|
|
Noninterest expense |
|
|
271,361 |
|
|
Provision for loan losses |
|
|
15,000 |
|
|
Income/(loss) before income taxes |
|
|
30,680 |
|
|
Provision/(benefit) for income taxes |
|
|
(12,914 |
) |
|
Income/(loss) from continuing operations |
|
|
43,594 |
|
|
Income/(loss) from discontinued operations, net of tax |
|
|
(12 |
) |
|
Net income/(loss) |
|
|
43,582 |
|
|
Net income attributable to noncontrolling interest |
|
|
2,901 |
|
|
Net income/(loss) available to common shareholders |
|
$ |
40,681 |
|
Balance Sheet Highlights – Quarterly/Unaudited
|
|
|
|
|
|
|
((Thousands) |
|
|
4Q12 |
|
|
Balance Sheet Highlights (Period-End) |
|
|
|
|
|
Total loans, net of unearned income (Restricted - $.1 billion) (a) |
|
$ |
16,708,582 |
|
|
Total deposits |
|
|
16,629,709 |
|
|
Total assets (Restricted - $.1 billion) (a) |
|
|
25,520,140 |
|
|
Total liabilities (Restricted - $.1 billion) (a) |
|
|
23,010,934 |
|
|
Total equity |
|
|
2,509,206 |
|
|
|
|
|
(a) |
Restricted balances parenthetically presented are as of December 31, 2012. |
Asset Quality Highlights – Quarterly Unaudited
|
|
|
|
|
|
|
(Dollars in thousands) |
|
4Q12 |
|
|
|
Asset Quality Highlights |
|
|
|
|
|
Allowance for loan losses (Restricted - $4.3 million) (a) |
|
$ |
276,963 |
|
|
Allowance / period-end loans |
|
|
1.66 |
% |
|
Net charge-offs |
|
$ |
19,781 |
|
|
Net charge-offs (annualized) / average loans |
|
|
0.48 |
% |
|
Non-performing assets (NPA) |
|
$ |
419,369 |
|
|
NPA% (b) |
|
|
1.84 |
% |
|
|
|
|
(a) |
Restricted balances parenthetically presented are as of December 31, 2012. |
|
(b) |
Non-performing assets related to the loan portfolio over period-end loans plus foreclosed real estate and other assets. |
1
Key Ratios and Other – Quarterly/Unaudited
|
|
|
|
|
|
|
|
|
4Q12 |
|
|
|
Key Ratios & Other |
|
|
|
|
|
Return on average assets (annualized) (a) |
|
|
0.69 |
% |
|
Return on average common equity (annualized) (b) |
|
|
7.20 |
% |
|
Net interest margin (c) (d) |
|
|
3.09 |
% |
|
Fee income to total revenue (e) |
|
|
46.98 |
% |
|
Efficiency ratio (f) |
|
|
84.34 |
% |
|
|
|
|
(a) |
Calculated using net income. |
|
(b) |
Calculated using net income available to common shareholders. |
|
(c) |
Net interest margin is computed using total net interest income adjusted for fully taxable equivalent (“FTE”). |
|
(d) |
Refer to the Non-GAAP to GAAP Reconciliation on page 9 of this Exhibit. |
|
(e) |
Ratio excludes securities gains/(losses). |
|
(f) |
Noninterest expense divided by total revenue excluding securities gains/(losses). |
FHN Performance Highlights – Consolidated Results for Fiscal Year 2012 vs. 2011
|
|
|
|
|
|
• |
Net loss available to common shareholders was $27.8 million, or $.11 loss per diluted share in 2012, compared to net income of $131.2 million, or $.50 per diluted share in 2011 |
||
|
|
|
||
|
|
• |
Net interest income (“NII”) decreased 2 percent in 2012 to $688.7 million from $700.8 million; net interest margin (“NIM”) decreased to 3.13 percent from 3.22 percent |
|
|
|
|
|
|
|
|
|
• |
The decrease in NII is primarily attributable to run-off of the non-strategic loan portfolio and a lower yielding securities portfolio, which more than outpaced loan growth within the bank and declining rates on interest bearing deposits |
|
|
|
|
|
|
|
|
• |
The decrease in NIM is driven by declining yields on the investment portfolio, lower yielding commercial and bank installment loans, and run-off of the non-strategic loan portfolio, partially offset by lower rates on interest bearing deposits and loan growth within the bank |
|
|
|
|
|
|
• |
Noninterest income (including securities gains) was $671.3 million in 2012 compared to $786.0 million in 2011 primarily due to a decline in mortgage banking income, a decline in net securities gains, and lower fixed income sales revenue within capital markets |
||
|
|
|
||
|
• |
Provision expense was $78.0 million in 2012 compared to $44.0 million in the prior year; 2012 included approximately $30 million of provision associated with the implementation of regulatory guidance related to discharged bankruptcies |
||
|
|
|
|
|
|
|
• |
Overall improvement of the loan portfolio continued into 2012, but at a slower pace than 2011 |
|
|
|
|
|
|
|
• |
Noninterest expense was $1.4 billion in 2012 compared to $1.3 billion in 2011 |
||
|
|
|
|
|
|
|
• |
Increase primarily driven by an increase to the repurchase and foreclosure provision, higher pension-related cost, and higher severance costs related to restructuring, repositioning, and efficiency initiatives in 2012 relative to 2011 |
|
|
|
|
|
|
|
|
• |
These increases were partially offset by a decline in legal and professional fees and litigation and regulatory matters largely driven by litigation matters in the prior year |
|
|
|
|
|
|
|
|
• |
Substantially all other categories had lower expenses in 2012 compared to the prior year due to FHN’s continued focus on cost reduction throughout the organization |
|
|
|
|
|
|
|
• |
Period-end loans were $16.7 billion in 2012 compared to $16.4 billion in 2011 |
||
|
|
|
||
|
• |
Average core deposits increased 4 percent to $15.6 billion in 2012 from $15.0 billion in 2011, period-end increased 3 percent to $16.1 billion |
||
2
FHN Performance Highlights – Consolidated Results Fourth Quarter 2012 vs. Third Quarter 2012
|
|
|
|
|
• |
Net income available to common shareholders was $40.7 million, or $.17 per diluted share, compared to $25.8 million, or $.10 per diluted share in prior quarter |
|
|
|
|
|
|
• |
NII decreased in fourth quarter to $170.6 million; NIM decreased to 3.09 percent from 3.15 percent |
|
|
|
|
|
|
|
• |
The decrease in NII is primarily attributable to a lower yielding securities portfolio, run-off of the non-strategic loan portfolio and declining yields on non-strategic mortgage and commercial fixed and floating loans, which more than outpaced loan growth within the bank, declining rates on interest bearing deposits, and an increase in loan fees relative to the prior quarter |
|
|
|
|
|
|
• |
The decrease in NIM is driven by declining yields on the investment portfolio, lower yielding commercial and mortgage loans, and an increase in average excess cash held at the Federal Reserve Bank, partially offset by an increase in loan fees |
|
|
|
|
|
• |
Noninterest income (including securities gains) was $146.4 million in fourth quarter, down from $163.5 million in third quarter |
|
|
|
|
|
|
|
• |
Decrease primarily driven by lower fixed income sales revenue within capital markets in fourth quarter and a $4.7 million negative valuation adjustment on an equity investment |
|
|
|
|
|
• |
Provision expense was $15.0 million in fourth quarter compared to $40.0 million in third quarter |
|
|
|
|
|
|
|
• |
Third quarter included approximately $30 million of incremental loan loss provisioning associated with implementation of regulatory guidance related to discharged bankruptcies |
|
|
|
|
|
• |
Noninterest expense was $271.4 million in fourth quarter compared to $263.2 million in third quarter |
|
|
|
|
|
|
|
• |
Increase primarily driven by severance costs associated with a voluntary separation program launched in October |
|
|
|
|
|
• |
Period-end loans were $16.7 billion for the fourth quarter compared to $16.5 billion in third quarter |
|
|
|
|
|
|
|
• |
Increase in the loan portfolio is primarily driven by an increase in loans to mortgage companies and consumer real estate installment loans within the bank, partially offset by continued run-off within the non-strategic portfolios |
|
|
|
|
|
• |
Average core deposits increased 3 percent to $15.8 billion in fourth quarter from $15.3 billion in third quarter, period-end increased 3 percent to $16.1 billion |
|
Fourth Quarter 2012 Significant Items
|
|
|
|
|
• |
$(18.7) million of restructuring, repositioning and efficiency charges primarily related to severance costs associated with the voluntary separation program launched in October 2012 |
|
|
|
|
|
|
• |
$(4.7) million pre-tax negative valuation adjustment related to an equity investment |
|
|
|
|
|
|
• |
$(4.3) million pre-tax loss accrual related to pending legal matters |
|
|
|
|
|
|
• |
$17.0 million tax benefits related to discrete period tax items |
|
3
FHN Average Balance Sheet – Quarterly and Annually/Unaudited
|
|
|
|
|
|
|
|
|
|
(Thousands) |
|
4Q12 |
|
2012 |
|
||
|
Assets: |
|
|
|
|
|
|
|
|
Earning assets: |
|
|
|
|
|
|
|
|
Loans, net of unearned income: |
|
|
|
|
|
|
|
|
Commercial, financial, and industrial (C&I) |
|
$ |
8,330,961 |
|
$ |
7,994,102 |
|
|
Income CRE |
|
|
1,174,127 |
|
|
1,217,392 |
|
|
Residential CRE |
|
|
63,647 |
|
|
89,609 |
|
|
Consumer real estate |
|
|
5,342,239 |
|
|
5,355,540 |
|
|
Permanent mortgage |
|
|
774,465 |
|
|
772,439 |
|
|
Credit card and other |
|
|
288,412 |
|
|
280,197 |
|
|
Restricted and secured real estate loans |
|
|
429,448 |
|
|
496,124 |
|
|
Total loans, net of unearned income (Restricted - $.1 billion) (a) (b) |
|
|
16,403,299 |
|
|
16,205,403 |
|
|
Loans held-for-sale |
|
|
403,750 |
|
|
416,616 |
|
|
Investment securities: |
|
|
|
|
|
|
|
|
U.S. treasuries |
|
|
43,909 |
|
|
42,248 |
|
|
U.S. government agencies |
|
|
2,774,175 |
|
|
2,862,848 |
|
|
States and municipalities |
|
|
17,169 |
|
|
17,802 |
|
|
Other |
|
|
222,058 |
|
|
222,569 |
|
|
Total investment securities |
|
|
3,057,311 |
|
|
3,145,467 |
|
|
Capital markets securities inventory |
|
|
1,250,423 |
|
|
1,261,086 |
|
|
Mortgage banking trading securities |
|
|
18,844 |
|
|
21,885 |
|
|
Other earning assets: |
|
|
|
|
|
|
|
|
Federal funds sold and securities purchased under agreements to resell |
|
|
610,959 |
|
|
608,895 |
|
|
Interest-bearing cash (c) |
|
|
522,529 |
|
|
565,470 |
|
|
Total other earning assets |
|
|
1,133,488 |
|
|
1,174,365 |
|
|
Total earning assets (Restricted - $.1 billion) (a) |
|
|
22,267,115 |
|
|
22,224,822 |
|
|
Allowance for loan losses (Restricted - $4.3 million) (a) |
|
|
(306,583 |
) |
|
(331,198 |
) |
|
Cash and due from banks (Restricted - $.5 million) (a) |
|
|
349,002 |
|
|
344,305 |
|
|
Capital markets receivables |
|
|
114,771 |
|
|
118,979 |
|
|
Premises and equipment, net |
|
|
303,921 |
|
|
310,115 |
|
|
Other assets (Restricted - $1.9 million) (a) |
|
|
2,242,740 |
|
|
2,401,698 |
|
|
Total assets (Restricted - $.1 billion) (a) |
|
$ |
24,970,966 |
|
$ |
25,068,721 |
|
|
|
|
|
|
|
|
|
|
|
Liabilities and equity: |
|
|
|
|
|
|
|
|
Interest-bearing liabilities: |
|
|
|
|
|
|
|
|
Interest-bearing deposits: |
|
|
|
|
|
|
|
|
Savings |
|
$ |
6,529,453 |
|
$ |
6,403,738 |
|
|
Other interest-bearing deposits |
|
|
3,469,711 |
|
|
3,414,094 |
|
|
Time deposits |
|
|
1,038,672 |
|
|
1,101,158 |
|
|
Total interest-bearing core deposits |
|
|
11,037,836 |
|
|
10,918,990 |
|
|
Certificates of deposit $100,000 and more |
|
|
514,543 |
|
|
604,883 |
|
|
Federal funds purchased and securities sold under agreements to repurchase |
|
|
1,996,463 |
|
|
1,928,891 |
|
|
Capital markets trading liabilities |
|
|
597,402 |
|
|
589,461 |
|
|
Other short-term borrowings |
|
|
272,578 |
|
|
450,690 |
|
|
Term borrowings (Restricted - $.1 billion) (a) |
|
|
2,254,445 |
|
|
2,326,753 |
|
|
Total interest-bearing liabilities |
|
|
16,673,267 |
|
|
16,819,668 |
|
|
Noninterest-bearing deposits |
|
|
4,770,935 |
|
|
4,688,093 |
|
|
Capital markets payables |
|
|
81,941 |
|
|
85,852 |
|
|
Other liabilities |
|
|
901,380 |
|
|
867,327 |
|
|
Equity |
|
|
2,543,443 |
|
|
2,607,781 |
|
|
Total liabilities and equity (Restricted - $.1 billion) (a) |
|
$ |
24,970,966 |
|
$ |
25,068,721 |
|
|
|
|
|
(a) |
Restricted balances parenthetically presented are quarterly averages as of December 31, 2012. |
|
(b) |
Includes loans on nonaccrual status. |
|
(c) |
Includes excess balances held at the Federal Reserve Bank. |
4
FHN Net Interest Income – Quarterly/Unaudited
|
|
|
|
|
|
|
(Thousands) |
|
4Q12 |
|
|
|
|
|
|
|
|
|
Interest Income: |
|
|
|
|
|
Loans, net of unearned income (a) |
|
$ |
163,693 |
|
|
Loans held-for-sale |
|
|
3,732 |
|
|
Investment securities: |
|
|
|
|
|
U.S. treasuries |
|
|
11 |
|
|
U.S. government agencies |
|
|
19,536 |
|
|
States and municipalities |
|
|
6 |
|
|
Other |
|
|
2,495 |
|
|
Total investment securities |
|
|
22,048 |
|
|
Capital markets securities inventory |
|
|
7,565 |
|
|
Mortgage banking trading securities |
|
|
534 |
|
|
Other earning assets: |
|
|
|
|
|
Federal funds sold and securities purchased under agreements to resell |
|
|
182 |
|
|
Interest-bearing cash |
|
|
287 |
|
|
Total other earning assets |
|
|
469 |
|
|
Interest income |
|
$ |
198,041 |
|
|
|
|
|
|
|
|
Interest Expense: |
|
|
|
|
|
Interest-bearing deposits: |
|
|
|
|
|
Savings |
|
$ |
4,617 |
|
|
Other interest-bearing deposits |
|
|
1,268 |
|
|
Time deposits |
|
|
4,639 |
|
|
Total interest-bearing core deposits |
|
|
10,524 |
|
|
Certificates of deposit $100,000 and more |
|
|
1,725 |
|
|
Federal funds purchased and securities sold under agreements to repurchase |
|
|
1,196 |
|
|
Capital markets trading liabilities |
|
|
2,536 |
|
|
Other short-term borrowings |
|
|
132 |
|
|
Term borrowings |
|
|
9,488 |
|
|
Interest expense |
|
|
25,601 |
|
|
Net interest income - tax equivalent basis |
|
|
172,440 |
|
|
Fully taxable equivalent adjustment |
|
|
(1,842 |
) |
|
Net interest income |
|
$ |
170,598 |
|
|
|
|
|
Net interest income adjusted to FTE basis. |
|
|
(a) |
Includes loans on nonaccrual status. |
5
FHN Average Balance Sheet Yields and Rates – Quarterly/Unaudited
|
|
|
|
|
|
|
(Thousands) |
|
4Q12 |
|
|
|
|
|
|
|
|
|
Assets: |
|
|
|
|
|
Earning assets (a): |
|
|
|
|
|
Loans, net of unearned income: |
|
|
|
|
|
Commercial loans |
|
|
3.83 |
% |
|
Retail loans |
|
|
4.18 |
|
|
Total loans, net of unearned income (b) |
|
|
3.98 |
|
|
Loans held-for-sale |
|
|
3.70 |
|
|
Investment securities: |
|
|
|
|
|
U.S. treasuries |
|
|
0.10 |
|
|
U.S. government agencies |
|
|
2.82 |
|
|
States and municipalities |
|
|
0.13 |
|
|
Other |
|
|
4.49 |
|
|
Total investment securities |
|
|
2.88 |
|
|
Capital markets securities inventory |
|
|
2.42 |
|
|
Mortgage banking trading securities |
|
|
11.34 |
|
|
Other earning assets: |
|
|
|
|
|
Federal funds sold and securities purchased under agreements to resell |
|
|
0.12 |
|
|
Interest-bearing cash |
|
|
0.22 |
|
|
Total other earning assets |
|
|
0.16 |
|
|
Interest income/total earning assets |
|
|
3.55 |
% |
|
|
|
|
|
|
|
Liabilities: |
|
|
|
|
|
Interest-bearing liabilities: |
|
|
|
|
|
Interest-bearing deposits: |
|
|
|
|
|
Savings |
|
|
0.28 |
% |
|
Other interest-bearing deposits |
|
|
0.15 |
|
|
Time deposits |
|
|
1.78 |
|
|
Total interest-bearing core deposits |
|
|
0.38 |
|
|
Certificates of deposit $100,000 and more |
|
|
1.33 |
|
|
Federal funds purchased and securities sold under agreements to repurchase |
|
|
0.24 |
|
|
Capital markets trading liabilities |
|
|
1.69 |
|
|
Other short-term borrowings |
|
|
0.19 |
|
|
Term borrowings (c) |
|
|
1.69 |
|
|
Interest expense/total interest-bearing liabilities |
|
|
0.61 |
|
|
Net interest spread |
|
|
2.94 |
% |
|
Effect of interest-free sources used to fund earning assets |
|
|
0.15 |
|
|
Net interest margin |
|
|
3.09 |
% |
|
|
|
|
Yields are adjusted to FTE basis. Refer to the Non-GAAP to GAAP Reconciliation on page 9 for reconciliation of net interest income (GAAP) to net interest income adjusted for impact of FTE (non-GAAP). |
|
|
(a) |
Earning assets yields are expressed net of unearned income. |
|
(b) |
Includes loans on nonaccrual status. |
|
(c) |
Rates are expressed net of unamortized debenture cost for term borrowings. |
6
FHN Business Segment Highlights – Quarterly/Unaudited
|
|
|
|
|
|
|
(Thousands) |
|
4Q12 |
|
|
|
|
|
|
|
|
|
Regional Banking |
|
|
|
|
|
Net interest income |
|
$ |
153,133 |
|
|
Noninterest income |
|
|
63,998 |
|
|
Total revenues |
|
|
217,131 |
|
|
Provision/(provision credit) for loan losses |
|
|
(1,227 |
) |
|
Noninterest expense |
|
|
143,534 |
|
|
Income before income taxes |
|
|
74,824 |
|
|
Provision for income taxes |
|
|
27,161 |
|
|
Net income |
|
$ |
47,663 |
|
|
|
|
|
|
|
|
Capital Markets |
|
|
|
|
|
Net interest income |
|
$ |
4,252 |
|
|
Noninterest income |
|
|
72,432 |
|
|
Total revenues |
|
|
76,684 |
|
|
Noninterest expense |
|
|
57,536 |
|
|
Income before income taxes |
|
|
19,148 |
|
|
Provision for income taxes |
|
|
7,186 |
|
|
Net income |
|
$ |
11,962 |
|
|
|
|
|
|
|
|
Corporate |
|
|
|
|
|
Net interest income/(expense) |
|
$ |
(8,204 |
) |
|
Noninterest income |
|
|
6,019 |
|
|
Total revenues |
|
|
(2,185 |
) |
|
Noninterest expense (a) |
|
|
36,645 |
|
|
Income/(loss) before income taxes |
|
|
(38,830 |
) |
|
Provision/(benefit) for income taxes |
|
|
(37,843 |
) |
|
Net income/(loss) |
|
$ |
(987 |
) |
|
|
|
|
|
|
|
Non-Strategic |
|
|
|
|
|
Net interest income |
|
$ |
21,417 |
|
|
Noninterest income |
|
|
3,994 |
|
|
Total revenues |
|
|
25,411 |
|
|
Provision for loan losses |
|
|
16,227 |
|
|
Noninterest expense (b) |
|
|
33,646 |
|
|
Loss before income taxes |
|
|
(24,462 |
) |
|
Benefit for income taxes |
|
|
(9,418 |
) |
|
Loss from continuing operations |
|
|
(15,044 |
) |
|
Income/(loss) from discontinued operations, net of tax |
|
|
(12 |
) |
|
Net loss |
|
$ |
(15,056 |
) |
|
|
|
|
(a) |
Includes $18.3 million related to Restructuring, Repositioning and Efficiency initiatives, primarily severance related costs associated with the voluntary separation program. |
|
(b) |
Includes no charge to the repurchase and foreclosure provision. |
FHN Capital Highlights – Quarterly/Unaudited
|
|
|
|
|
|
|
(Dollars in thousands) |
|
|
4Q12 |
|
|
Tier 1 capital (a) (b) |
|
$ |
2,638,286 |
|
|
Tier 2 capital (a) |
|
|
571,943 |
|
|
Total capital (a) (b) |
|
$ |
3,210,229 |
|
|
Risk weighted assets (“RWA”) (a) |
|
$ |
20,211,000 |
|
|
Tier 1 ratio (a) |
|
|
13.05 |
% |
|
Tier 2 ratio (a) |
|
|
2.83 |
% |
|
Total capital ratio (a) |
|
|
15.88 |
% |
|
Tier 1 common ratio (a) (c) |
|
|
10.61 |
% |
|
Leverage ratio (a) |
|
|
10.62 |
% |
|
|
|
|
(a) |
Amount is an estimate. This estimate may change, possibly materially, in connection with FHN’s preparation of its Annual Report on form 10-K for the year ended December 31, 2012. |
|
(b) |
Includes $200 million of Tier 1 qualifying trust preferred securities. |
|
(c) |
Refer to the Non-GAAP to GAAP Reconciliation on page 9 of this Exhibit. |
7
FHN Asset Quality Information – Quarterly/Unaudited
|
|
|
|
|
|
|
(Thousands) |
|
4Q12 |
|
|
|
|
|
|
|
|
|
Allowance for Loan Losses Walk-Forward |
|
|
|
|
|
Beginning reserve |
|
$ |
281,744 |
|
|
Provision |
|
|
15,000 |
|
|
Charge-offs |
|
|
(31,177 |
) |
|
Recoveries |
|
|
11,396 |
|
|
Ending balance (Restricted - $4.3 million) (a) |
|
$ |
276,963 |
|
|
Reserve for unfunded commitments |
|
|
4,145 |
|
|
Total allowance for loan losses plus reserve for unfunded commitments |
|
$ |
281,108 |
|
|
|
|
|
|
|
|
Allowance for Loan Losses |
|
|
|
|
|
Regional Banking |
|
$ |
128,210 |
|
|
Non-Strategic |
|
|
148,753 |
|
|
Corporate (b) |
|
|
NM |
|
|
Total allowance for loan losses |
|
$ |
276,963 |
|
|
|
|
|
|
|
|
Nonperforming Assets |
|
|
|
|
|
Regional Banking |
|
|
|
|
|
Nonperforming loans |
|
$ |
131,834 |
|
|
Foreclosed real estate (c) |
|
|
13,726 |
|
|
Total Regional Banking |
|
$ |
145,560 |
|
|
Non-Strategic |
|
|
|
|
|
Nonperforming loans |
|
$ |
133,286 |
|
|
Nonperforming loans held-for-sale before fair value adjustments (d) |
|
|
110,567 |
|
|
Foreclosed real estate (c) |
|
|
28,041 |
|
|
Total Non-Strategic |
|
$ |
271,894 |
|
|
Corporate |
|
|
|
|
|
Nonperforming loans |
|
$ |
1,915 |
|
|
Total nonperforming assets |
|
$ |
419,369 |
|
|
|
|
|
|
|
|
Net Charge-Offs |
|
|
|
|
|
Regional Banking |
|
$ |
12,623 |
|
|
Non-Strategic |
|
|
7,158 |
|
|
Total net charge-offs |
|
$ |
19,781 |
|
|
|
|
|
|
|
|
Consolidated Key Ratios |
|
|
|
|
|
NPL% |
|
|
1.60 |
% |
|
NPA% |
|
|
1.84 |
|
|
Net charge-offs% |
|
|
0.48 |
|
|
Allowance / loans |
|
|
1.66 |
|
|
Allowance / NPL |
|
|
1.04 |
x |
|
Allowance / NPA |
|
|
0.90 |
x |
|
Allowance / charge-offs |
|
|
3.52 |
x |
|
|
|
|
|
|
|
Other |
|
|
|
|
|
Loans past due 90 days or more (e) |
|
$ |
86,017 |
|
|
Guaranteed portion (e) |
|
|
36,633 |
|
|
Foreclosed real estate from government insured loans |
|
|
18,923 |
|
|
Period-end loans, net of unearned income (millions) |
|
|
16,709 |
|
|
Remaining unfunded commitments (millions) |
|
|
7,993 |
|
|
|
|
|
(a) |
Restricted balances parenthetically presented are as of December 31, 2012. |
|
(b) |
The valuation adjustment taken upon exercise of clean-up calls includes expected losses. |
|
(c) |
Excludes foreclosed real estate from government-insured mortgages. |
|
(d) |
The average negative fair value mark taken was approximately 53% of unpaid principal balance. |
|
(e) |
Includes loans held for sale. |
8
FHN Rollforward of Other Real Estate Inventory – Quarterly/Unaudited
|
|
|
|
|
|
|
(Millions) |
|
|
4Q12 |
|
|
Other Real Estate (“ORE”) Inventory Rollforward (a) |
|
|
|
|
|
Beginning balance |
|
$ |
50.6 |
|
|
Valuation adjustments |
|
|
(1.5 |
) |
|
Adjusted balance |
|
|
49.1 |
|
|
+ New ORE |
|
|
7.5 |
|
|
+ Capitalized expenses |
|
|
0.1 |
|
|
Disposals: |
|
|
|
|
|
- Single transactions |
|
|
(13.6 |
) |
|
- Bulk sales |
|
|
(1.3 |
) |
|
Ending balance |
|
$ |
41.8 |
|
|
|
|
|
(a) |
ORE excludes foreclosed assets related to government insured mortgages. |
Use of Non-GAAP Measures
Certain information included in this exhibit is non-GAAP, meaning it is not presented in accordance with generally accepted accounting principles (“GAAP”) in the U.S. FHN’s management believes such information is relevant to understanding the capital position and results of the Company. The non-GAAP information presented in this exhibit is the Tier 1 common ratio and net interest margin adjusted for FTE. That information is reported to FHN’s management and Board of Directors through various internal reports. Additionally, disclosure of the non-GAAP capital ratio provides a meaningful base for comparability to other financial institutions as demonstrated by its use by the various banking regulators in reviewing the capital adequacy of financial institutions. Non-GAAP measures are not formally defined by GAAP or codified in the federal banking regulations, and other entities may use calculation methods that differ from those used by FHN. Refer to the tabular reconciliation of non-GAAP to GAAP measures and presentation of the most comparable GAAP items below.
FHN Non-GAAP To GAAP Reconciliation – Quarterly/Unaudited
|
|
|
|
|
|
|
(Dollars in thousands) |
|
4Q12 |
|
|
|
Tier 1 Common (Non-GAAP) |
|
|
|
|
|
(A)Tier 1 capital (a) (b) |
|
$ |
2,638,286 |
|
|
Less: Noncontrolling interest - FTBNA preferred stock (c) (d) |
|
|
294,816 |
|
|
Less: Trust preferred (e) |
|
|
200,000 |
|
|
(B)Tier 1 common (Non-GAAP) |
|
$ |
2,143,470 |
|
|
Risk Weighted Assets |
|
|
|
|
|
(C) Risk weighted assets (a) (b) |
|
$ |
20,211,000 |
|
|
(D) Total assets (GAAP) |
|
$ |
25,520,140 |
|
|
Ratios |
|
|
|
|
|
(B/(C) Tier 1 common to risk weighted assets (Non-GAAP) (a) |
|
|
10.61 |
% |
|
(A)/(D) Tier 1 capital to total assets (GAAP) (a) |
|
|
10.34 |
% |
|
Net interest income adjusted for impact of FTE (Non-GAAP) |
|
|
|
|
|
Net interest income (GAAP) |
|
$ |
170,598 |
|
|
FTE adjustment |
|
|
1,842 |
|
|
Net interest income adjusted for impact of FTE (Non-GAAP) |
|
$ |
172,440 |
|
|
|
|
|
(a) |
Amount is an estimate. This estimate may change, possibly materially, in connection with FHN’s preparation of its Annual Report on form 10-K for the year ended December 31, 2012. |
|
(b) |
Defined by and calculated in conformity with bank regulations. |
|
(c) |
Included in Total equity on FHN’s Consolidated Balance Sheets. |
|
(d) |
Represents First Tennessee Bank National Assocation preferred stock included in noncontrolling interest. |
|
(e) |
Included in Term borrowings on FHN’s Consolidated Balance Sheets. |
9
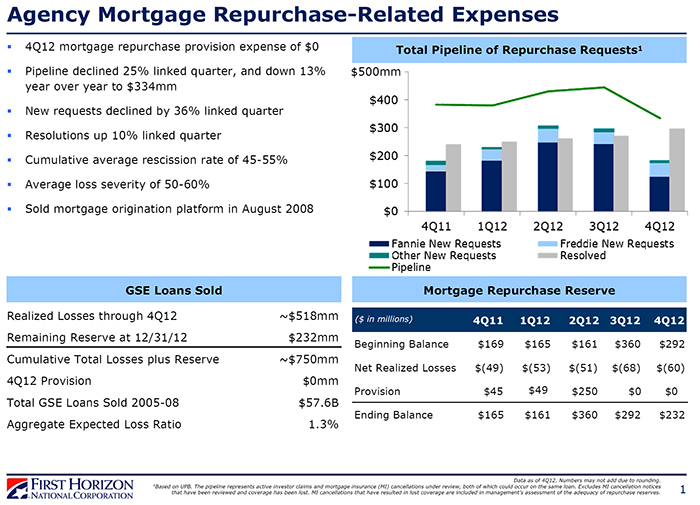
1 Agency Mortgage Repurchase-Related Expenses Mortgage Repurchase Reserve Data as of 4Q12. Numbers may not add due to rounding. 1 Based on UPB. The pipeline represents active investor claims andmortgage insurance (MI) cancellations under review, both of which could occur on the same loan. Excludes MI cancellation notices that have been reviewed and coverage has been lost. MI cancellations that have resulted in lost coverage are included in management’s assessment of the adequacy of repurchase reserves. ($ in millions) Beginning Balance Net Realized Losses Provision Ending Balance 2Q12 $161 $(51) $250 $360 3Q12 $360 $(68) $0 $292 4Q12 $292 $(60) $0 $232 4Q11 $169 $(49) $45 $165 1Q12 $165 $(53) $49 $161 Realized Losses through 4Q12 Remaining Reserve at 12/31/12 Cumulative Total Losses plus Reserve 4Q12 Provision Total GSE Loans Sold 2005-08 Aggregate Expected Loss Ratio ~$518mm $232mm ~$750mm $0mm $57.6B 1.3% GSE Loans Sold Total Pipeline of Repurchase Requests 1 ▪ 4Q12 mortgage repurchase provision expense of $0 ▪ Pipeline declined 25% linked quarter, and down 13% year over year to $334mm ▪ New requests declined by 36% linked quarter ▪ Resolutions up 10% linked quarter ▪ Cumulative average rescission rate of 45-55% ▪ Average loss severity of 50-60% ▪ Sold mortgage origination platform in August 2008 $500mm
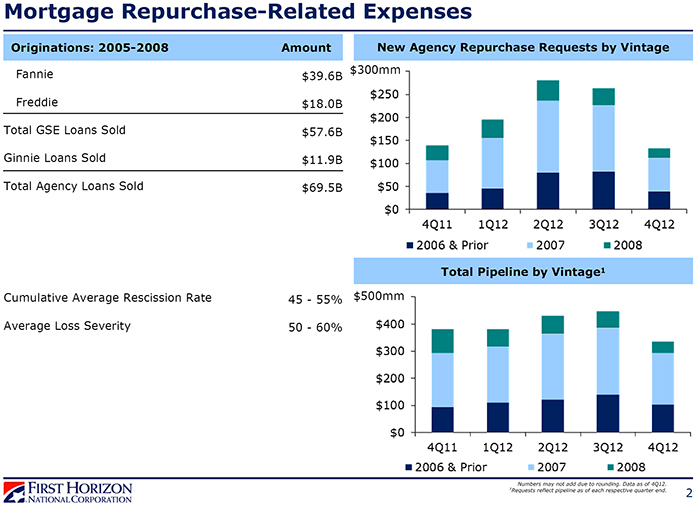
2 New Agency Repurchase Requests by Vintage Total Pipeline by Vintage 1 Numbers may not add due to rounding. Data as of 4Q12. 1 Requests reflect pipeline as of each respective quarter end. Mortgage Repurchase-Related Expenses $300mm $500mm Fannie Freddie Total GSE Loans Sold Ginnie Loans Sold Total Agency Loans Sold Cumulative Average Rescission Rate Average Loss Severity Originations: 2005-2008 Amount $39.6B $18.0B $57.6B $11.9B $69.5B 45 -55% 50 -60%