Attached files
| file | filename |
|---|---|
| EX-23.1 - EX-23.1 - Yew Bio-Pharm Group, Inc. | d30139_ex23-1.htm |
| EX-5.1 - EX-5.1 - Yew Bio-Pharm Group, Inc. | fs1a1ex5i_yewbio.htm |
| EX-3.3 - EX-3.3 - Yew Bio-Pharm Group, Inc. | fs1a1ex3iii_yewbio.htm |
As filed with the Securities and Exchange Commission on
January 23, 2013
Registration No. 333-185320
UNITED STATES
SECURITIES AND EXCHANGE COMMISSION
SECURITIES AND EXCHANGE COMMISSION
Washington, D.C. 20549
Amendment No. 1 to
FORM S-1
REGISTRATION STATEMENT UNDER
THE SECURITIES ACT OF 1933
THE SECURITIES ACT OF 1933
Yew Bio-Pharm Group, Inc.
(Exact name of registrant as specified in its charter)
Nevada |
0100 |
26-1579105 |
||||||||
(State
or other jurisdiction of incorporation) |
(Primary Standard Industrial Classification Code Number) |
(I.R.S. Employer Identification Number) |
||||||||
294 Powerbilt Avenue
Las Vegas, Nevada 89148
(702) 487-6727
(Address, including zip code, and telephone number,
including area code, of registrant’s principal executive offices)
Las Vegas, Nevada 89148
(702) 487-6727
(Address, including zip code, and telephone number,
including area code, of registrant’s principal executive offices)
Zhiguo Wang
294 Powerbilt Avenue
Las Vegas, Nevada 89148
(702) 487-6727
(Name, address, including zip code, and telephone number,
including area code, of agent for service)
294 Powerbilt Avenue
Las Vegas, Nevada 89148
(702) 487-6727
(Name, address, including zip code, and telephone number,
including area code, of agent for service)
Copy to:
Lance Jon Kimmel, Esq.
SEC Law Firm
11693 San Vicente Boulevard, Suite 357
Los Angeles, California 90049
Tel: (310) 557-3059
Fax: (310) 388-1320
Lance Jon Kimmel, Esq.
SEC Law Firm
11693 San Vicente Boulevard, Suite 357
Los Angeles, California 90049
Tel: (310) 557-3059
Fax: (310) 388-1320
Approximate date of commencement of proposed sale to
public: As soon as practicable after this Registration Statement becomes effective.
If any of the securities being registered on this Form are to be
offered on a delayed or continuous basis pursuant to Rule 415 under the Securities Act of 1933, check the following box: [X]
If this Form is filed to register additional securities for an
offering pursuant to Rule 462(b) under the Securities Act, please check the following box and list the Securities Act registration statement number of
the earlier effective registration statement for the same offering. o
If this Form is a post-effective amendment filed pursuant to Rule
462(c) under the Securities Act, check the following box and list the Securities Act registration statement number of the earlier effective
registration statement for the same offering. o
If this Form is a post-effective amendment filed pursuant to Rule
462(d) under the Securities Act, check the following box and list the Securities Act registration statement number of the earlier effective
registration statement for the same offering. o
Indicate by check mark whether the registrant is a large
accelerated filer, an accelerated filer, a non-accelerated filer, or a smaller reporting company. See the definitions of “large accelerated
filer,” “accelerated filer” and “smaller reporting company” in Rule 12b-2 of the Exchange Act.
Large accelerated
filer o |
Accelerated filer o |
|||||
Non-accelerated
filer o (Do not check if a smaller reporting company) |
Smaller reporting company [X] |
|||||
Calculation of Registration Fee
| Title of Each Class Of Securities to be Registered |
|
Amount to be Registered(1) |
|
Proposed Maximum Offering Price per Share (2) |
|
Proposed Maximum Aggregate Offering Price |
|
Amount of Registration Fee |
||||||||||
|---|---|---|---|---|---|---|---|---|---|---|---|---|---|---|---|---|---|---|
Common stock, par value $0.001 per share |
16,500,000 |
$0.25 |
$ | 4,125,000 | $ | 562.65 | ||||||||||||
(1) |
This Registration Statement covers the resale by our selling shareholders of up to 16,500,000 shares of common stock previously issued to such selling shareholders. |
(2) |
Estimated solely for the purpose of calculating the registration fee pursuant to Rule 457(a), based on the last private sales price for common stock of the registrant, as there is currently no public market price for the registrant’s common stock. The last private sales price here is determined by the price per share sold in a private placement completed in September 2009 of $0.10 per share plus an arbitrary increase in value of $0.15, to account for the potential increased value of our stock as a result of such shares having increased liquidity and being registered with the SEC. The selling shareholders will sell at the fixed price of $0.25 per share until our common stock is quoted on the OTC Bulletin Board and thereafter at prevailing market prices or privately negotiated prices. |
The Registrant hereby amends this registration statement on
such date or dates as may be necessary to delay its effective date until the registrant shall file a further amendment which specifically states that
this registration statement shall thereafter become effective in accordance with Section 8(a) of the Securities Act of 1933, as amended or until the
registration statement shall become effective on such date as the Securities and Exchange Commission, acting pursuant to Section 8(a), may
determine.
The information in this prospectus is not
complete and may be changed. We may not sell these securities until the registration statement filed with the Securities and Exchange
Commission becomes effective. This prospectus is not an offer to sell these securities and we are not soliciting offers to buy these securities in
any state where the offer or sale is not permitted.
PRELIMINARY
PROSPECTUS |
SUBJECT TO COMPLETION ON JANUARY 23, 2013 |
16,500,000 Shares of Common Stock
Yew Bio-Pharm Group, Inc.
This prospectus relates to periodic offers and sales of
16,500,000 shares of our common stock by the selling security holders.
Our common stock is presently not traded on any market or
securities exchange. The 16,500,000 shares of our common stock will be sold by selling security holders at a fixed price of $0.25 per share until our
shares are quoted on the OTC Bulletin Board and thereafter at prevailing market prices or privately negotiated prices. The offering price of $0.25 per
share for the shares of common stock was determined based on the price of our common stock of $0.10 during our most recently completed private
offering. We arbitrarily added an additional $0.15 over the offering price of our common stock during our most recently completed private offering to
account for the potential increased value of our stock as a result of such shares having increased liquidity and being registered with the SEC and
unrestricted. Such increase in value is purely speculative and not based upon any rigorous analysis.
The offering price bears no relationship to the book value,
assets or earnings of our company or any other recognized criteria of value. There can be no assurance that a market maker will agree to file the
necessary documents with the Financial Industry Regulatory Authority, or FINRA, nor can there be any assurance that such an application for quotation
will be approved. We have agreed to bear the expenses relating to the registration of the shares for the selling security holders. There is no
assurance that an active trading market for our shares will develop, or, if developed, that it will be sustained. In the absence of a trading market or
an active trading market, investors may be unable to liquidate their investment or make any profit from the investment.
We are an emerging growth company as that term is used in the
Jumpstart Our Business Startups Act of 2012 (the “JOBS Act”) and are subject to reduced public company reporting
requirements.
An investment in our securities is highly speculative,
involves a high degree of risk and should be considered only by persons who can afford the loss of their entire investment. See “Risk
Factors” beginning on page 5 of this prospectus.
Neither the Securities and Exchange Commission nor any state
securities commission has approved or disapproved of these securities or determined if this prospectus is truthful or complete. Any representation to
the contrary is a criminal offense.
The date of this prospectus is _______________,
2012
| 1 | ||||||
| 5 | ||||||
| 25 | ||||||
| 25 | ||||||
| 26 | ||||||
| 26 | ||||||
| 26 | ||||||
| 27 | ||||||
| 53 | ||||||
| 74 | ||||||
| 76 | ||||||
| 78 | ||||||
| 80 | ||||||
| 81 | ||||||
| 82 | ||||||
| 103 | ||||||
| 104 | ||||||
| 104 | ||||||
| 104 | ||||||
| F-1 |
Please read this prospectus carefully. It describes our business,
our financial condition and results of operations. We have prepared this prospectus so that you will have the information necessary to make an informed
investment decision.
You should rely only on information contained in this prospectus.
We have not authorized any other person to provide you with different information. This prospectus is not an offer to sell, nor is it seeking an offer
to buy, these securities in any state where the offer or sale is not permitted. The information in this prospectus is complete and accurate as of the
date on the front cover, but the information may have changed since that date.
This summary highlights information
contained elsewhere in this prospectus. This summary does not contain all of the information you should consider before investing in our securities.
You should read the entire prospectus, including “Risk Factors” and the consolidated financial statements and the related notes before making
an investment decision.
Unless otherwise noted, references in
this registration statement to the “Company,” “we,” “our” or “us” means Yew Bio-Pharm Group, Inc. (or
individually, YBP), a Nevada corporation; its wholly-owned subsidiaries, Yew Bio-Pharm Holdings Limited (or individually, Yew HK), a corporation
organized under the laws of Hong Kong, and Heilongjiang Jinshangjing Bio-Technology Development Co., Limited (or individually, JSJ), a corporation
organized in the People’s Republic of China, referred to as the PRC or China; and a deemed variable interest entity, or VIE, Harbin Yew Science
and Technology Development Co., Ltd. (or individually, HDS), a corporation organized in the PRC; but such references to not include the shareholders of
YBP.
Business Overview
The Company, through YBP; its
wholly-owned subsidiaries Yew HK and JSJ; and its VIE, HDS; is a major grower and seller of yew trees and manufacturer of products made from yew trees
in China. We also sell raw material, including the branches and leaves of yew trees, used in the manufacture of traditional Chinese medicine, or TCM.
The yew raw material contains taxol, and TCM containing yew raw material has been approved in the PRC for use as a secondary treatment of certain
cancers, meaning it must be administered in combination with other pharmaceutical drugs. The yew industry is regulated in the PRC because the yew tree
is considered an endangered species.
We believe that our business is built
upon five unique components:
• |
We have entered into several land use agreements with various parties, which provide the potential for us to grow a large number of yew trees on approximately 1,017,713.5 mu (approximately 169,619 acres) over the next few decades, although we cannot currently estimate the total number of trees we will grow or the total amount of land we will put into production over such period. (Mu is a Chinese measurement of land that is equivalent to approximately 0.167 acres.) |
• |
We employ proprietary, patented accelerated growth technology, “Northeast Yew Asexual Reproduction Method”, or the Asexual Reproduction Method, to bring yew trees to commercialization decades faster than growing yew trees naturally. |
• |
Because of our more productive and faster rate of yew cultivation, we have a sufficient supply of raw material to allow us to use the branches and leaves, rather than the bark, of yew trees, to sell to customers for the purpose of making TCM. The yew industry is highly regulated in the PRC because the yew tree is considered an endangered species. By harvesting only branches and leaves of yew trees we respond to both environmental sensitivities and regulations, because cutting the bark of the yew trees will damage the trees and stop it from growing new branches. |
• |
We have permits from the Heilongjiang provincial government to sell our yew trees and manufacture handicrafts using yew timber. We believe that we are one of only a handful of companies in the PRC with permissions to manufacture handicrafts using yew timber. |
• |
The TCM raw materials and yew tree segments of our business are tax-free in the PRC. |
Using patented accelerated growth
technology developed by our founder and President, Zhiguo Wang, based on principles of asexual propagation and cloning, we can bring yew trees to
maturity and commercialize them in as little as two-to-three years, compared to more than 50 years needed for naturally grown yew trees. Additionally,
we have permits from the Heilongjiang provincial government to sell our yew trees and products made from yew trees. We believe that we are one of only
a few companies in the PRC with such permission.
1
We operate in three business segments:
TCM raw materials, yew trees and handicrafts. We sell raw materials in the form of yew tree branches and leaves to our customers, primarily an
affiliate, to manufacture TCM containing taxol. We began the TCM raw materials segment in 2010.
Our TCM raw materials business became
our largest operating segment in 2011 and is expected to continue to contribute an increasing percentage of net revenue in future
periods.
In December 2009, another company owned
directly and indirectly primarily by Mr. Wang, Heilongjiang Yew Pharmaceutical Co., Ltd., or Yew Pharmaceutical, received approval from the
Heilongjiang Food and Drug Agency, or HFDA, to sell Zi Shan, a TCM to be sold under both prescription and over-the-counter drug categories.
Zi Shan contains taxol, and the TCM is approved in the PRC as a secondary treatment of cancer, meaning it must be administered in combination
with other pharmaceutical drugs. In February 2010, we began selling to Yew Pharmaceutical branches and leaves of yew trees, which is more
environmentally responsible than using the bark of yew trees, to extract taxol.
We also derive a significant amount of
our revenue from the sale of yew seedlings and trees to state-owned enterprises and private businesses for reforestation in Heilongjiang Province and
Jilin Province, in northeastern China, as well as the sale of potted yew trees to retail customers. Additionally, we generate revenue from the sale of
handicrafts, including furniture, made from yew timber. All of our revenue is derived from the Chinese domestic market.
For the nine months ended September 30,
2012, our TCM raw materials revenue represented approximately 59.2% of consolidated revenue (including 12.4% of consolidated revenues to related
parties); sale of yew trees represented approximately 38.3% of consolidated revenue; and the sale of handicrafts represented approximately 2.5% of
consolidated revenue (including 0.1% of consolidated revenues to related parties). For the nine months ended September 30, 2011, our TCM raw materials
revenue represented approximately 60.2% of consolidated revenue (including 26.5% of consolidated revenues to related parties); sale of yew trees
represented approximately 37.7% of consolidated revenue; and the sale of handicrafts represented approximately 2.1% of consolidated revenue. For the
year ended December 31, 2011, our TCM raw materials revenue represented approximately 58.0% of consolidated revenue (including 23.3% of consolidated
revenues to related parties); sale of yew trees represented approximately 40.3% of consolidated revenue; and the sale of handicrafts represented
approximately 1.7% of consolidated revenue. For the year ended December 31, 2010, our TCM raw materials revenue represented approximately 55.5% of
consolidated revenue (including 25.9% of consolidated revenues to related parties); sale of yew trees represented approximately 41.6% of consolidated
revenue; and the sale of handicrafts represented approximately 2.9% of consolidated revenue. We expect that sales from our TCM raw materials segment
will become an increasingly important source of revenue for us.
Under Article 27 of the Law of the PRC
on Enterprises Income Tax and Article 15 of the provisional regulations of the PRC on Value Added Tax, we do not pay any tax, including income tax and
value added tax, or VAT, in our TCM raw materials and yew tree segments. Our current VAT exemption certificate is valid from July 1, 2005 through
December 31, 2016 and our current income tax exemption certificate is valid from January 1, 2008 through December 31, 2058. We pay taxes on handicrafts
made from yew timber.
Zhiguo Wang, the founder of the Company
and our President, does not devote all of his time to the Company’s business. We estimate that Mr. Wang devotes approximately 71% of his time, or
approximately 120 hours per month, to the Company’s business. He devotes about 12% of his time, or approximately 20 hours per month, to the
business of Yew Pharmaceutical and the balance of his time, or approximately 28 hours per month, to the business of other companies in which he is
involved. These allocations are approximate only and are subject to change depending upon the particular projects and changing needs of the individual
businesses in which he is involved.
The executive offices of HDS, our
operating entity, are located in Harbin City, the capital of Heilongjiang Province in the PRC. Our four nurseries used to cultivate yew trees, and our
production facilities to manufacture products made from yew trees, are located in and around Harbin. We also have a facility in Harbin where we
exhibit and warehouse potted yew trees, handicrafts and furniture.
2
YBP was incorporated in Nevada on
November 5, 2007.
Risk Factors
Our ability to successfully operate our
business and achieve our goals and strategies is subject to numerous risks as discussed in the section titled “Risk Factors,” beginning on
page 5.
Corporate Information
YBP’s executive offices are
located at 294 Powerbilt Avenue, Las Vegas, Nevada 89148 and our telephone number is (702) 487-4683. Our website is www.yewchina.com. No part of
our website is incorporated into this registration statement, the prospectus forming a part thereof, or any other report we file with the Securities
and Exchange Commission, or the SEC, from time to time.
Implications of Being an Emerging Growth
Company
We qualify as an emerging growth
company as that term is used in the JOBS Act. An emerging growth company may take advantage of specified reduced reporting and other burdens that are
otherwise applicable generally to public companies. These provisions include:
• |
A requirement to have only two years of audited financial statements and only two years of related MD&A; |
• |
Exemption from the auditor attestation requirement in the assessment of the emerging growth company’s internal control over financial reporting under Section 404 of the Sarbanes-Oxley Act of 2002; |
• |
Reduced disclosure about the emerging growth company’s executive compensation arrangements; and |
• |
No non-binding advisory votes on executive compensation or golden parachute arrangements. |
We have already taken advantage of
these reduced reporting burdens in this prospectus, which are also available to us as a smaller reporting company as defined under Rule 12b-2 of the
Securities Exchange Act of 1934, as amended, or the Exchange Act.
In addition, Section 107 of the JOBS
Act also provides that an emerging growth company can take advantage of the extended transition period provided in Section 7(a)(2)(B) of the Securities
Act of 1933, as amended, or the Securities Act, for complying with new or revised accounting standards. We have elected to use the extended transition
period provided above and therefore our financial statements may not be comparable to companies that comply with public company effective
dates.
We could remain an emerging growth
company for up to five years, or until the earliest of (i) the last day of the first fiscal year in which our annual gross revenues exceed $1 billion,
(ii) the date that we become a “large accelerated filer” as defined in Rule 12b-2 under the Exchange Act, which would occur if the market
value of our common stock that is held by non-affiliates exceeds $700 million as of the last business day of our most recently completed second fiscal
quarter, or (iii) the date on which we have issued more than $1 billion in non-convertible debt during the preceding three year
period.
For more details regarding this
exemption, see “Management’s Discussion and Analysis of Financial Condition and Results of Operations — Critical Accounting
Policies.”
3
The Offering
Shares of common
stock offered by selling shareholders |
16,500,000 |
|||||
Shares of common
stock outstanding before the offering |
50,000,000 |
|||||
Shares of common
stock outstanding after the offering |
50,000,000 |
|||||
Terms of the
offering |
The
selling shareholders will determine when and how they will sell the securities offered in this prospectus. |
|||||
Trading
Market |
There
is currently no trading market for our common stock. We intend to apply soon for quotation on the OTC Bulletin Board. We will require the assistance of
a market-maker to apply for quotation and there is no guarantee that a market-maker will agree to assist us. |
|||||
Use of
proceeds |
We
will not receive proceeds from the resale of shares by the selling shareholders. |
|||||
Risk
Factors |
The
common stock offered hereby involves a high degree of risk and should not be purchased by investors who cannot afford the loss of their entire
investment. See “Risk Factors” below. |
|||||
4
An investment in the Company is
highly speculative in nature and involves a high degree of risk. You should carefully consider the risks described below together with all of the other
information included in this prospectus before making an investment decision with regard to our securities. The statements contained in or incorporated
herein that are not historic facts are forward-looking statements that are subject to risks and uncertainties that could cause actual results to differ
materially from those set forth in or implied by forward-looking statements. If any of the following risks actually occurs, our business, financial
condition or results of operations could be harmed. In that case, you may lose all or part of your investment.
Risks Related to our Business
Our products may not achieve or maintain widespread market
acceptance.
Success of our products is highly
dependent on market acceptance. We believe that continued market acceptance of our products will depend on many factors, including:
• |
the perceived advantages of our products over competing products and the availability and success of competing products; |
• |
the effectiveness of our sales and marketing efforts; |
• |
our product pricing and cost effectiveness; |
• |
the safety and efficacy of our products and the prevalence and severity of adverse side effects, if any; and |
• |
publicity concerning our products, product candidates or competing products. |
If our products fail to achieve or
maintain market acceptance, or if new products are introduced by others that are more favorably received than our products, are more cost effective or
otherwise render our products obsolete, we may experience a decline in the demand for our products. If we are unable to market and sell our products
successfully, our business, financial condition, results of operation and future growth would be adversely affected.
Our operating results may fluctuate and our future revenues
and profitability are uncertain.
Our operating results have varied in
the past and may fluctuate significantly in the future as a result of a variety of factors, many of which are outside our control. These factors
include the following:
• |
current and changing economic and financial conditions in China; |
• |
market acceptance of our products; |
• |
The effectiveness of distribution channels for our products; |
• |
the impact of price changes in our products and services or our competitors’ products and services; |
• |
the impact of decisions by distributors to offer competing or replacement products or modify or cease their marketing practices; |
• |
the availability of alternatives to our products; |
• |
seasonal fluctuations in business activity; |
• |
changes in marketing expenses related to promoting and distributing our services |
• |
limitations on sales of yew raw materials and yew trees during certain times of the year due to the seasonal growth cycle of yew trees; and |
• |
potential disruptions in commerce due to catastrophic natural events or political conflict. |
5
Our operating expenses may increase. If
an increase in our expenses is not accompanied by a corresponding increase in our revenues, our net profit will decrease and our financial condition
may be adversely affected.
Due to all of the above factors, our
revenues and operating results are difficult to forecast. Therefore, we believe that period-to-period comparisons of our operating results will not
necessarily be meaningful, and you should not rely upon them as an indication of future performance. Also, operating results may fall below our
expectations and the expectations of securities analysts or investors in one or more future periods. If this were to occur, the market price of our
common stock would likely decline.
Our future research and development projects may not be
successful.
The successful development of TCM and
pharmaceutical products can be affected by many factors. Products that appear to be promising at their early phases of research and development may
fail to be commercialized for various reasons, including the failure to obtain the necessary regulatory approvals. In addition, the research and
development cycle for new products for which we may obtain an approval certificate is long.
There is no assurance that our future
research and development projects will be successful or completed within the anticipated time frame or budget or that we will receive the necessary
approvals from relevant authorities for the production of these newly developed products, or that these newly developed products will achieve
commercial success. Even if such products can be successfully commercialized, they may not achieve the level of market acceptance that we
expect.
We have limited insurance coverage and may incur losses
resulting from product liability claims or business interruptions.
The nature of our business exposes us
to the risk of product liability claims that is inherent in the research and development, manufacturing and marketing of pharmaceutical products. These
risks are greater for our products that receive regulatory approval for commercial sale. Even if a product were approved for commercial use by an
appropriate governmental agency, there can be no assurance that users will not claim effects other than those intended resulted from the use of our
products. While to date no material claim for personal injury resulting from allegedly defective products has been brought against us, a substantial
claim or a substantial number of claims, if successful, could have a material adverse impact on our business, financial condition and results of
operations.
We have a high concentration of sales to a small number of
customers, one of which is an affiliate of our founder and President.
For the nine months ended September 30,
2012, Yew Pharmaceutical accounted for approximately 21% of our TCM raw materials revenue and approximately 13% of our consolidated revenue. For the
year ended December 31, 2011, Yew Pharmaceutical accounted for approximately 40% of our TCM raw materials revenue and approximately 23% of our
consolidated revenue. Yew Pharmaceutical is directly and indirectly owned primarily by our founder and President, Zhiguo Wang, and his wife, Guifang
Qi.
The following customers accounted for
10% or more of our consolidated revenue for the nine months ended September 30, 2012:
• |
Anhui Bairun Medication Company, or Anhyui Bairun, accounted for approximately 16% of our consolidated revenue |
• |
Shenzhen City Lianchengfa Keiji Corporation, or Shenzhen Keiji, accounted for approximately 14% of our consolidated revenue |
• |
Changchun Hengtai Medication Corporation, or Changchun Hengtai, accounted for approximately 14% of our consolidated revenue |
• |
Wuchang Hongyi Co., Ltd., or Wuchang Hongyi, accounted for approximately 13% of our consolidated revenue |
6
• |
Yew Pharmaceutical accounted for approximately 12% of our consolidated revenue |
• |
Shenzhen Tianyitang Company, or Shenzhen Tianyitang, accounted for approximately 11% of our consolidated revenue |
For the year ended December 31, 2011,
the following customers accounted for 10% or more of our consolidated revenue:
• |
Yew Pharmaceutical accounted for approximately 23% of our consolidated revenue |
• |
Anhui Bairun accounted for approximately 29% of our consolidated revenue |
• |
Changchun Hengtai accounted for approximately 10% of our consolidated revenue |
• |
Wuchang Hongyi accounted for approximately 13% of our consolidated revenue. |
The loss of any of our largest
customers could have a material adverse effect on our results of operations unless and until we can replace such customers.
The concentration of sales of yew trees
to a small number of large customers could subject us to loss of significant revenues in the event that we were to lose one or more of our larger
customers.
Additionally, many of our customers
purchase trees from us in the spring but are not able to pay their bills until after harvest in the fall. Accordingly, our accounts receivable tend to
increase during the second and third quarters of the year. If we are unable to collect the amounts owed to us by our major customers, there could be a
material adverse effect on our results of operations and liquidity.
We owe amounts to related parties that are unsecured and
payable on demand.
We owe certain amounts to related
parties, including Zishan Technology Co., Ltd., or ZTC, Yew Pharmaceutical, Zhiguo Wang and Guifang Qi, that are payable on demand. As of December 31,
2011, the aggregate amount of these payables was approximately $266,488 and at September 30, 2012, the aggregate amount of these payables was
approximately $56,098. If one or more of the parties demanded payment of the amounts due to them, we would be required to use cash on hand or other
assets to satisfy these obligations. While we believe that we presently have more than adequate resources to satisfy all of these obligations, there is
no assurance that, in the future, the use of resources to satisfy then-current amounts owed to such parties or other related parties would not require
us to modify our operations should such obligations then constitute a significant amount of our then-available resources.
We face substantial competition in connection with the
marketing and sale of our products.
Our products compete with products with
similar medical efficacy in similar market areas. Most of our competitors are well established, have greater financial, marketing, personnel and other
resources, have been in business for longer periods of time than us, and have products that have gained wide customer acceptance in the marketplace.
The TCM and pharmaceutical industries are also characterized by the frequent introduction of new products. We may be unable to compete successfully or
our competitors may develop products which have greater medical efficacy or gain wider market acceptance than ours.
We may not be able to manage our expansion of operations
effectively.
We anticipate significant continued
expansion of our business to address growth in demand for our products, as well as to capture new market opportunities. To manage the potential growth
of our operations, we will be required to improve our operational and financial systems, procedures and controls, increase manufacturing capacity and
output, and expand, train and manage our growing employee base. Furthermore, we need to maintain and expand our relationships with our customers,
suppliers and other third parties. In addition, the success of our growth strategy depends on a number of internal and external factors, such as the
expected growth of the pharmaceutical market in the PRC and the competition from other pharmaceutical companies. If we are unable to manage our growth
effectively, we may not be able to take advantage of market opportunities, execute our business strategies or respond to competitive
pressures.
7
In addition, our personnel, systems,
procedures and controls may be inadequate to support our future operations. The improvements required to manage our growth will require us to make
significant expenditures, expand, train and manage our employee base and allocate valuable management resources. If we fail to effectively manage our
growth, our operating performance will suffer and we may lose clients, key vendors and key personnel.
We may incur substantial debt which could adversely affect
our financial condition.
It is possible that we may incur
substantial debt in order to expand our business, which could adversely affect our financial condition. Incurring a substantial amount of debt may
require us to use a significant portion of our cash flow to pay principal and interest on such debt, which will reduce the amount available to fund
working capital, capital expenditures and general corporate purposes. Our indebtedness may negatively impact our ability to operate our business and
limit our ability to borrow additional funds by increasing our borrowing costs, and impact the terms, conditions and restrictions contained in possible
future debt agreements, including the addition of more restrictive covenants; impact our flexibility in planning for and reacting to changes in our
business as covenants and restrictions contained in possible future debt arrangements may require that we meet certain financial tests; and place
restrictions on the incurrence of additional indebtedness and place us at a disadvantage compared to similar companies in our industry that have less
debt.
We may not be able to raise additional capital as it is
needed to fund our operations. In such an event, we may have to curtail some of our existing and planned business activities.
While we are profitable and have
adequate financial resources to fund our business for at least the next 12 months, we may need additional capital in the future to expand our existing
operations, including growing yew trees under the Joint Venture Agreement, which could require capital beyond our available resources from operations.
We have no current plans to raise additional capital at this time. No assurance can be given that we will be able to raise any additional capital that
may be needed in any public or private offering of our securities, or secure debt through banks or other lenders.
If adequate additional financing is not
available on reasonable terms, we may not be able to expand our business and we would have to modify our business plans accordingly. There is no
assurance that additional financing will be available to us.
In connection with our growth
strategies, we may experience increased capital needs and accordingly, we may not have sufficient capital to fund our future operations without
additional capital investments. Our capital needs will depend on numerous factors, including (i) our profitability; (ii) the release of competitive
products by our competition; (iii) the level of our investment in research and development; and (iv) the amount of our capital expenditures, including
acquisitions. We cannot assure you that we will be able to obtain capital in the future to meet our needs.
In recent years, the securities markets
in the United States have experienced a high level of price and volume volatility, and the market price of securities of many companies have
experienced wide fluctuations that have not necessarily been related to the operations, performances, underlying asset values or prospects of such
companies. For these reasons, our securities can also be expected to be subject to volatility resulting from purely market forces over which we will
have no control. If we need additional funding we will, most likely, seek such funding in the United States, and the market fluctuations affect on our
stock price could limit our ability to obtain equity financing.
If we cannot obtain additional funding,
we may be required to: (i) limit our expansion; (ii) limit our marketing efforts; and (iii) decrease or eliminate capital expenditures. Such reductions
could materially adversely affect our business and our ability to compete.
Even if we do find a source of
additional capital, we may not be able to negotiate terms and conditions for receiving the additional capital that are favorable to us. Any future
capital investments could dilute or otherwise materially and adversely affect the holdings or rights of our existing shareholders. In addition, new
equity or convertible debt securities issued by us to obtain financing could have rights, preferences and
8
privileges senior to our common stock. We cannot give you any assurance that any additional financing will be available to us, or if available, will be on terms favorable to us.
Our results of operations may be affected by fluctuations
in availability and price of raw materials.
The raw materials we use are subject to
price fluctuations due to various factors beyond our control, including, among other pertinent factors:
• |
increasing market demand; |
• |
inflation; |
• |
severe climatic and environmental conditions; |
• |
seasonal factors, and |
• |
changes in governmental regulations and programs. |
We also expect that our raw material
prices will continue to fluctuate and be affected by inflation in the future. Changes to our raw materials prices may result in increases in production
and packaging costs, and we may be unable to raise the prices of our products to offset the increase costs in the short-term or at all. As a result,
our results of operations may be materially and adversely affected.
We purchase yew cuttings from third parties to grow our yew
trees. The cost of yew cuttings has been rising significantly in recent years and is expected to continue.
We purchase yew cuttings from third
parties to grow our yew trees. Because yew cuttings are scarce, the cost of yew cuttings has been rising approximately 20% per year in recent years and
we expect this to continue for at least the next few years. Scarcity in the supply of yew cuttings or significantly increased costs for yew cuttings,
or both, could have a material adverse effect on our ability to do business or our cost of doing business.
Changes in certain current favorable tax treatment we
receive could adversely affect our business.
Under current PRC national laws and
regulations, we do not pay any tax, including income tax, on (i) the raw materials we sell for the manufacture of TCM or (ii) the yew trees we sell for
reforestation or transplanting, or on the cultivate yew trees we sell as potted yew trees. If these laws and regulations change and we become subject
to tax on any of these operations, our costs of doing business would increase, which would decrease our profits and could have a material adverse
effect on our results of operations and financial condition.
Developments by competitors may render our products or
technologies obsolete or non-competitive.
The TCM and pharmaceutical industries
are intensely competitive and subject to rapid and significant technological change. A large number of companies are pursuing the development of
pharmaceuticals that target the same diseases and conditions that our TCM raw materials are targeting. We face competition from TCM and pharmaceutical
companies in the PRC and other countries. In addition, companies pursuing different but related fields represent substantial competition. Many of these
organizations competing with us have substantially greater capital resources, larger research and development staffs and facilities, longer drug
development history in obtaining regulatory approvals and greater manufacturing and marketing capabilities than we do. These organizations also compete
with us to attract qualified personnel and parties for acquisitions, joint ventures or other collaborations.
We rely substantially on our founder and President. We may
be adversely affected if we lose his services or the services of other key personnel or are unable to attract and retain additional
personnel.
Our success is substantially dependent
on the efforts of our senior management, particularly Zhiguo Wang, our founder and President. The loss of the services of Mr. Wang or other members of
our senior management may significantly delay or prevent the achievement of our business objectives. If we lose the
9
services of, or do not successfully recruit, key sales and marketing, technical and corporate personnel, the growth of our business could be substantially impaired. At present, we do not maintain key man insurance for any of our senior management.
Mr. Wang will not devote 100% of his time to the business
affairs of the Company.
Zhiguo Wang, the founder of the Company
and our President, does not devote all of his time to the Company’s business. As a result, he may not provide as much management and attention as
would be the case if he devoted 100% of his time to our business. We estimate that Mr. Wang devotes approximately 71% of his time, or approximately 120
hours per month, to the Company’s business. He devotes about 12% of his time, or approximately 20 hours per month, to the business of Yew
Pharmaceutical and the balance of his time, or approximately 28 hours per month, to the business of other companies in which he is involved. These
allocations are approximate only and are subject to change depending upon the particular projects and changing needs of the individual businesses in
which he is involved.
There may be conflicts of interest between management and
other stockholders of the Company.
Zhiguo Wang, the founder of our
company, our President and a director, is also our principal stockholder. As a result of this conflict of interest, management may have an incentive to
act in a manner that is in its best interest, which could be adverse to the interests of any other stockholders of the Company. In addition, a conflict
of interest may arise between Mr. Wang’s personal pecuniary interest directly, as the lessor of certain premises we rent, or indirectly through
companies he controls and with whom we do business, such as Yew Pharmaceutical, Shanghai Kairun Bio-Pharmaceutical Co., Ltd., or Kairun, and ZTC, and
his fiduciary duty to our stockholders.
We have engaged, and are likely to continue to engage, in
certain transactions with related parties. These transactions are not negotiated on an arms’ length basis.
We have engaged in certain transactions
with our founder and President, Zhiguo Wang, and his wife, Guifang Qi. These include renting office space from Mr. Wang and retail space from Madame
Qi, the aggregate rental expense incurred for which was approximately $4,022 for the nine months ended September 30, 2012 and $4,171 for the year ended
December 31, 2011, respectively; an agreement whereby Yew Pharmaceutical, a company controlled by Mr. Wang, purchases raw materials including yew
branches and leaves of yew trees from us to manufacture TCM and with respect to which we generated approximately $602,000 or 13% of our total revenue
for the nine months ended September 30, 2012 and $1.4 million or 23% of our total revenue for the year ended December 31, 2011, respectively; the
purchase of yew trees from a company majority-controlled by Mr. Wang and Madame Qi, of which the total purchase amount was approximately $3,400 for the
year ended December 31, 2011; and the lease of from a company majority-controlled by Mr. Wang and Madame Qi for the growing of yew trees, the lease of
which was approximately $19,300 for the nine months ended September 30, 2012 and $25,000 for the year ended December 31, 2011, respectively. We are
likely to continue to engage in these arrangements and may enter into new arrangements with Mr. Wang and/or Madame Qi. None of these arrangements has
been negotiated as a result of arms’ length transactions. It is possible that we could have received more favorable terms had these agreements
been entered into with third parties.
We may need to hire additional
employees.
Our future success also depends upon
our continuing ability to attract and retain highly qualified personnel. Expansion of our business and the management and operation will require
additional managers and employees with industry experience, and our success will be highly dependent on our ability to attract and retain skilled
management personnel and other employees. There can be no assurance that we will be able to attract or retain highly qualified personnel. Competition
for skilled personnel in our industries is significant. This competition may make it more difficult and expensive to attract, hire and retain qualified
managers and employees.
10
Reporting requirements under the Exchange Act and
compliance with the Sarbanes-Oxley Act of 2002, including establishing and maintaining acceptable internal controls over financial reporting, are
costly and may increase substantially.
The rules and regulations of the SEC
require a public company to prepare and file periodic reports under the Exchange Act, which will require that the Company engage legal, accounting,
auditing and other professional services. The engagement of such services is costly. Additionally, the Sarbanes-Oxley Act of 2002, or the
Sarbanes-Oxley Act, requires, among other things, that we design, implement and maintain adequate internal controls and procedures over financial
reporting. The costs of complying with the Sarbanes-Oxley Act and the limited technically qualified personnel we have may make it difficult for us to
design, implement and maintain adequate internal controls over financial reporting. In the event that we fail to maintain an effective system of
internal controls or discover material weaknesses in our internal controls, we may not be able to produce reliable financial reports or report fraud,
which may harm our overall financial condition and result in loss of investor confidence and a decline in our share price.
As a public company, we will be subject
to the reporting requirements of the Exchange Act, the Sarbanes-Oxley Act, the Dodd-Frank Act of 2010 and other applicable securities rules and
regulations. Despite recent reforms made possible by the JOBS Act, compliance with these rules and regulations will nonetheless increase our legal and
financial compliance costs, make some activities more difficult, time-consuming or costly and increase demand on our systems and resources,
particularly after we are no longer an “emerging growth company.” The Exchange Act requires, among other things, that we file annual,
quarterly, and current reports with respect to our business and operating results.
We are working with our legal,
independent accounting and financial advisors to identify those areas in which changes should be made to our financial and management control systems
to manage our growth and our obligations as a public company. These areas include corporate governance, corporate control, disclosure controls and
procedures and financial reporting and accounting systems. We have made, and will continue to make, changes in these and other areas. However, we
anticipate that the expenses that will be required in order to adequately prepare for being a public company could be material. We estimate that the
aggregate cost of increased legal services; accounting and audit functions; personnel, such as a chief financial officer familiar with the obligations
of public company reporting; consultants to design and implement internal controls; and financial printing alone will be a few hundred thousand dollars
per year and could be several hundred thousand dollars per year. In addition, if and when we retain independent directors and/or additional members of
senior management, we may incur additional expenses related to director compensation and/or premiums for directors’ and officers’ liability
insurance, the costs of which we cannot estimate at this time. We may also incur additional expenses associated with investor relations and similar
functions, the cost of which we also cannot estimate at this time. However, these additional expenses individually, or in the aggregate, may also be
material.
In addition, being a public company
could make it more difficult or more costly for us to obtain certain types of insurance, including directors’ and officers’ liability
insurance, and we may be forced to accept reduced policy limits and coverage or incur substantially higher costs to obtain the same or similar
coverage. The impact of these events could also make it more difficult for us to attract and retain qualified persons to serve on our board of
directors, our board committees or as executive officers.
The increased costs associated with
operating as a public company may decrease our net income or increase our net loss, and may cause us to reduce costs in other areas of our business or
increase the prices of our products or services to offset the effect of such increased costs. Additionally, if these requirements divert our
management’s attention from other business concerns, they could have a material adverse effect on our business, financial condition and results of
operations.
If we are not able to implement the requirements of Section
404 of the Sarbanes-Oxley Act in a timely manner or with adequate compliance, we may be subject to sanctions by regulatory
authorities.
Section 404 of the Sarbanes-Oxley Act
requires that we evaluate and determine the effectiveness of our internal controls over financial reporting and, beginning with our annual report for
fiscal year 2013, provide a management report on the internal control over financial reporting. We are in the preliminary stages of
seeking
11
consultants to assist us with a review of our existing internal controls and the design and implementation of additional internal controls that we may determine are appropriate. If we have a material weakness in our internal control over financial reporting, we may not detect errors on a timely basis and our financial statements may be materially misstated. We will be evaluating our internal controls systems to allow management to report on, and eventually allow our independent auditors to attest to, our internal controls. We will be performing the system and process evaluation and testing (and any necessary remediation) required to comply with the management certification requirements of Section 404 of the Sarbanes-Oxley Act of 2002.
We cannot be certain as to the timing
of completion of our evaluation, testing and remediation actions or the impact of the same on our operations. If we are not able to implement the
requirements of Section 404 in a timely manner or with adequate compliance, we may be subject to sanctions or investigation by regulatory authorities,
such as the SEC or a stock exchange on which our securities may be listed in the future. Any such action could adversely affect our financial results
or investors’ confidence in us and could cause our stock price to fall. Moreover, if we are not able to comply with the requirements of Section
404 in a timely manner, or if we or our independent registered public accounting firm identifies deficiencies in our internal controls that are deemed
to be material weaknesses, we could be subject to sanctions or investigations by the SEC, any stock exchange on which our securities may be listed in
the future, or other regulatory authorities, which would entail expenditure of additional financial and management resources and could materially
adversely affect our stock price. Inferior internal controls could also cause us to fail to meet our reporting obligations or cause investors to lose
confidence in our reported financial information, which could have a negative effect on our stock price.
We are an “emerging growth company” under the
recently enacted JOBS Act and we cannot be certain if the reduced disclosure requirements applicable to emerging growth companies will make our common
stock less attractive to investors.
We qualify as an “emerging growth
company” under the recently enacted JOBS Act. As a result, we are permitted to, and intend to, rely on exemptions from certain disclosure
requirements. For so long as we are an emerging growth company, among other things, we will not be required to:
• |
have an auditor report on our internal controls over financial reporting pursuant to Section 404(b) of the Sarbanes-Oxley Act; |
• |
submit certain executive compensation matters to shareholder advisory votes, such as “say-on-pay” and “say-on-frequency”; |
• |
obtain shareholder approval of any golden parachute payments not previously approved; and |
• |
disclose certain executive compensation related items such as the correlation between executive compensation and performance and comparisons of the Chief Executive’s compensation to median employee compensation. |
In addition, Section 107 of the JOBS
Act also provides that an emerging growth company can take advantage of the extended transition period provided in Section 7(a)(2)(B) of the Securities
Act for complying with new or revised accounting standards. In other words, an emerging growth company can delay the adoption of certain accounting
standards until those standards would otherwise apply to private companies. We have elected to take advantage of the benefits of this extended
transition period. Our financial statements may therefore not be comparable to those of companies that comply with such new or revised accounting
standards.
We will remain an “emerging growth
company” for up to five years, or until the earliest of (i) the last day of the first fiscal year in which our total annual gross revenues exceed
$1 billion; (ii) the date that we become a “large accelerated filer” as defined in Rule 12b-2 under the Securities Exchange Act of 1934,
which would occur if the market value of our ordinary shares that is held by non-affiliates exceeds $700 million as of the last business day of our
most recently completed second fiscal quarter or (iii) the date on which we have issued more than $1 billion in non-convertible debt during the
preceding three-year period.
12
Until such time, however, because the
JOBS Act has only recently been enacted, we cannot predict whether investors will find our stock less attractive because of the more limited disclosure
requirements that we may be entitled to follow and other exemptions on which we are relying while we are an “emerging growth company”. If
some investors find our common stock less attractive as a result, there may be a less active trading market for our common stock and our stock price
may be more volatile.
Our status as an “emerging growth company” under
the JOBS Act may make it more difficult to raise capital as and when we need it.
Because of the exemptions from various
reporting requirements provided to us as an “emerging growth company” and because we will have an extended transition period for complying
with new or revised financial accounting standards, we may be less attractive to investors and it may be difficult for us to raise additional capital
as and when we need it. Investors may be unable to compare our business with other companies in our industry if they believe that our financial
accounting is not as transparent as other companies in our industry. If we are unable to raise additional capital as and when we need it, our financial
condition and results of operations may be materially and adversely affected.
We must comply with the Foreign Corrupt Practices
Act.
We are required to comply with the
United States Foreign Corrupt Practices Act, which prohibits U.S. companies from engaging in bribery or other prohibited payments to foreign officials
for the purpose of obtaining or retaining business. Corruption, extortion, bribery, pay-offs, theft and other fraudulent practices occur from
time-to-time in the PRC. If our competitors engage in these practices, they may receive preferential treatment from personnel of some companies, giving
our competitors an advantage in securing business or from government officials who might give them priority in obtaining new licenses, which would put
us at a disadvantage. Although we intend to inform our personnel that such practices are illegal, we cannot assure you that our employees or other
agents will not engage in such conduct for which we might be held responsible. If our employees or other agents are found to have engaged in such
practices, we could suffer severe penalties.
We may have difficulty establishing adequate management,
legal and financial controls in the PRC.
The PRC historically has been deficient
in Western-style management and financial reporting concepts and practices, as well as in modern banking and other control systems. We may have
difficulty in hiring and retaining a sufficient number of locally-qualified employees to work in the PRC who are capable of satisfying the obligations
of a U.S. public reporting company. As a result of these factors, we may experience difficulty in establishing adequate management, legal and financial
controls (including internal controls over financial reporting), collecting financial data and preparing financial statements, books of account and
corporate records and instituting business practices in the PRC that meet U.S. standards as in effect from time to time.
If the Chinese regulatory bodies determine that the
structure for operating our business in the PRC does not comply with Chinese regulatory restrictions on foreign investment, we could be subject to
severe penalties, which may materially and adversely affect our business.
The Chinese government has broad
discretion in dealing with violations of laws and regulations, including levying fines, revoking business and other licenses and requiring actions
necessary for compliance. In particular, licenses and permits issued or granted to us by relevant governmental bodies may be revoked at a later time by
higher regulatory bodies. We cannot predict the effect of the interpretation of existing or new Chinese laws or regulations on our businesses. We
cannot assure you that our current ownership and operating structure would not be found in violation of any current or future Chinese laws or
regulations. As a result, we may be subject to sanctions, including fines, and could be required to restructure our operations or cease to provide
certain services. Any of these or similar actions could significantly disrupt our business operations or restrict us from conducting a substantial
portion of our business operations, which could materially and adversely affect our business, financial condition and results of
operations.
13
If we are determined to be in violation
of any existing or future Chinese laws, rules or regulations or fail to obtain or maintain any of the required governmental permits or approvals, the
relevant Chinese regulatory authorities would have broad discretion in dealing with such violations, including:
• |
revoking the business and operating licenses of our Chinese entities; |
• |
discontinuing or restricting the operations of our Chinese entities; |
• |
imposing conditions or requirements with which YBP or our Chinese entities may not be able to comply; |
• |
Requiring YBP or our Chinese entities to restructure the relevant ownership structure or operations; |
• |
restricting or prohibiting our use of the proceeds from any offering to finance our business and operations in the PRC; or |
• |
imposing fines. |
The imposition of any of these
penalties would severely disrupt our ability to conduct business and have a material adverse effect on our financial condition, results of operations
and prospects.
Special Risks Relating to Doing Business in the
PRC
Because all of our operations are outside the United
States, we are subject to additional significant risks.
We are subject to risks inherent in
business operations outside the United States. These risks include but are not limited to geopolitical concerns, currency fluctuations, currency
exchange controls, restrictions on repatriating foreign-derived profits to the United States, inflation, local regulatory compliance, punitive tariffs,
unstable local tax policies, trade embargoes, import and export license requirements, trade restrictions, greater difficulty collecting accounts
receivable and longer payment cycles, unfamiliarity with local laws and regulations, differing legal standards in enforcing or defending our rights in
courts or otherwise, less favorable intellectual property protection than is provided in the United States, changes in labor conditions, difficulties
in staffing and managing international operations, difficulties in finding personnel locally who are capable to complying with the requirements of
reporting by a U.S. reporting company, risks related to shipment of raw materials and finished goods across national borders, and cultural and language
differences. Foreign economies may differ favorably or unfavorably from the United States economy in growth of gross domestic product, rate of
inflation, market development, rate of savings, capital investment, resource self-sufficiency and balance of payments positions, and in many other
respects.
The Chinese government exerts substantial influence over
business activities.
We are dependent on relationships with
the local government in the provinces in which we operate in the PRC. The Chinese government has exercised and continues to exercise substantial
control over virtually every sector of the Chinese economy through regulation and state ownership. Our ability to operate in the PRC may be harmed by
changes in the PRC’s laws and regulations, including those relating to taxation, environmental regulations, land use rights, real property,
intellectual property and other matters. We intend to continue to conduct our business in material compliance with all applicable legal and regulatory
requirements. However, the central or local governments of these jurisdictions may impose new, stricter regulations or interpretations of existing
regulations that could require additional expenditures and efforts on our part to ensure our compliance with such regulations or interpretations.
Accordingly, government actions in the future, including any decision not to continue to support recent economic reforms and to return to a more
centrally planned economy or regional or local variations in the implementation of economic policies, could have a significant effect on economic
conditions in the PRC generally or particular regions thereof, and could have an adverse impact on our business prospects, results of operations and
financial condition.
14
The production, sale and distribution of TCM are subject to
Chinese regulation.
Economic reforms adopted by the Chinese
government have had a positive effect on the economic development of the country, but the government could change these economic reforms or any of the
legal systems at any time. This could either benefit or damage our operations and profitability. Some changes that could have this effect are: (i)
level of government involvement in the economy; (ii) control of foreign exchange; (iii) methods of allocating resources; (iv) balance of payment
positions; (v) international trade restrictions; and (vi) international conflict.
We depend upon governmental laws and regulations that may
be changed in ways that will harm our business.
Our business and products are subject
to government regulations mandating the manufacturing of pharmaceuticals in the PRC and other countries. Changes in the laws or regulations in the PRC,
or other countries we may sell into, that govern or apply to our operations could have a materially adverse effect on our business. For example, the
law could change so as to prohibit the use of certain pharmaceuticals. If one of our pharmaceuticals or medical products is prohibited, this change
would reduce our productivity of that product.
The Chinese government exerts substantial influence over
the manner in which we must conduct our business activities.
The PRC only recently has permitted
provincial and local economic autonomy and private economic activities. The Chinese government has exercised and continues to exercise substantial
control over virtually every sector of the Chinese economy through regulation and state ownership. Our ability to operate in the PRC may be harmed by
changes in its laws and regulations, including those relating to taxation, import and export tariffs, pharmaceutical regulations, and other matters. We
believe that our operations in the PRC are in material compliance with all applicable legal and regulatory requirements. However, the central or local
governments of these jurisdictions may impose new, stricter regulations or interpretations of existing regulations that would require additional
expenditures and efforts on our part to ensure our compliance with such regulations or interpretations.
Accordingly, government actions in the
future, including any decision not to continue to support recent economic reforms and to return to a more centrally planned economy or regional or
local variations in the implementation of economic policies, could have a significant effect on economic conditions in the PRC or particular regions
thereof, and could require us to divest ourselves of any interest we then hold in Chinese properties or joint ventures.
Our operations and assets in the PRC are subject to
significant political and economic uncertainties.
Our operations may be adversely
affected by the political environment in the PRC. The PRC has operated as a socialist and Communist state since 1949 and is controlled by the Communist
Party of the PRC. In recent years, however, the government has introduced reforms aimed at creating a “socialist market economy” and policies
have been implemented to allow business enterprises greater autonomy in their operations. Changes in the political leadership of the PRC may have a
significant effect on laws and policies related to the current economic reforms program, other policies affecting business and the general political,
economic and social environment in the PRC, including the introduction of measures to control inflation, changes in the rate or method of taxation, the
imposition of additional restrictions on currency conversion and remittances abroad, and foreign investment. These effects could substantially impair
our business, profits or prospects in the PRC. Moreover, economic reforms and growth in the PRC have been more successful in certain provinces than in
others, and the continuation or increases of such disparities could affect the political or social stability of the PRC.
Changes in Chinese laws and
regulations, or their interpretation, or the imposition of confiscatory taxation, restrictions on currency conversion, imports and sources of supply,
devaluations of currency or the nationalization or other expropriation of private enterprises could have a material adverse effect on our business,
results of operations and financial condition. Under current leadership, the Chinese government has
15
been pursuing economic reform policies that encourage private economic activity and greater economic decentralization. There is no assurance, however, that the Chinese government will continue to pursue these policies, or that it will not significantly alter these policies from time to time without notice.
We derive virtually all of our revenues from the PRC and we
are therefore susceptible to the strength of the Chinese economy.
We derive virtually all of our revenues
from the sale of products within the PRC. Any significant decline in the condition of the Chinese economy could adversely affect consumer demand of our
services, among other things, which in turn would have a material adverse effect on our business and financial condition.
Currency fluctuations and restrictions on currency exchange
may adversely affect our business, including limiting our ability to convert Chinese currency into foreign currencies and, if the Chinese currency were
to decline in value, reducing our revenue in U.S. dollar terms.
Our reporting currency is the U.S.
dollar and our operations use the RMB as our primary functional currency in our operations. We are subject to the effects of exchange rate fluctuations
with respect to either of these currencies. For example, the value of the RMB depends to a large extent on Chinese government policies and the
PRC’s domestic and international economic and political developments, as well as supply and demand in the local market. Since 1994, the official
exchange rate for the conversion of RMB to the U.S. dollar had generally been stable and the RMB had appreciated slightly against the U.S. dollar.
However, on July 21, 2005, the Chinese government changed its policy of pegging the value of RMB to the U.S. dollar. Under the new policy, RMB may
fluctuate within a narrow and managed band against a basket of certain foreign currencies. It is possible that the Chinese government could adopt a
more flexible currency policy, which could result in more significant fluctuation of RMB against the U.S. dollar. We can offer no assurance that RMB
will be stable against the U.S. dollar or any other foreign currency.
The income statements of our operations
in the PRC will be translated into U.S. dollars at the average exchange rates in each applicable period. To the extent the U.S. dollar strengthens
against foreign currencies, the translation of these foreign currencies denominated transactions results in reduced revenue, operating expenses and net
income for our international operations. Similarly, to the extent the U.S. dollar weakens against foreign currencies, the translation of these foreign
currency denominated transactions results in increased revenue, operating expenses and net income for our international operations. We are also exposed
to foreign exchange rate fluctuations as we convert the financial statements of our foreign subsidiaries into U.S. dollars in consolidation. If there
is a change in foreign currency exchange rates, the conversion of financial statements into U.S. dollars will lead to a translation gain or loss which
is recorded as a component of other comprehensive income. In addition, we have certain assets and liabilities that are denominated in currencies other
than the relevant entity’s functional currency. Changes in the functional currency value of these assets and liabilities create fluctuations that
will lead to a transaction gain or loss. We have not entered into agreements or purchased instruments to hedge our exchange rate risks, although we may
do so in the future. The availability and effectiveness of any hedging transaction may be limited and we may not be able to successfully hedge our
exchange rate risks.
Although Chinese governmental policies
were introduced in 1996 to allow the convertibility of RMB into foreign currency for current account items, conversion of RMB into foreign exchange for
capital items, such as foreign direct investment, loans or securities, requires the approval of SAFE, which is under the authority of the People’s
Bank of China. These approvals, however, do not guarantee the availability of foreign currency conversion. We cannot be sure that we will be able to
obtain all required conversion approvals for our operations or that Chinese regulatory authorities will not impose greater restrictions on the
convertibility of RMB in the future. Because a significant amount of our future revenue may be in the form of RMB, our inability to obtain the
requisite approvals or any future restrictions on currency exchanges could limit our ability to utilize revenue generated in RMB to fund any business
activities outside of the PRC or to repay foreign currency obligations, including our debt obligations, which would have a material adverse effect on
our financial condition and results of operations.
16
Chinese currency is not freely convertible, which may limit
our ability to obtain financing for expansion on favorable terms, and may limit our ability to pay dividends in the future.
The RMB is not a freely convertible
currency at present and, based solely on our understanding of the news that is widely and publicly available, it does not appear that the RMB will
become a freely convertible currency in the foreseeable future. Some, and perhaps a significant amount, of the revenue generated by our future
operations in the PRC will be paid in RMB, which may need to be converted to other currencies, primarily U.S. dollars, and remitted outside the PRC
from time to time. The Chinese government strictly regulates conversion of RMB into foreign currencies. Over the years, foreign exchange regulations in
the PRC have significantly reduced the government’s control over routine foreign exchange transactions under current accounts.
SAFE regulates the conversion of RMB
into foreign currencies. Effective July 1, 1996, foreign currency “current account” transactions by foreign investment enterprises are no
longer subject to the approval of SAFE, but need only a ministerial review, according to the Administration of the Settlement, Sale and Payment of
Foreign Exchange Provisions promulgated in 1996. “Current account” items include international commercial transactions, which occur on a
regular basis, such as those relating to trade and provision of services. Distributions to joint venture parties also are considered a “current
account” transaction. Other non-current account items, known as “capital account” items, remain subject to SAFE approval. Under current
regulations, we believe that we can obtain foreign currency in exchange for RMB from swap centers authorized by the Chinese government. We cannot
assure you that foreign currency shortages or changes in currency exchange laws and regulations by the Chinese government will not restrict us from
freely converting RMB in a timely manner or at all, as needed.
HDS is subject to restrictions on making payments to
us.
We are a holding company incorporated
in Nevada and do not have any assets or conduct any business operations other than our investments in JSJ and Yew HK, which also do not have operations
of their own. HDS is our operating entity, which we control through contractual arrangements. As a result of our holding company structure, we rely
entirely on payments from HDS to us. The Chinese government also imposes controls on the conversion of RMB into foreign currencies and the remittance
of currencies out of the PRC. We may experience difficulties in completing the administrative procedures necessary to obtain and remit foreign
currency. Furthermore, if Yew HK, JSJ or HDS were to incur debt on their own in the future, the instruments governing the debt may restrict their
ability to make payments. If we are unable to receive all of the revenues from our operations through these contractual arrangements, we may be unable
to pay dividends on our ordinary shares.
Future fluctuation in the value of the RMB may negatively
affect our ability to convert our return on operations to U.S. dollars in a profitable manner.
In recent years, the value of the RMB
has appreciated significantly against the U.S. dollar. Many countries, including the United States, have argued that the RMB is artificially
undervalued due to the PRC’s current monetary policies and have pressured the PRC to allow the RMB to float freely in world markets. If any
devaluation of the RMB were to occur in the future, our returns on our operations in the PRC, to the extent they are paid in RMB, will be negatively
affected upon conversion to U.S. dollars. Conversely, although we will attempt to have certain future payments to us paid in U.S. dollars to mitigate
the foregoing risk, any increase in the value of the RMB in the future would increase the cost of purchasing goods or services within the PRC when we
convert U.S. dollars to RMB to pay for such items.
We may be unable to enforce our rights due to policies
regarding the regulation of foreign investments in the PRC.
The PRC’s legal system is a civil
law system based on written statutes in which decided legal cases have little value as precedents, unlike the common law system prevalent in the United
States. The PRC does not have a well-developed, consolidated body of laws governing foreign investment enterprises. As a result, the administration of
laws and regulations by government agencies may be subject to considerable discretion and
17
variation, and may be subject to influence by external forces unrelated to the legal merits of a particular matter. The PRC’s regulations and policies with respect to foreign investments are evolving. Definitive regulations and policies with respect to such matters as the permissible percentage of foreign investment and permissible rates of equity returns have not yet been published. Statements regarding these evolving policies have been conflicting and any such policies, as administered, are likely to be subject to broad interpretation and discretion and to be modified, perhaps on a case-by-case basis. The uncertainties regarding such regulations and policies present risks which may affect our ability to achieve our business objectives. We cannot assure you that we will be able to enforce any legal rights we may have under our contracts or otherwise. Our failure to enforce our legal rights may have a material adverse impact on our operations and financial position, as well as our ability to compete with other companies in our industry.
Inflation in the PRC may inhibit economic activity in such
places and adversely affect our operations.
In recent years, the Chinese economy
has experienced periods of rapid expansion and high rates of inflation which have led to the adoption by the Chinese government, from time to time, of
various corrective measures designed to restrict the availability of credit or regulate growth and contain inflation. Because of a strong currency, a
large trade surplus, strong domestic growth and increasing wages, the PRC is currently experiencing inflationary pressures, despite the global economic
crisis. High inflation may in the future cause the Chinese government to impose controls on credit and/or prices, or to take other action which could
inhibit economic activity in the PRC generally, and thereby adversely affect our future business operations and prospects in the PRC. Inflation in the
PRC may inhibit economic activity in such places and adversely affect our operations. Inflation in the PRC may inhibit economic activity in such places
and adversely affect our operations.
The Chinese legal system may have inherent uncertainties
that could materially and adversely impact our ability to enforce the agreements governing our operations.
We are subject to oversight at the
provincial and local levels of government. Our operations and prospects would be materially and adversely affected by the failure of the local
government to honor our agreements or an adverse change in the laws governing them. In the event of a dispute, enforcement of these agreements could be
difficult in the PRC. The PRC tends to issue legislation, which is followed by implementing regulations, interpretations and guidelines that can render
immediate compliance difficult. Similarly, on occasion, conflicts arise between national legislation and implementation by the provinces that take time
to reconcile. These factors can present difficulties in our ability to achieve compliance. Unlike the United States, the PRC has a civil law system
based on written statutes in which judicial decisions have limited precedential value. The Chinese government has enacted laws and regulations to deal
with economic matters such as corporate organization and governance, foreign investment, commerce, taxation and trade. However, our experience in
interpreting and enforcing our rights under these laws and regulations is limited, and our future ability to enforce commercial claims or to resolve
commercial disputes in the PRC is therefore unpredictable. These matters may be subject to the exercise of considerable discretion by agencies of the
Chinese government, and forces and factors unrelated to the legal merits of a particular matter or dispute may influence their
determination.
It will be extremely difficult to acquire jurisdiction and
enforce liabilities against our officers, directors and assets based in the PRC.
Substantially all of our assets are
located outside of the United States and most of our officers and directors reside outside the United States. As a result, it may not be possible for
United States investors to enforce their legal rights, to effect service of process upon our directors or officers or to enforce judgments of United
States courts predicated upon civil liabilities and criminal penalties of our directors and officers under Federal securities laws of the United
States. Moreover, we have been advised that the PRC does not have treaties providing for the reciprocal recognition and enforcement of judgments of
courts with the United States. Further, it is unclear if extradition treaties now in effect between the United States and the PRC would permit
effective enforcement of criminal penalties of the Federal securities laws of the United States.
18
We may have limited legal recourse under Chinese law if
disputes arise with third parties.
The Chinese government has enacted some
laws and regulations dealing with matters such as corporate organization and governance, foreign investment, mergers and acquisitions, intellectual
property, commerce, taxation and trade. However, the PRC’s experience in implementing, interpreting and enforcing these laws and regulations is
limited, and our ability to enforce commercial claims or to resolve commercial disputes is unpredictable. If any new business ventures in which we may
become involved are unsuccessful, or other adverse circumstances arise from these transactions, we face the risk that the parties to these ventures may
seek ways to terminate the transactions, or, may hinder or prevent us from accessing important information regarding the financial and business
operations of any acquired companies. The resolution of these matters may be subject to the exercise of considerable discretion by agencies and other
instrumentalities of the Chinese government or those acting on its behalf, and forces unrelated to the legal merits of a particular matter or dispute
may influence their determination. Any rights we may have to specific performance, or to seek an injunction under Chinese law, in either of these
cases, are severely limited, and without a means of recourse by virtue of the Chinese legal system, we may be unable to prevent these situations from
occurring. The occurrence of any such events could have a material adverse effect on our business, financial condition and results of
operations.
Because Chinese law will govern almost all of our material
agreements, we may not be able to enforce our legal rights internationally, which could result in a significant loss of business, business
opportunities, or capital.
Chinese law will govern almost all of
our material agreements. We cannot assure you that we will be able to enforce any of our material agreements or that remedies will be available outside
of the PRC. The system of laws and the enforcement of existing laws in the PRC may not be as certain in implementation and interpretation as in the
United States. The Chinese judiciary is relatively inexperienced in enforcing corporate and commercial law, leading to a higher than usual degree of
uncertainty as to the outcome of any litigation. The inability to enforce or obtain a remedy under any of our future agreements could result in a
significant loss of business, business opportunities or capital.
National, provincial and local governments have established
many regulations governing our business operations.
We are also subject to numerous
national, provincial and local governmental regulations, including environmental, labor, waste management, health and safety matters and product
specifications and regulatory approvals from healthcare agencies. We are subject to laws and regulations governing our relationship with our employees
including: wage requirements, limitations on hours worked, working and safety conditions, citizenship requirements, work permits and travel
restrictions. These local labor laws and regulations may require substantial resources for compliance. We are subject to significant government
regulation with regard to property ownership and use in connection with our facilities in the PRC, import restrictions, currency restrictions and
restrictions on the volume of domestic sales and other areas of regulation. These regulations can limit our ability to react to market pressures in a
timely or effective way, thus causing us to lose business or miss opportunities to expand our business.
Our contractual arrangements with HDS and its shareholders
may not be as effective in providing control over HDS as direct ownership of it.
Our contractual arrangements with HDS
and its respective shareholders provide us with effective control over this company. As a result of these contractual arrangements, we are considered
to be the primary beneficiary of HDS; we consolidate the results of operations, assets and liabilities of HDS in our financial statements. However,
these contractual arrangements may not be maximally effective in providing us with control over HDS as direct ownership of these companies. If HDS or
its shareholders fail to perform their respective obligations under these contractual arrangements, we may have to incur substantial costs and
resources to enforce such arrangements, and rely on legal remedies under PRC law, including seeking specific performance or injunctive relief, and
claiming damages, which we cannot assure you will be effective.
19
The approval of the China Securities Regulatory Commission
may be required in connection with this offering under a regulation adopted in August 2006, and, if required, we cannot predict whether we will be able
to obtain such approval.
In 2006, six PRC regulatory agencies
jointly adopted the Regulations on Mergers and Acquisitions of Domestic Enterprises by Foreign Investors, or the M&A Rule. This rule requires that,
if an overseas company established or controlled by PRC domestic companies or citizens intends to acquire equity interests or assets of any other PRC
domestic company affiliated with the PRC domestic companies or citizens, such acquisition must be submitted to the Ministry of Commerce, rather than
local regulators, for approval. In addition, this regulation requires that an overseas company controlled directly or indirectly by PRC companies or
citizens and holding equity interests of PRC domestic companies needs to obtain the approval of the China Securities Regulatory Commission, or the
CSRC, prior to listing its securities on an overseas stock exchange. On September 21, 2006, the CSRC, published a notice on its official website
specifying the documents and materials required to be submitted by overseas special purpose companies seeking CSRC’s approval of their overseas
listings.
While the application of the M&A
Rule remains unclear, based on their understanding of current PRC laws, regulations, and the notice published on September 21, 2006, since JSJ was
established by means of direct investment rather than by merger or acquisition of the equity interest or assets of any “domestic company” as
defined under the M&A Rules, and no provision in the M&A Rules classifies our contractual arrangements with HDS as a type of acquisition
transaction falling under the M&A Rules, we are not required to submit an application to the Ministry of Commerce of the PRC, or MOFCOM, or the
CSRC for its approval for our contractual control on HDS.
If the CSRC or another PRC regulatory
agency subsequently determines that the approvals from MOFCOM and/or CSRC were required our contractual control over HDS, we may need to apply for a
remedial approval from the CSRC and may be subject to certain administrative punishments or other sanctions from PRC regulatory agencies. The
regulatory agencies may impose fines and penalties on our operations in the PRC, limit our operating privileges in the PRC, delay or restrict the
repatriation of our foreign currency in our offshore bank accounts into the PRC, or take other actions that could materially and adversely affect our
business, financial condition, results of operations, reputation and prospects, as well as the trading price of our common stock.
The M&A Rule sets forth complex procedures for
acquisitions conducted by foreign investors that could make it more difficult to pursue acquisitions.
The M&A Rule sets forth complex
procedures and requirements that could make merger and acquisition activities by foreign investors more time-consuming and complex, including
requirements in some instances that MOFCOM be notified in advance of any change-of-control transaction in which a foreign investor takes control of a
PRC domestic enterprise. Complying with the requirements of the M&A Rule to complete such transactions could be time-consuming, and any required
approval processes, including obtaining approval from MOFCOM, may delay or inhibit our ability to complete such transactions, which could affect our
ability to expand our business or maintain our market share.
We may be subject to penalties, including restriction on
our ability to inject capital into our PRC subsidiaries and our PRC subsidiaries’ ability to distribute profits to us, if our PRC resident
shareholders or beneficial owners fail to comply with relevant PRC foreign exchange rules.
In October 2005, SAFE issued a public
notice requiring PRC residents to register with the local SAFE branch before establishing or controlling any company outside of the PRC for the purpose
of capital financing with assets or equities of PRC companies, referred to in the notice as an “offshore special purpose vehicle PRC residents
that are shareholders and/or beneficial owners of offshore special purpose companies established before November 1, 2005 were required to register with
the local SAFE branch before March 31, 2006. In addition, any PRC resident that is a shareholder of an offshore special purpose vehicle is required to
amend its SAFE registration with respect to that offshore special purpose company in connection with any
20
increase or decrease of capital, transfer of shares, merger, division, equity investment or creation of any security interest over any assets located in the PRC or other material changes in share capital.
Zhiguo Wang, Guifang Qi and Xingming
Han, collectively referred to as the HDS Shareholders, completed their respective registrations under SAFE Circular 75 on April 15, 2011. We have
requested our other shareholders and/or beneficial owners to disclose whether they or their shareholders or beneficial owners fall within the ambit of
the SAFE notice and urge those who are PRC residents to register with the local SAFE branch as required under the SAFE notice. To date, we have not
received any notice from any of our other shareholders or beneficial owners that he or she is subject to the SAFE Circular 75 registration requirement.
However, we cannot provide any assurance that all of our shareholders and beneficial owners who are PRC residents will comply with our request to make,
obtain or update any applicable registrations or comply with other requirements required by the SAFE notice or other related rules. In case of any
non-compliance on any of our PRC resident shareholders or beneficial owners, our PRC subsidiary, JSJ, and such shareholders and beneficial owners may
be subject to fines and other legal sanctions.
If our previous offerings of stock to PRC residents are
found to have violated PRC laws and regulations, we could be subject to fines and other legal sanctions.
We believe that our previous offerings
of YBP common stock to PRC residents are not subject to regulation in the PRC, because (i) the offering was made by a non-PRC entity and (ii) it did
not involve a public offering in the PRC. However, should the M&A Rule and/or the PRC Securities Law be interpreted to apply to our previous
offerings of stock and were it also determined that we violated these laws and/or regulations, we could face fines of up to five times the proceeds of
the offerings (other than the proceeds from the HDS Shareholders) and other penalties.
Additionally, SAFE Circular 75 could be
interpreted broadly to require each PRC person who owns stock directly or indirectly in a non-PRC company to complete a registration with SAFE in
respect of such stock. The HDS Shareholders have completed their respective SAFE registration. However, to our knowledge, no other PRC person has filed
a SAFE registration with respect to their YBP common stock. The failure by these persons to complete a SAFE registration could subject HDS to fines of
30%, or 100% in certain extreme situations, of the proceeds of the offerings (other than the proceeds from the HDS Shareholders), and legal sanctions,
including without limitation restrictions on converting foreign currency it receives from YBP into RMB.
Any failure to comply with PRC regulations regarding the
registration requirements for employee stock ownership plans or share option plans may subject the PRC plan participants or us to fines and other legal
or administrative sanctions.
On December 25, 2006, the People’s
Bank of China promulgated the Administrative Measures of Foreign Exchange Matters for Individuals, which set forth the respective requirements for
foreign exchange transactions by individuals (both PRC and non-PRC citizens) under either the current account or the capital account. On January 5,
2007, SAFE issued implementation rules for the Administrative Measures of Foreign Exchange Matters for Individuals which, among other things, specified
approval requirements for certain capital account transactions such as a PRC citizen’s participation in the employee stock ownership plans or
stock option plans of an overseas publicly listed company. On March 28, 2007, SAFE promulgated the Operation Procedures of Foreign Exchange
Administration for Domestic Individuals Participating in Employee Stock Ownership Plan or Stock Option Plan of Overseas-Listed Company, or the Stock
Option Rules. Under this rule, PRC citizens who participate in an employee stock ownership plan or a stock option plan of an overseas publicly listed
company are required to register with SAFE and complete certain other procedures. For participants of an employee stock ownership plan, an overseas
custodian bank should be retained by PRC agent, which could be the PRC subsidiary of such overseas publicly-listed company or other qualified entity,
to hold on trusteeship all overseas assets held by such participants under the employee stock ownership plan. In the case of a stock option plan, a
financial institution with stock brokerage qualification at the place where the overseas publicly listed company is listed or a qualified institution
designated by the overseas publicly listed company is required to be retained to handle matters in connection with the exercise or sale of stock
options for the stock option plan participants. We and our PRC citizen employees who participate in an
21
employee stock ownership plan or a stock option plan will be subject to these regulations when our company becomes a publicly listed company in the United States. If we or our PRC optionees fail to comply with these regulations, we or our PRC optionees may be subject to fines and other legal or administrative sanctions.
Our failure to fully comply with the requirement of making
employee housing fund contribution may be subject us to fines and other costs.
Pursuant to the “Housing Fund
Management Regulation” issued by the State Council of the PRC in April 1999 and subsequently amended in March 2002, and other relevant
regulations, for corporate employers in the PRC, both the employers and their employees are required to make contributions to a government administered
housing fund. Currently we have not fully paid the employee housing funds and hence may be required to make up the unpaid amount and be subject to
administrative penalties up to RMB 50,000 in addition to the unpaid contribution of approximately RMB 40,000.
Risks Related to our Stockholders and Shares of Common
Stock
The offering price of our common stock should not be used
as an indicator of the future market price of the securities. The offering price bears no relationship to our actual value, and may make our shares
difficult to sell.
Since our common stock is not currently
listed or quoted on any exchange or quotation system, the offering price of $0.25 per share for the shares of common stock is arbitrary and includes an
arbitrary, speculative increase in value of $0.15 over the price of our common stock during our most recent private offering of $0.10 per share, to
account for the potential increased value of our stock as a result of such shares having increased liquidity and being registered with the SEC and
unrestricted. The offering price and the increase in value over the private offering price bear no relationship to the book value, assets or earnings
of our company or any other recognized criteria of value. As such, investors may be unable to sell any shares or make any profit from the
investment.
We may issue more securities in one or more capital raises
in the future, which will result in substantial dilution to all stockholders prior to such issuance.
YBP’s Articles of Incorporation
authorizes the Company to issue an aggregate of 50,000,000 shares of common stock. Any capital raise effected by us is likely to result in the issuance
of additional securities and substantial dilution in the percentage of the equity held by our then existing stockholders. We may also issue additional
shares of our common stock or other securities that are convertible into or exercisable for common stock in connection with hiring or retaining
employees or consultants, future acquisitions, future sales of our securities for capital raising purposes or for other business purposes. Our board of
directors has the power to issue any or all of such authorized but unissued shares without stockholder approval.
There is currently no trading market for our common stock,
and liquidity of shares of our common stock is limited.
Shares of our common stock are not
registered under the securities laws of any state or other jurisdiction, and there is no public trading market for our common stock. Furthermore, no
public trading market is expected to develop in the foreseeable future unless and until the Company files and obtains effectiveness of a registration
statement under the Securities Act. Therefore, outstanding shares of our common stock cannot be offered, sold, pledged or otherwise transferred unless
subsequently registered pursuant to, or exempt from registration under, the Securities Act and federal or applicable state securities laws or
regulations. Compliance with the criteria for securing exemptions under federal securities laws and applicable state securities laws is extremely
complex, especially in respect of those exemptions affording flexibility and the elimination of trading restrictions in respect of securities received
in exempt transactions and subsequently disposed of without registration under the Securities Act or state securities laws.
22
If and when our common stock becomes trading, it is likely
that it will be considered a “penny stock”, which may make it more difficult for investors to sell their shares due to suitability
requirements.
Our common stock may be deemed to be
“penny stock” as that term is defined under the Exchange Act. Penny stocks generally are equity securities with a price of less than $5.00
(other than securities registered on certain national securities exchanges or quoted on the Nasdaq system, provided that current price and volume
information with respect to transactions in such securities is provided by the exchange or system). Penny stock rules impose additional sales practice
requirements on broker-dealers who sell to persons other than established customers and “accredited investors.” The term “accredited
investor” refers generally to institutions with assets in excess of $5,000,000 or individuals with a net worth in excess of $1,000,000, not
including their primary residence, or an annual income exceeding $200,000 (or $300,000 jointly with their spouse).
The penny stock rules require a
broker-dealer, prior to a transaction in a penny stock not otherwise exempt from the rules, to deliver a standardized disclosure document in a form
prepared by the SEC, which provides information about penny stocks and the nature and level of risks in the penny stock market. Moreover,
broker/dealers are required to determine whether an investment in a penny stock is a suitable investment for a prospective investor. A broker/dealer
must receive a written agreement to the transaction from the investor setting forth the identity and quantity of the penny stock to be purchased. These
requirements may reduce the potential market for our common stock by reducing the number of potential investors. This may make it more difficult for
investors in our common stock to sell shares to third parties or to otherwise dispose of them. This could cause our stock price to
decline.
The market price of our common stock is likely to be
subject to significant price and volume fluctuations.
The price of our common stock may be
subject to wide fluctuations due to variations in our operating results, news announcements, our limited trading volume, general market trends both
domestically and internationally, currency movements, sales of common shares by our officers, directors and our principal stockholders, and sales of
common shares by existing investors. Certain events, such as the issuance of common shares upon the exercise of our outstanding stock options, could
also materially and adversely affect the prevailing market price of our common shares. Further, the stock markets in general have recently experienced
extreme price and volume fluctuations that have affected the market prices of equity securities of many companies and that have been unrelated or
disproportionate to the operating performance of such companies. In addition, a change in sentiment by U.S. investors for PRC-based companies could
have a negative impact on the stock price. These fluctuations may materially and adversely affect the market price of our common shares and the ability
to resell shares at or above the price paid, or at any price.
We cannot assure you that our common stock will be quoted
on the OTC Bulletin Board or eventually listed on any stock exchange.
Until our common stock is listed on the
Nasdaq or another stock exchange, we expect that our common stock would be eligible to be quoted on the Over-The-Counter Bulletin Board, or the OTCBB;
another over-the-counter quotation system or on the “pink sheets”, where our stockholders may find it more difficult to effect transactions
in our common stock or obtain accurate quotations as to the market value of our common stock. There can be no assurance that a market maker will agree
to file the necessary documents with FINRA, which operates the OTC Bulletin Board, nor can there be any assurance that such an application for
quotation will be approved or that a regular trading market will develop or that if developed, will be sustained. In the absence of a trading market,
an investor may be unable to liquidate their investment. We may ultimately seek the listing of our common stock on Nasdaq or the NYSE AMEX. However, we
cannot assure you that we will be able to meet the initial listing standards of either of those or any other stock exchange, or that we will be able to
maintain a listing of our common stock on either of those or any other stock exchange.
In addition, we would be subject to an
SEC rule that, if we failed to meet the criteria set forth in such rule, imposes various practice requirements on broker-dealers who sell securities
governed by such rule to persons other than established customers and accredited investors. Consequently, such rule may deter broker-dealers from
recommending or effecting transactions in our common stock, which may further affect its liquidity. This would also make it more difficult for us to
raise additional capital.
23
We should have filed a registration statement on Form 10
with the SEC on or before April 30, 2010. Our failure to do so was a violation of Section 12(g) of the Exchange Act and could subject us to liability
under federal securities laws.
Based upon our previous sales of common
stock to an aggregate of more than 500 persons and our having more than $10 million in assets, we should have filed a registration statement on Form 10
with the SEC pursuant to Section 12(g) of the Exchange Act, as then in effect, on or before April 30, 2010. Our failure to do so was a violation of
this provision of the Exchange Act. We could be subject to enforcement action by the Commission for our failure to make this filing in a timely manner,
resulting in, among other things, fines, injunctions and/or criminal penalties for our directors and officers and others responsible for our failure to
make this filing in a timely manner.
We have never paid dividends on our common stock and do not
intend to do so in the foreseeable future. Moreover, our holding company structure may hinder the payments of dividends.
We have never paid dividends on our
common stock and do not presently intend to pay any dividends in the foreseeable future. We anticipate that any funds available for payment of
dividends will be re-invested into the Company to further our business strategy. The declaration, payment and amount of any future dividends will be
made at the discretion of the board of directors, and will depend upon, among other things, the results of our operations, cash flows and financial
condition, operating and capital requirements, and other factors as the board of directors considers relevant. There is no assurance that future
dividends will be paid, and, if dividends are paid, there is no assurance with respect to the amount of any such dividend.
YBP has no direct business operations,
other than its ownership of our subsidiaries. Should we decide to pay dividends in the future, as a holding company, our ability to pay dividends and
meet other obligations depends upon the receipt of dividends or other payments from our subsidiaries, our VIE and other holdings and investments. In
addition, our subsidiaries and VIE, may, from time to time, be subject to restrictions on their ability to make distributions to us due to restrictive
covenants in agreements, restrictions on the conversion of local currency into U.S. dollars or other hard currency and other regulatory restrictions
applicable to our subsidiaries. If future dividends are paid in RMB, fluctuations in the exchange rate for the conversion of the RMB into U.S. dollars
may reduce the amount received by U.S. stockholders upon conversion of the dividend payment into U.S. dollars.
The HDS Shareholders currents have effective, but not
absolute, control of the Company. If the Founders’ Options are exercised by the HDS Shareholders, they — and Mr. Wang by himself
— will have both effective and absolute control of the Company and be able to determine the outcome of most actions by the Company and its
shareholders.
Presently, the HDS Shareholders
collectively own 22,805,512 shares, or 45.61%, of YBP’s common stock, not including certain additional shares they are deemed to beneficially own
under applicable SEC rules. They serve as the sole directors and executive officers of the Company, other than the chief financial officer, or CFO,
position. The Founders’ Options were approved by our shareholders at a special meeting of shareholders, or the Special
Meeting, on December 13, 2012, and issued to the HDS Shareholders in December 2012. As a result, the HDS Shareholders may, upon exercise,
own as many as 45,611,024 shares, or 62.65%, of YBP’s common stock. In such event, the HDS Shareholders would have both effective and absolute
control of the Company, allowing them, by themselves, to elect all directors of the Company and determine the outcome of most matters placed before the
shareholders for action. In fact, Mr. Wang himself could own as many as 40,206,950 shares, or 55.23%, of YBP’s common stock, meaning he could take
all such actions by himself.
24
This prospectus contains
forward-looking statements within the meaning of the Private Securities Litigation Reform Act of 1995, Section 27A of the Securities Act of 1933 and
Section 21E of the Securities Exchange Act of 1934. All statements other than statements of historical fact are “forward-looking statements”,
including, but not limited to, any projections of earnings, revenue or other financial items; any statements of the plans, strategies and objectives of
management for future operations; any statements concerning proposed new services or developments; any statements regarding future economic conditions
or performance; any statements of belief; and any statements of assumptions underlying any of the foregoing.
Forward-looking statements may include
the words “may,” “could,” “will,” “estimate,” “intend,” “continue,” “believe,”
“expect” or “anticipate” or other similar words. These forward-looking statements present our estimates and assumptions only as of
the date of this report. Except for our ongoing obligation to disclose material information as required by the federal securities laws, we do not
intend, and undertake no obligation, to update any forward-looking statement.
Although we believe that the
expectations reflected in any of our forward-looking statements are reasonable, actual results could differ materially from those projected or assumed
in any of our forward-looking statements. Our future financial condition and results of operations, as well as any forward-looking statements, are
subject to change and inherent risks and uncertainties. Some of the key factors impacting these risks and uncertainties include, but are not limited
to:
• |
risks related to our ability to collect amounts owed to us by some of our largest customers; |
• |
our ability to continue to purchase yew cuttings from our various suppliers at relatively stable prices; |
• |
our dependence on a small number of customers for our yew raw materials, including a related party; |
• |
our dependence on a small number of customers for our yew trees for reforestation; |
• |
our ability to market successfully yew raw materials used in the manufacture of TCM; |
• |
industry-wide market factors and regulatory and other developments affecting our operations; |
• |
our ability to sustain revenues should the Chinese economy slow from its current rate of growth; |
• |
continued preferential tax treatment for the sale of yew trees and potted yew trees; |
• |
uncertainties about involvement of the Chinese government in business in the PRC generally; and |
• |
any change in the rate of exchange of the Chinese Renminbi, or RMB, to the U.S. dollar, which could affect currency translations of our results of operations, which are earned in RMB but reported in dollars; |
• |
industry-wide market factors and regulatory and other developments affecting our operations; |
• |
a slowdown in the Chinese economy; and |
• |
risks related to changes in accounting interpretations. |
For a detailed description of these and
other factors that could cause actual results to differ materially from those expressed in any forward-looking statement, please see the section
entitled “Risk Factors,” beginning on page 5 of this Registration Statement on Form S-1.
The selling stockholders are selling
shares of common stock covered by this prospectus for their own account. We will not receive any of the proceeds from the sale of these shares. We have
agreed to bear the expenses relating to the registration of the shares for the selling security holders.
25
Since our common stock is not listed or
quoted on any exchange or quotation system, the offering price of the shares of common stock was determined by the price of the common stock that was
sold to our security holders pursuant to an exemption under Section 4(2) of the Securities Act or Regulation D or Regulation S promulgated under the
Securities Act.
The offering price of the shares of our
common stock does not necessarily bear any relationship to our book value, assets, past operating results, financial condition or any other established
criteria of value.
Although our common stock is not listed
on a public exchange, we will be filing to obtain a quotation on the OTC Bulletin Board concurrently with the filing of this prospectus. In order to be
quoted on the OTC Bulletin Board, a market maker must file an application on our behalf in order to make a market for our common stock. There can be no
assurance that a market maker will agree to file the necessary documents with FINRA, which operates the OTC Bulletin Board, nor can there be any
assurance that such an application for quotation will be approved.
In addition, there is no assurance that
our common stock will trade at market prices in excess of the initial offering price as prices for the common stock in any public market which may
develop will be determined in the marketplace and may be influenced by many factors, including the depth and liquidity.
The common stock to be sold by the
selling shareholders is common stock that is currently issued. Accordingly, there will be no dilution to our existing shareholders. However, in the
future if we decide to issue more shares, our existing shareholders will experience dilution.
There is presently no established
public trading market for our shares of common stock. We anticipate on applying for trading of our common stock on the OTC Bulletin Board upon the
effectiveness of the registration statement of which this prospectus forms apart. However, we can provide no assurance that our shares of common stock
will be traded on the Bulletin Board or, if traded, that a public market will materialize.
Holders
As of January 15, 2013, we had
998 shareholders of our common stock.
Transfer Agent and Registrar
Globex Transfer, LLC is currently the
transfer agent and registrar for our common stock. Its address is 780 Deltona Blvd., Suite 202, Deltona, Florida 32725 and its phone number is
813-344-4490.
Dividends
Since inception we have not paid any
dividends on our common stock. We currently do not anticipate paying any cash dividends in the foreseeable future on our common stock, when issued
pursuant to this offering. Although we intend to retain our earnings, if any, to finance the exploration and growth of our business, our Board of
Directors will have the discretion to declare and pay dividends in the future. Payment of dividends in the future will depend upon our earnings,
capital requirements, and other factors, which our Board of Directors may deem relevant.
Securities Authorized for Issuance under Equity Compensation
Plans
We are authorized to issue up to
15,000,000 shares of common stock for grants under the 2012 Equity Incentive Plan, or the 2012 Plan, which was adopted by our Board of Directors on
September 25, 2012 and approved by our shareholders at the Special Meeting on December 13, 2012. No grants have been made under the 2012 Plan to
date.
26
Overview
We are a major grower and seller of yew
trees and manufacturers of products made from yew trees, including potted yew trees for display in homes and offices, and handicrafts. We also sell
branches and leaves of yew trees for the manufacture of TCM containing taxol, which TCM has been approved in the PRC for use as a secondary treatment
of certain cancers, meaning it must be administered in combination with other pharmaceutical drugs. The yew industry is highly regulated in the PRC
because the Northeast yew tree is considered an endangered species.
For the nine months ended September 30,
2012 and 2011 and for the years ended December 31, 2011 and 2010, we operated in three reportable business segments: (1) the TCM raw materials segment,
consisting of the production and sale of yew raw materials used in the manufacture of TCM; (2) the yew tree segment, consisting of the growth and sale
of yew tree seedlings and mature trees, including potted miniature yew trees; and (3) the handicrafts segment, consisting of the manufacture and sale
of furniture and handicrafts made of yew timber. Our reportable segments are strategic business units that offer different products. They are managed
separately based on the fundamental differences in their operations. All of our operations are conducted in the PRC. We are located in Harbin,
Heilongjiang Province, China.
For the three months ended September
30, 2012, revenues from the sale of TCM raw materials represented approximately 65.1% of consolidated revenue (including 32.2% of consolidated revenues
to related parties); sale of yew trees represented approximately 28.9% of consolidated revenue; and the sale of handicrafts represented approximately
6.0% of consolidated revenue. For the nine months ended September 30, 2012, revenues from the sale of TCM raw materials represented approximately 59.2%
of consolidated revenue (including 12.4% of consolidated revenues to related parties); sale of yew trees represented approximately 38.3% of
consolidated revenue; and the sale of handicrafts represented approximately 2.5% of consolidated revenue (including 0.1% of consolidated revenues to
related parties).
For the three months ended September
30, 2011, revenues from the sale of TCM raw materials represented approximately 71.3% of consolidated revenue (including 20.9% of consolidated revenues
to related parties); sale of yew trees represented approximately 26.7% of consolidated revenue; and the sale of handicrafts represented approximately
2.0% of consolidated revenue. For the nine months ended September 30, 2011, revenues from the sale of TCM raw materials represented approximately 60.2%
of consolidated revenue (including 26.5% of consolidated revenues to related parties); sale of yew trees represented approximately 37.7% of
consolidated revenue; and the sale of handicrafts represented approximately 2.1% of consolidated revenue.
For the year ended December 31, 2011,
revenues from the sale of TCM raw materials represented approximately 58.0% of consolidated revenue (including 23.3% of consolidated revenues to
related parties); sale of yew trees represented approximately 40.3% of consolidated revenue; and the sale of handicrafts represented approximately 1.7%
of consolidated revenue. For the year ended December 31, 2010, revenues from the sale of TCM raw materials represented approximately 55.5% of
consolidated revenue (including 25.9% of consolidated revenues to related parties); sale of yew trees represented approximately 41.6% of consolidated
revenue; and the sale of handicrafts represented approximately 2.9% of consolidated revenue. We expect that sales from our TCM raw materials segment
will become an increasingly important source of revenue for us.
All of our revenues were generated by
HDS. Other than expenses (approximately $182,000 and $98,000 for the nine months ended September 30, 2012 and 2011, respectively) and approximately
$153,000 and $201,000 for the year ended December 31, 2011 and 2010, respectively) incurred primarily related to meeting its reporting requirements in
the U.S., YBP has no other significant business operations. At September 30, 2012, YBP has approximately $23,000 in cash and holds the 100% equity
interests in its subsidiaries Yew HK and JSJ. Yew HK itself has no business operations or assets other than holding of equity interests in JSJ. JSJ has
no business operations and assets with a book value of approximately $54,000, including approximately $37,000 in cash at September 30, 2012. JSJ also
holds the VIE interests in HDS through the contractual
27
arrangements, or the Contractual Arrangements, described in Note 1 to Notes to Consolidated Financial Statements. In the event we are unable to enforce the Contractual Agreements, we may not be able to exert effective control over HDS, and our ability to conduct our business may be materially and adversely affected. If the applicable PRC authorities invalidate our Contractual Agreements for violation of PRC laws, rules and regulations, in such an event, we would lose control of the VIE resulting in its deconsolidation in financial reporting and severe loss in our marked valuation.
Critical accounting policies and
estimates
Our discussion and analysis of our
financial condition and results of operations are based upon our consolidated financial statements, which have been prepared in accordance with
accounting principles generally accepted in the United States. The preparation of these consolidated financial statements requires us to make estimates
and judgments that affect the reported amounts of assets, liabilities, revenues and expenses, and related disclosure of contingent assets and
liabilities. We continually evaluate our estimates, including those related to bad debts, inventories, recovery of long-lived assets, income taxes, and
the valuation of equity transactions. We base our estimates on historical experience and on various other assumptions that we believed to be reasonable
under the circumstances, the results of which form the basis for making judgments about the carrying values of assets and liabilities that are not
readily apparent from other sources. Any future changes to these estimates and assumptions could cause a material change to our reported amounts of
revenues, expenses, assets and liabilities. Actual results may differ from these estimates under different assumptions or conditions. We believe the
following critical accounting policies affect our more significant judgments and estimates used in the preparation of the financial
statements.
Variable interest entities
Pursuant to ASC 810 and related
subtopics related to the consolidation of variable interest entities, we are required to include in our consolidated financial statements the financial
statements of VIEs. The accounting standards require a VIE to be consolidated by a company if that company is subject to a majority of the risk of loss
for the VIE or is entitled to receive a majority of the VIE’s residual returns. VIEs are those entities in which we, through contractual
arrangements, bear the risk of, and enjoy the rewards normally associated with ownership of the entity, and therefore we are the primary beneficiary of
the entity. HDS is considered a VIE, and we are the primary beneficiary. We entered into agreements with the HDS pursuant to which we shall receive
100% of HDS’s net income. In accordance with these agreements, HDS shall pay consulting fees equal to 100% of its net income to our wholly-owned
subsidiary, JSJ and JSJ shall supply the technology and administrative services needed to service the HDS.
The accounts of HDS are consolidated in
the accompanying financial statements. As VIEs, HDS’ sales are included in our total sales, its income from operations is consolidated with ours,
and our net income includes all of HDS’ net income, and their assets and liabilities are included in our consolidated balance sheets. The VIEs do
not have any non-controlling interest and, accordingly, we did not subtract any net income in calculating the net income attributable to us. Because of
the contractual arrangements, we have pecuniary interest in HDS that require consolidation of HDS’ financial statements with our financial
statements.
As required by ASC 810-10, we perform a
qualitative assessment to determine whether we are the primary beneficiary of HDS which is identified as a VIE of the Company. A quality assessment
begins with an understanding of the nature of the risks in the entity as well as the nature of the entity’s activities including terms of the
contracts entered into by the entity, ownership interests issued by the entity and the parties involved in the design of the entity. The significant
terms of the agreements between us and HDS are discussed above in the “Corporate Structure and Recapitalization — Second Restructure”
section. Our assessment on the involvement with HDS reveals that we have the absolute power to direct the most significant activities that impact the
economic performance of HDS. JSJ, our wholly own subsidiary, is obligated to absorb a majority of the risk of loss from HDS activities and entitles JSJ
to receive a majority of HDS’s expected residual returns. In addition, HDS’s shareholders have pledged their equity interest in HDS to JSJ,
irrevocably granted JSJ an exclusive option to purchase, to the extent permitted under PRC law, all or part of the equity interests in HDS and agreed
to entrust all the rights to exercise their voting power to the
28
person(s) appointed by JSJ. Under the accounting guidance, we are deemed to be the primary beneficiary of HDS and the results of HDS are consolidated in our consolidated financial statements for financial reporting purposes.
Accordingly, as a VIE, HDS’s sales
are included in our total sales, its income from operations is consolidated with our income from operations and our net income includes all of
HDS’s net income. All the equity (net assets) and profits (losses) of HDS are attributed to us. Therefore, no non-controlling interest in HDS is
presented in the Company’s consolidated financial statements. As we do not have any non-controlling interest and, accordingly, did not subtract
any net income in calculating the net income attributable to us. Because of the Contractual Arrangements, YBP has a pecuniary interest in HDS that
requires consolidation of HDS’s financial statements with those of ours.
Additionally, pursuant to ASC 805, as
YBP and HDS are under the common control of the HDS Shareholders, the Second Restructure was accounted for in a manner similar to a pooling of
interests. As a result, our historical amounts in the accompanying consolidated financial statements give retrospective effect to the Second
Restructure, whereby our assets and liabilities are reflected at the historical carrying values and their operations are presented as if they were
consolidated for all periods presented, with our results of operations being consolidated from the date of the Second Transfer Agreement. The accounts
of HDS are consolidated in the accompanying financial statements.
Accounts receivable
Accounts receivable are presented net
of an allowance for doubtful accounts. The Company maintains allowances for doubtful accounts for estimated losses. The Company reviews the accounts
receivable on a periodic basis and makes general and specific allowances when there is doubt as to the collectability of individual balances. In
evaluating the collectability of individual receivable balances, the Company considers many factors, including the age of the balance, a
customer’s historical payment history, its current credit-worthiness and current economic trends. Accounts are written off after exhaustive
efforts at collection. The Company recognized the probability of the collection for each customer and believes the amount of the balance as of
September 30, 2012 could be collected and accordingly, the Company did not record any allowance for doubtful accounts.
Inventories
Inventories consisted of raw materials,
work-in-progress, finished goods-handicrafts, yew seedlings and other trees (consisting of larix, spruce and poplar trees). The Company classifies its
inventories based on its historical and anticipated levels of sales; any inventory in excess of its normal operating cycle of one year is classified as
long-term on its consolidated balance sheets. Inventories are stated at the lower of cost or market value utilizing the weighted average method. Raw
materials primarily include yew timber used in the production of products such as handicrafts, furniture and other products containing yew timber.
Finished goods-handicraft and yew seedlings include direct materials, direct labor and an appropriate proportion of overhead.
We estimate the amount of the excess
inventories by comparing inventory on hand with the estimated sales that can be sold within our normal operating cycle of one year. Any inventory in
excess of our current requirements based on historical and anticipated levels of sales is classified as long-term on our consolidated balance sheets.
Our classification of long-term inventory requires us to estimate the portion of inventory that can be realized over the next 12
months.
To estimate the amount of slow-moving
or obsolete inventories, we analyze movement of our products, monitor competing products and technologies and evaluate acceptance of our products.
Periodically, we will identify inventories that cannot be sold at all or can only be sold at deeply discounted prices. An allowance will be established
if management determines that certain inventories may not be saleable. If inventory costs exceed expected market value due to obsolescence or
quantities in excess of expected demand, we will record reserves for the difference between the carrying cost and the estimated market
value.
29
Our handicraft and yew furniture
products are hand-made by traditional Chinese artisans and many are one-of-a-kind pieces that do not decrease in market value. Much of the furniture
that we produce is reproductions of popular Ming and Qing Dynasty style antique furnishings with high collection value; therefore we believe that the
market value will increase from time to time. Currently, we have an adequate supply rare Northeast yew timber on hand for approximately five
years’ worth of production. Northeast yew trees are considered an endangered species with a relatively slow growing nature and are officially
protected in the PRC. Because of the scarcity of Northeast yew timber supply, the cost to acquire new inventory of yew timber is rising. We had minimal
manufacturing activities and minimal sales of exclusive and expensive handicraft and yew furniture in 2010 and 2011 and accordingly, the yew timber and
certain handicrafts and yew furniture pieces are considered slow-moving. In 2010 and 2011, we concentrated on the sale of our TCM products and did not
actively market our handicraft products. In August 2012, we began to increase our marketing efforts for our handicraft products. Historically, we have
never sold our handicraft products below cost and we believe the current selling price which is higher than historical cost can be obtained.
Additionally, we believe that we are one of only a few companies in the PRC to have received approval for the manufacture of items made from yew
timber. In short, we may have difficulties finding reasonable cost Northeast yew timber suppliers if the handicraft finished goods sell out due to our
market development activities.
In connection with the inventory of our
Northeast yew timber, in February 2012, we engaged a third party independent appraiser and they prepared a report which indicated that the current fair
value of such timber is greater than our historical cost. The appraiser was comprised of several forestry experts and approved by the Price
Authentication Center of Heilongjiang Province of China, a provincial government institute.
Based on factors above, at September
30, 2012 and December 31, 2011, we did not provide any inventory allowance and reserve.
In accordance with ASC 905,
“Agriculture”, our costs of growing Yew seedlings are accumulated until the time of harvest and are reported at the lower of cost or
market.
Property and equipment
Property and equipment are carried at
cost and are depreciated on a straight-line basis (after taking into account their respective estimated residual value) over the estimated useful lives
of the assets. The cost of repairs and maintenance is expensed as incurred; major replacements and improvements are capitalized. When assets are
retired or disposed of, the cost and accumulated depreciation are removed from the accounts, and any resulting gains or losses are included in income
in the year of disposition. We examine the possibility of decreases in the value of fixed assets when events or changes in circumstances reflect the
fact that their recorded value may not be recoverable. The estimated useful lives are as follows:
Building
|
15
years |
|||||
Machinery and
equipment |
10
years |
|||||
Office
equipment |
3
years |
|||||
Leasehold
improvement |
5
years |
|||||
Motor
vehicles |
4
years |
|||||
Land and yew forest use rights
All land in the PRC is owned by the PRC
government and cannot be sold to any individual or company. We have recorded the amounts paid to the PRC government to acquire long-term interests to
utilize land and yew forests as land and yew forest use rights. This type of arrangement is common for the use of land in the PRC. Yew trees on land
containing yew tree forests will be used to supply raw materials such as branches, leaves and fruit to us that will be used to manufacture our
products. We amortize these land and yew forest use rights over the term of the respective land and yew forest use right, which ranges from 45 to 50
years. The lease agreements do not have any renewal option and we have no further obligations to the lessor. We record the amortization of these land
and forest use rights as part of its cost of revenues.
30
Revenue recognition
We generate our revenue from sales of
yew seedling products, sales of yew raw materials for medical application, and sales of yew craft products. Pursuant to the guidance of ASC 605 and ASC
360, we recognize revenue when persuasive evidence of an arrangement exists, delivery has occurred or services have been rendered, the purchase price
is fixed or determinable and collectability is reasonably assured, and no significant obligations remain.
Income taxes
We are governed by the Income Tax Law
of the PRC, Hong Kong and the United States. We account for income tax using the liability method prescribed by ASC 740, “Income Taxes”.
Under this method, deferred tax assets and liabilities are determined based on the difference between the financial reporting and tax bases of assets
and liabilities using enacted tax rates that will be in effect in the year in which the differences are expected to reverse. We record a valuation
allowance to offset deferred tax assets if based on the weight of available evidence; it is more-likely-than-not that some portion, or all, of the
deferred tax assets will not be realized. The effect on deferred taxes of a change in tax rates is recognized as income or loss in the period that
includes the enactment date.
We apply the provisions of ASC
740-10-50, “Accounting for Uncertainty in Income Taxes”, which provides clarification related to the process associated with accounting for
uncertain tax positions recognized in our financial statements. Audit periods remain open for review until the statute of limitations has passed. The
completion of review or the expiration of the statute of limitations for a given audit period could result in an adjustment to our liability for income
taxes. Any such adjustment could be material to our results of operations for any given quarterly or annual period based, in part, upon the results of
operations for the given period. Currently, we have no uncertain tax positions, and will continue to evaluate for uncertain positions in the
future.
Stock-based compensation
Stock based compensation is accounted
for based on the requirements of the Share-Based Payment topic of ASC 718 which requires recognition in the financial statements of the cost of
employee and director services received in exchange for an award of equity instruments over the period the employee or director is required to perform
the services in exchange for the award. The Accounting Standards Codification also requires measurement of the cost of employee and director services
received in exchange for an award based on the grant-date fair value of the award.
Pursuant to ASC 505-50, for share-based
payments to consultants and other third-parties, compensation expense is determined at the “measurement date.” The expense is recognized over
the period of services or the vesting period, whichever is applicable. Until the measurement date is reached, the total amount of compensation expense
remains uncertain. We record compensation expense based on the fair value of the award at the reporting date. The awards to consultants and other
third-parties are then revalued, or the total compensation is recalculated based on the then current fair value, at each subsequent reporting
date.
Recent accounting pronouncements
In July 2012, the Financial Accounting
Standards Board (FASB) amended ASC 350, “Intangibles — Goodwill and Other”. This amendment is intended to simplify how an entity tests
indefinite-lived assets other than goodwill for impairment by providing entities with an option to perform a qualitative assessment to determine
whether further impairment testing is necessary. The amended provisions will be effective for us beginning in the first quarter of 2014, and early
adoption is permitted. This amendment impacts impairment testing steps only, and therefore adoption will not have an impact on our consolidated
financial position, results of operations or cash flows.
In August 2012, the FASB issued
Accounting Standards Update (“ASU”) 2012-03, “Technical Amendments and Corrections to SEC Sections: Amendments to SEC Paragraphs
Pursuant to SEC Staff Accounting Bulletin (SAB) No. 114, Technical Amendments Pursuant to SEC Release No. 33-9250, and
31
Corrections Related to FASB Accounting Standards Update 2010-22 (SEC Update)” in Accounting Standards Update No. 2012-03. This update amends various SEC paragraphs pursuant to the issuance of SAB No. 114. The adoption of ASU 2012-03 is not expected to have a material impact on our consolidated financial position, results of operations or cash flows.
In October 2012, the FASB issued ASU
2012-04, “Technical Corrections and Improvements” in Accounting Standards Update No. 2012-04 (“ASU 2012-04”). The amendments in
this update cover a wide range of topics in the Accounting Standards Codification. These amendments include technical corrections and improvements to
the Accounting Standards Codification and conforming amendments related to fair value measurements. The amendments in this update will be effective for
fiscal periods beginning after December 15, 2012. The adoption of ASU 2012-04 is not expected to have a material impact on our consolidated financial
position, results of operations or cash flows.
Currency exchange rates
Our functional currency is the U.S.
dollar, and the functional currency of our operating subsidiaries and VIEs is the RMB. All of our sales are denominated in RMB. As a result, changes in
the relative values of U.S. dollars and RMB affect our reported levels of revenues and profitability as the results of our operations are translated
into U.S. dollars for reporting purposes. In particular, fluctuations in currency exchange rates could have a significant impact on our financial
stability due to a mismatch among various foreign currency-denominated sales and costs. Fluctuations in exchange rates between the U.S. dollar and RMB
affect our gross and net profit margins and could result in foreign exchange and operating losses.
Our exposure to foreign exchange risk
primarily relates to currency gains or losses resulting from timing differences between signing of sales contracts and settling of these contracts.
Furthermore, we translate monetary assets and liabilities denominated in other currencies into RMB, the functional currency of our operating
subsidiaries. Our results of operations and cash flow are translated at average exchange rates during the period, and assets and liabilities are
translated at the unified exchange rate at the end of the period. Translation adjustments resulting from this process are included in accumulated other
comprehensive income in our statement of shareholders’ equity. We have not used any forward contracts, currency options or borrowings to hedge our
exposure to foreign currency exchange risk. We cannot predict the impact of future exchange rate fluctuations on our results of operations and may
incur net foreign currency losses in the future.
Our financial statements are expressed
in U.S. dollars, which is the functional currency of our parent company. The functional currency of our operating subsidiaries and affiliates is RMB.
To the extent we hold assets denominated in U.S. dollars, any appreciation of the RMB against the U.S. dollar could result in a charge in our statement
of operations and a reduction in the value of our U.S. dollar denominated assets. On the other hand, a decline in the value of RMB against the U.S.
dollar could reduce the U.S. dollar equivalent amounts of our financial results.
Recently Enacted JOBS Act
We qualify as an “emerging growth
company” under the recently enacted JOBS Act. As a result, we are permitted to, and intend to, rely on exemptions from certain disclosure
requirements. For so long as we are an emerging growth company, among other things, we will not be required to:
• |
Have an auditor report on our internal controls over financial reporting pursuant to Section 404(b) of the Sarbanes-Oxley Act; |
• |
Submit certain executive compensation matters to shareholder advisory votes, such as “say-on-pay” and “say-on-frequency”; |
• |
Obtain shareholder approval of any golden parachute payments not previously approved; and |
• |
Disclose certain executive compensation related items such as the correlation between executive compensation and performance and comparisons of the Chief Executive’s compensation to median employee compensation. |
32
In addition, Section 107 of the JOBS
Act also provides that an emerging growth company can take advantage of the extended transition period provided in Section 7(a)(2)(B) of the Securities
Act for complying with new or revised accounting standards. In other words, an emerging growth company can delay the adoption of certain accounting
standards until those standards would otherwise apply to private companies. We have elected to take advantage of the benefits of this extended
transition period. Our financial statements may therefore not be comparable to those of companies that comply with such new or revised accounting
standards.
We will remain an “emerging growth
company” for up to five years, or until the earliest of (i) the last day of the first fiscal year in which our total annual gross revenues exceed
$1 billion; (ii) the date that we become a “large accelerated filer” as defined in Rule 12b-2 under the Securities Exchange Act of 1934,
which would occur if the market value of our ordinary shares that is held by non-affiliates exceeds $700 million as of the last business day of our
most recently completed second fiscal quarter or (iii) the date on which we have issued more than $1 billion in non-convertible debt during the
preceding three-year period.
Until such time, however, because the
JOBS Act has only recently been enacted, we cannot predict whether investors will find our stock less attractive because of the more limited disclosure
requirements that we may be entitled to follow and other exemptions on which we are relying while we are an “emerging growth company”. If
some investors find our common stock less attractive as a result, there may be a less active trading market for our common stock and our stock price
may be more volatile.
Results of Operations
The following tables set forth key
components of our results of operations for the periods indicated, in dollars, and key components of our revenue for the periods indicated, in dollars.
The discussion following the table is based on these results.
| For the Three Months Ended September 30, |
For the Nine Months Ended September 30, |
For the Years Ended December 31, |
|||||||||||||||||||||||||
|---|---|---|---|---|---|---|---|---|---|---|---|---|---|---|---|---|---|---|---|---|---|---|---|---|---|---|---|
| 2012 |
2011 |
2012 |
2011 |
2011 |
2010 |
||||||||||||||||||||||
Revenue
— third parties |
$ | 930,557 | $ | 954,122 | $ | 4,230,631 | $ | 3,246,602 | $ | 4,564,426 | $ | 3,789,181 | |||||||||||||||
Revenue
— related party |
442,467 | 251,876 | 602,159 | 1,169,688 | 1,396,613 | 1,338,871 | |||||||||||||||||||||
Total
revenues |
1,373,024 | 1,205,998 | 4,832,790 | 4,416,290 | 5,961,039 | 5,128,052 | |||||||||||||||||||||
Cost of
revenues — third parties |
146,409 | 220,121 | 726,957 | 691,588 | 741,508 | 1,178,382 | |||||||||||||||||||||
Cost of
revenues — related party |
84,528 | 41,009 | 109,572 | 297,004 | 384,457 | 459,681 | |||||||||||||||||||||
Total cost of
revenues |
230,937 | 261,130 | 836,709 | 988,592 | 1,125,965 | 1,638,063 | |||||||||||||||||||||
Gross profit
|
1,142,087 | 944,868 | 3,996,081 | 3,427,698 | 4,835,074 | 3,489,989 | |||||||||||||||||||||
Operating
expenses |
262,656 | 230,109 | 637,666 | 576,235 | 788,408 | 909,296 | |||||||||||||||||||||
Income from
operations |
879,431 | 714,759 | 3,358,415 | 2,851,463 | 4,046,666 | 2,580,693 | |||||||||||||||||||||
Other income
(expenses) |
228 | (2,454 | ) | 1,455 | (13,126 | ) | (6,355 | ) | 5,267 | ||||||||||||||||||
Net income
|
879,659 | 712,305 | 3,359,870 | 2,838,337 | 4,040,311 | 2,585,960 | |||||||||||||||||||||
Other
comprehensive income |
|||||||||||||||||||||||||||
Unrealized
foreign currency translation gain (loss) |
(59,359 | ) | 158,519 | 108,308 | 582,653 | 778,392 | 463,826 | ||||||||||||||||||||
Comprehensive
income |
$ | 820,300 | $ | 870,824 | $ | 3,468,178 | $ | 3,420,990 | $ | 4,818,703 | $ | 3,049,786 | |||||||||||||||
33
THREE AND NINE MONTHS ENDED SEPTEMBER 30, 2012 COMPARED
TO THREE AND NINE MONTHS ENDED SEPTEMBER 30, 2011
Revenues
For the three months ended September
30, 2012, we had total revenues of $1,373,024, as compared to $1,205,998 for the three months ended September 30, 2011, an increase of $167,026 or
13.8%. For the nine months ended September 30, 2012, we had total revenues of $4,832,790, as compared to $4,416,290 for the nine months ended September
30, 2011, an increase of $416,500 or 9.4%. The increase in total revenue was attributable to the increase in revenue from all three of our business
segments, and is summarized as follows:
| Three Months Ended September 30, |
||||||||||||||||||
|---|---|---|---|---|---|---|---|---|---|---|---|---|---|---|---|---|---|---|
| 2012 |
2011 |
Increase |
Percentage Change |
|||||||||||||||
TCM raw
materials |
$ | 893,909 | $ | 859,497 | $ | 34,412 | 4.0 | % | ||||||||||
Yew trees
|
396,416 | 322,015 | 74,401 | 23.1 | % | |||||||||||||
Handicrafts
|
82,699 | 24,486 | 58,213 | 237.7 | % | |||||||||||||
Total
|
$ | 1,373,024 | $ | 1,205,998 | $ | 167,026 | 13.8 | % | ||||||||||
| Nine Months Ended September 30, |
||||||||||||||||||
|---|---|---|---|---|---|---|---|---|---|---|---|---|---|---|---|---|---|---|
| 2012 |
2011 |
Increase |
Percentage Change |
|||||||||||||||
TCM raw
materials |
$ | 2,860,552 | $ | 2,659,234 | $ | 201,318 | 7.6 | % | ||||||||||
Yew trees
|
1,853,504 | 1,665,665 | 187,839 | 11.3 | % | |||||||||||||
Handicrafts
|
118,734 | 91,391 | 27,343 | 29.9 | % | |||||||||||||
Total
|
$ | 4,832,790 | $ | 4,416,290 | $ | 416,500 | 9.4 | % | ||||||||||
Sales of yew raw materials to a related
party customer decreased during the first two quarters of 2012 because the related party customer had adequate inventory for its needs and we focused
our attention on expanding such sales to third party customers. During the third quarter of 2012, sales of yew raw materials to the related party
customer increased because the related party customer required more yew raw material as its own inventory decreased, while sales of yew raw material to
third party customers decreased because such customers now had adequate inventory. Over the nine months ended September 30, 2012, the overall mix of
sales of our yew raw materials consisted of sales primarily to third party customers compared to the related party customer.
Cost of Revenues
For the three months ended September
30, 2012, cost of revenues amounted to $230,937, as compared to $261,130 for the three months ended September 30, 2011, a decrease of $30,193 or 11.6%.
For the nine months ended September 30, 2012, cost of revenues amounted to $836,709 as compared to $988,592 for the nine months ended September 30,
2011, a decrease of $151,883 or 15.4%. Our cost of revenues principally consists of the cost of raw materials such as wood plates and yews,
amortization of land and yew forest use rights, labor, utilities, manufacturing costs, manufacturing related depreciation, machinery maintenance costs,
purchasing and receiving costs, inspection costs, and other fixed costs. For the three months ended September 30, 2012, cost of revenues accounted for
16.8% of total revenues compared to 21.7% of total revenues for the three months ended September 30, 2011. For the nine months ended September 30,
2012, cost of revenues accounted for 17.3% of total revenues compared to 22.4% of total revenues for the nine months ended September 30,
2011.
34
Cost of revenues by product categories
were as follows:
| Three Months Ended September 30, |
||||||||||||||||||
|---|---|---|---|---|---|---|---|---|---|---|---|---|---|---|---|---|---|---|
| 2012 |
2011 |
Increase (Decrease) |
Percentage Change |
|||||||||||||||
TCM raw
materials |
$ | 158,354 | $ | 161,226 | $ | (2,872 | ) | (1.8 | )% | |||||||||
Yew trees
|
21,395 | 88,380 | (66,985 | ) | (75.8 | )% | ||||||||||||
Handicrafts
|
51,188 | 11,524 | 39,664 | 344.2 | % | |||||||||||||
Total
|
$ | 230,937 | $ | 261,130 | $ | (30,193 | ) | (11.6 )% | ||||||||||
| Nine Months Ended September 30, |
||||||||||||||||||
|---|---|---|---|---|---|---|---|---|---|---|---|---|---|---|---|---|---|---|
| 2012 |
2011 |
Increase (Decrease) |
Percentage Change |
|||||||||||||||
TCM raw
materials |
$ | 446,436 | $ | 640,843 | $ | (194,407 | ) | (30.3 | )% | |||||||||
Yew trees
|
320,410 | 287,681 | 32,729 | 11.4 | % | |||||||||||||
Handicrafts
|
69,863 | 60,068 | 9,795 | 16.3 | % | |||||||||||||
Total
|
$ | 836,709 | $ | 988,592 | $ | (151,883 | ) | 15.4 | % | |||||||||
The decrease in our cost of revenues
for the three months ended September 30, 2012 was primarily a result of decreases in costs of revenue in our TCM raw materials and yew trees segments,
partially offset by an increase in cost of revenue in our handicrafts segment.
The decrease in our cost of revenues
for the nine months ended September 30, 2012 as compared to the nine months ended September 30, 2011 was primarily a result of decreases in costs of
revenue in our TCM raw materials, partially offset by an increase in cost of revenue in our yew trees and handicrafts segments.
Gross Profit
For the three months ended September
30, 2012, gross profit was $1,142,087 as compared to $944,868 for the three months ended September 30, 2011, representing gross margins of 83.2% and
78.3%, respectively. For the nine months ended September 30, 2012, gross profit was $3,996,081 as compared to $3,427,698 for the nine months ended
September 30, 2011, representing gross margins of 82.7% and 77.6%, respectively. Gross profit margins by product categories were as
follows:
| Three Months Ended September 30, |
||||||||||||||
|---|---|---|---|---|---|---|---|---|---|---|---|---|---|---|
| 2012 |
2011 |
Increase (Decrease) |
||||||||||||
TCM raw
materials |
82.3 | % | 81.2 | % | 1.1 | % | ||||||||
Yew trees
|
94.6 | % | 72.6 | % | 22.0 | % | ||||||||
Handicrafts
|
38.1 | % | 52.9 | % | (14.8 | )% | ||||||||
Total
|
83.2 | % | 78.3 | % | 4.9 | % | ||||||||
| Nine Months Ended September 30, |
||||||||||||||
|---|---|---|---|---|---|---|---|---|---|---|---|---|---|---|
| 2012 |
2011 |
Increase |
||||||||||||
TCM raw
materials |
84.4 | % | 75.9 | % | 8.5 | % | ||||||||
Yew trees
|
82.7 | % | 82.7 | % | 0.0 | % | ||||||||
Handicrafts
|
41.2 | % | 34.3 | % | 6.9 | % | ||||||||
Total
|
82.7 | % | 77.6 | % | 5.1 | % | ||||||||
The overall increase in our gross
profit margin for the three months ended September 30, 2012 was primarily attributable to the increase in the TCM raw materials and yew trees segments,
partially offset by a decrease in our handicrafts segment. The overall increase in our gross profit margin for the nine months ended September 30, 2012
was primarily attributable to the increase in the TCM raw materials and handicrafts segments.
35
For the three and nine months ended
September 30, 2012, the increase in our gross margin percentage related to the sale of TCM raw materials was primarily attributable to the operational
efficiency improvements as we have had longer operation experience in the TCM raw materials segment as compared to the same periods in
2011.
The increase in our gross margin
percentage related to the sale of yew trees for the three months ended September 30, 2012 as compared to the three months ended September 30, 2011 is
primarily attributable to the fact that the average unit selling price for our yew trees was higher, which contributed to the higher gross profit
margin in 2012. For the nine months ended September 30, 2012, the gross margin percentage related to the sale of yew trees remained consistent as
compared to 2011.
The decrease in our gross margin
percentage related to the sale of handicrafts for the three months ended September 30, 2012 was because we sold more high value handicrafts as compared
to the same period in 2011. High value handicrafts products generally have lower profit margins compared to low value handicraft products. The increase
in our gross margin percentage related to the sale of handicrafts for the nine months ended September 30, 2012 as compared to the same periods in 2011
was mainly because, overall, we sold fewer high value handicrafts as a percentage of our handicrafts revenue in 2012.
Selling Expenses
Selling expenses consisted of the
following:
| Three Months Ended September 30, |
Nine Months Ended September 30, |
||||||||||||||||||
|---|---|---|---|---|---|---|---|---|---|---|---|---|---|---|---|---|---|---|---|
| 2012 |
2011 |
2012 |
2011 |
||||||||||||||||
Salary and
related benefit |
$ | 4,016 | $ | 3,129 | $ | 11,718 | $ | 8,714 | |||||||||||
Advertising
|
— | 61 | — | 9,482 | |||||||||||||||
Shipping and
handling |
303 | 3,568 | 696 | 10,317 | |||||||||||||||
Other
|
2,324 | 1,697 | 5,466 | 14,127 | |||||||||||||||
Total
|
$ | 6,643 | $ | 8,455 | $ | 17,880 | $ | 42,640 | |||||||||||
For the three months ended September
30, 2012, selling expenses were $6,643, as compared to $8,455 for the three months ended September 30, 2011, a decrease of $1,812 or 21.4%. The
decrease in our selling expenses for the three months ended September 30, 2012 was primarily attributable to the decreases in advertising and shipping
and handling expenses, partially offset by the increases in salary and related benefit and other expenses. For the nine months ended September 30,
2012, selling expenses were $17,880 as compared to $42,640 for the nine months ended September 30, 2011, a decrease of $24,760 or 58.1%. The decrease
in our selling expenses for the nine months ended September 30, 2012 was primarily attributable to the decreases in advertising, shipping and handling
and other expenses, partially offset by an increase in salary and related benefit.
For the three months ended September
30, 2012, salary and related benefit increased by $887 as compared to the three months ended September 30, 2011. The increase was attributable to the
increase in salary expenses and bonuses paid, as we had more sales staff on our sales team during the three months ended September 30, 2012 as compared
to the same period in 2011. For the nine months ended September 30, 2012, salary and related benefit increased by $3,004 as compared to the nine months
ended September 30, 2011, which was primarily attributable to an increase in salary expenses and bonus paid, as we had more sales staff on our sales
team during the nine months ended September 2012 as compared to the corresponding period in 2011.
For the three and nine months ended
September 30, 2012, we did not incur any advertising expenses, while we recorded advertising expenses of $61 and $9,482 for the three and nine months
ended September 30, 2011, respectively. We primarily relied on our sales staff to promote our products and did not have any advertising activities
during 2012.
For the three months ended September
30, 2012, shipping and handling expenses decreased by $3,265 as compared to the three months ended September 30, 2011. In the third quarter of 2012,
the majority of the shipping fees were either paid directly or reimbursed by our customers, while in the third quarter of 2011
36
shipping fees were paid by us. For the nine months ended September 30, 2012, shipping and handling expenses decreased by $9,621 as compared to the nine months ended September 30, 2011. For the nine months ended September 30, 2012, a majority of the shipping fees were either paid directly by our customers or reimbursed to us by our customers, while in the nine months ended September 30, 2011 shipping fees were paid by us.
For the three months ended September
30, 2012, other miscellaneous selling expenses increased by $627 as compared to the three months ended September 30, 2011. This increase was primarily
attributable to the increase in materials expenditure related to handicrafts selling activities during the three months ended September 30, 2012. For
the nine months ended September 30, 2012, other miscellaneous selling expenses decreased by $8,661 as compared to the nine months ended September 30,
2011. This decrease was primarily attributable to the overall decrease in materials expenditure related to selling activities.
General and Administrative Expenses
For the three months ended September
30, 2012, general and administrative expenses amounted to $256,013, as compared to $221,654 for the three months ended September 30, 2011, an increase
of $34,359 or 15.5%. For the nine months ended September 30, 2012, general and administrative expenses amounted to $619,786, as compared to $533,595
for the nine months ended September 30, 2011, an increase of $86,191 or 16.2%. General and administrative expenses consisted of the
following:
| Three Months Ended September 30, |
Nine Months Ended September 30, |
||||||||||||||||||
|---|---|---|---|---|---|---|---|---|---|---|---|---|---|---|---|---|---|---|---|
| 2012 |
2011 |
2012 |
2011 |
||||||||||||||||
Compensation
and related benefits |
$ | 52,056 | $ | 42,568 | $ | 152,061 | $ | 124,205 | |||||||||||
Depreciation
|
48,634 | 38,153 | 137,624 | 110,336 | |||||||||||||||
Travel and
entertainment |
27,819 | 25,305 | 68,120 | 77,013 | |||||||||||||||
Professional
fees |
98,374 | 68,674 | 183,628 | 127,902 | |||||||||||||||
Research and
development |
— | 694 | — | 15,968 | |||||||||||||||
Other
|
29,130 | 46,260 | 78,353 | 78,171 | |||||||||||||||
Total
|
$ | 256,013 | $ | 221,654 | $ | 619,786 | $ | 533,595 | |||||||||||
The increase in our general and
administrative expenses for the three months ended September 30, 2012, as compared to the comparable period in 2011, was primarily attributable to
increases in compensation and related benefits, depreciation and professional fees, partially offset by decreases in other expenses. The increase in
our general and administrative expenses for the nine months ended September 30, 2012, as compared to the corresponding period in 2011, was primarily
attributable to increases in compensation and related benefits paid, depreciation expenses, and professional fees, partially offset by the decreases in
travel and entertainment expenses and research and development expenses. The changes in these expenses for the three and nine months ended September
30, 2012, as compared to the three and nine months ended September 30, 2011, consisted of the following:
• |
For the three months ended September 30, 2012, compensation and related benefits increased by $9,488 or 22.3% as compared to the three months ended September 30, 2011. For the nine months ended September 30, 2012, compensation and related benefits increased by $27,856 or 22.4% as compared to the nine months ended September 30, 2011. These increases were primarily attributable to an increase in salaries paid to our management and other administrative staff resulting from the expansion of our business. |
• |
For the three months ended September 30, 2012, depreciation increased by $10,481 or 27.5% as compared to the three months ended September 30, 2011. For the nine months ended September 30, 2012, depreciation increased by $27,288 or 24.7% as compared to the nine months ended September 30, 2011. These increases were primarily attributable to an increase in depreciable assets. Since later part of 2011, we purchased more fixed assets as a result of the expansion of our business. As such, we had more depreciable assets during the three and nine months ended September 30, 2012 as compared to the corresponding periods in 2011. |
37
• |
For the three months ended September 30, 2012, travel and entertainment increased by $2,514 or 9.9% as compared to the three months ended September 30, 2011. The increase was due to more travel activities incurred during the three months ended September 30, 2012. For the nine months ended September 30, 2012, travel and entertainment decreased by $8,893 or 11.5% as compared to the nine months ended September 30, 2011. These decreases were primarily attributable to less travel and entertainment activities incurred during the first nine months of 2012 as compared to the same period in 2011. |
• |
Professional fees consisted primarily of legal, accounting and other fees associated with preparing to and becoming a reporting company in the United States. For the three months ended September 30, 2012, professional fees increased by $29,700 or 43.2%, as compared to the three months ended September 30, 2011. For the nine months ended September 30, 2012, professional fees increased by $55,726 or 43.6%, as compared to the nine months ended September 30, 2011. This increase was primarily attributable to the increase in legal and accounting fees as a result of our becoming a reporting company in the United States in 2012. |
• |
For the three months ended September 30, 2012, other general and administrative expense decreased by $17,130 or 37.0%, as compared to the three months ended September 30, 2011. The decrease was primarily due to less office and communication expenses incurred during the three months ended September 30, 2012 as a result of our cost cutting effort. For the nine months ended September 30, 2012, other general and administrative expense remained materially consistent. |
Income from Operations
For the three months ended September
30, 2012, income from operations was $879,431 as compared to $714,759 for the three months ended September 30, 2011, an increase of $164,672 or 23.0%.
For the nine months ended September 30, 2012, income from operations was $3,358,415 as compared to $2,851,463 for the nine months ended September 30,
2011, an increase of $506,952 or 17.8%. These increases were primarily due to higher overall gross margins and a decrease in selling expenses incurred
and offset by the increase in general and administrative expenses.
Other Income (Expenses)
For the three months ended September
30, 2012, total other income amounted to $228 as compared to total other expenses of $2,454 for the three months ended September 30, 2011. For the nine
months ended September 30, 2012, total other income amounted to $1,455 as compared to total other expenses of $13,126 for the nine months ended
September 30, 2011. The change in total other income (expenses) was primarily attributable to the following:
• |
For the three months ended September 30, 2012, interest income amounted to $474 as compared to interest income of $263 for the three months ended September 30, 2011. For the nine months ended September 30, 2012, interest income amounted to $2,062 as compared to interest income of $1,712 for the nine months ended September 30, 2011. These increases were the result of more money being deposited in interest-bearing accounts. |
• |
For the three months ended September 30, 2012, other expense amounted to $246 as compared to other expense of $2,717 for the three months ended September 30, 2011. For the nine months ended September 30, 2012, other expense amounted to $607 as compared to other expense of $14,838 for the nine months ended September 30, 2011. The decrease was a result of better costs control related to non-operational expenses. |
Net Income
As a result of the factors described
above, our net income was $879,659 or $0.02 per share (basic and diluted), for the three months ended September 30, 2012, as compared to $712,305 or
$0.02 per share (basic) and $0.01 per share (diluted), for the three months ended September 30, 2011. Our net income was $3,359,870 or $0.07 per share
(basic and diluted), for the nine months ended September 30, 2012, as
38
compared to $2,838,337 or $0.07 per share (basic) and $0.06 per share (diluted), for the nine months ended September 30, 2011.
Foreign Currency Translation Adjustment
For the three months ended September
30, 2012, we reported an unrealized loss on foreign currency translation of $59,359, as compared to unrealized gain of $158,519 for the three months
ended September 30, 2011. For the nine months ended September 30, 2012, we reported an unrealized gain on foreign currency translation of $108,308, as
compared to $582,653 for the nine months ended September 30, 2011. The change reflects the effect of the value of the U.S. dollar in relation to the
RMB. These gains (loss) are non-cash items. As described elsewhere herein, the functional currency of our subsidiary, JSJ, and our VIE, HDS, is the
RMB. The accompanying consolidated financial statements have been translated and presented in U.S. dollars using period end rates of exchange for
assets and liabilities, and average rates of exchange for the period for net revenues, costs, and expenses. Net gains resulting from foreign exchange
transactions, if any, are included in the consolidated statements of income.
Comprehensive Income
For the three months ended September
30, 2012, comprehensive income of $820,300 was derived from our net income of $879,659, partially offset by a foreign currency translation loss of
$59,359. For the three months ended September 30, 2011, comprehensive income of $870,824 was derived from the sum of our net income of $712,305 plus a
foreign currency translation gain of $158,519.
For the nine months ended September 30,
2012, comprehensive income of $3,468,178 was derived from the sum of our net income of $3,359,870 plus a foreign currency translation gain of $108,308.
For the nine months ended September 30, 2011, comprehensive income of $3,420,990 was derived from the sum of our net income of $2,838,337 plus a
foreign currency translation gain of $582,653.
Segment Operations
For the three and nine months ended
September 30, 2012 and 2011, we operated in three reportable business segments: (1) the TCM raw materials segment, consisting of the production and
sale of yew raw materials used in the manufacture of TCM; (2) the yew tree segment, consisting of the growth and sale of yew tree seedlings and mature
trees, including potted miniature yew trees; and (3) the handicrafts segment, consisting of the manufacture and sale of furniture and handicrafts made
of yew timber. Our reportable segments are strategic business units that offer different products. They are managed separately based on the fundamental
differences in their operations. All of our operations are conducted in the PRC.
Information with respect to these
reportable business segments for the three months ended September 30, 2012 and 2011 was as follows:
Three months ended September 30,
2012:
| TCM raw materials |
Yew trees |
Handicrafts |
Total |
|||||||||||||||
|---|---|---|---|---|---|---|---|---|---|---|---|---|---|---|---|---|---|---|
Revenues
|
$ | 451,442 | $ | 396,416 | $ | 82,699 | $ | 930,557 | ||||||||||
Revenues
— related parties |
442,467 | — | — | 442,467 | ||||||||||||||
Total
revenues |
893,909 | 393,416 | 82,699 | 1,373,024 | ||||||||||||||
Cost of
revenues |
73,826 | 21,395 | 51,188 | 146,409 | ||||||||||||||
Cost of
revenues — related parties |
84,528 | — | — | 84,528 | ||||||||||||||
Total cost of
revenues |
$ | 158,354 | $ | 21,395 | $ | 51,188 | $ | 230,937 | ||||||||||
39
Three months ended September 30,
2011:
| TCM raw materials |
Yew trees |
Handicrafts |
Total |
|||||||||||||||
|---|---|---|---|---|---|---|---|---|---|---|---|---|---|---|---|---|---|---|
Revenues
|
$ | 607,621 | $ | 322,015 | $ | 24,486 | $ | 954,122 | ||||||||||
Revenues
— related parties |
251,876 | — | — | 251,876 | ||||||||||||||
Total
revenues |
859,497 | 322,015 | 24,486 | 1,205,998 | ||||||||||||||
Cost of
revenues |
120,217 | 88,380 | 11,524 | 220,121 | ||||||||||||||
Cost of
revenues — related parties |
41,009 | — | — | 41,009 | ||||||||||||||
Total cost of
revenues |
$ | 161,226 | $ | 88,380 | $ | 11,524 | $ | 261,130 | ||||||||||
Information with respect to these
reportable business segments for the nine months ended September 30, 2012 and 2011 is as follows:
Nine months ended September 30,
2012:
| TCM raw materials |
Yew trees |
Handicrafts |
Total |
|||||||||||||||
|---|---|---|---|---|---|---|---|---|---|---|---|---|---|---|---|---|---|---|
Revenues
|
$ | 2,259,996 | $ | 1,853,504 | $ | 117,131 | $ | 4,230,631 | ||||||||||
Revenues
— related parties |
600,556 | — | 1,603 | 602,159 | ||||||||||||||
Total
revenues |
2,860,552 | 1,853,504 | 118,734 | 4,832,790 | ||||||||||||||
Cost of
revenues |
337,549 | 320,410 | 68,998 | 726,957 | ||||||||||||||
Cost of
revenues — related parties |
108,887 | — | 865 | 109,752 | ||||||||||||||
Total cost of
revenues |
$ | 446,436 | $ | 320,410 | $ | 69,863 | $ | 836,709 | ||||||||||
Nine months ended September 30,
2011:
| TCM raw materials |
Yew trees |
Handicrafts |
Total |
|||||||||||||||
|---|---|---|---|---|---|---|---|---|---|---|---|---|---|---|---|---|---|---|
Revenues
|
$ | 1,489,546 | $ | 1,665,665 | $ | 91,391 | $ | 3,246,602 | ||||||||||
Revenues
— related parties |
1,169,688 | — | — | 1,169,688 | ||||||||||||||
Total
revenues |
2,659,234 | 1,665,665 | 91,391 | 4,416,290 | ||||||||||||||
Cost of
revenues |
343,839 | 287,681 | 60,068 | 691,588 | ||||||||||||||
Cost of
revenues — related parties |
297,004 | — | — | 297,004 | ||||||||||||||
Total cost of
revenues |
$ | 640,843 | $ | 287,681 | $ | 60,068 | $ | 988,592 | ||||||||||
TCM raw materials
In February 2010, we began selling yew
branches and leaves that are used in the production of TCM. On January 9, 2010, we entered into a Cooperation and Development Agreement dated January
9, 2010, or the Development Agreement, with Yew Pharmaceutical, a related party, for the development, production and sale of yew-based TCM. Pursuant to
the Development Agreement, we sell yew branches and leaves to Yew Pharmaceutical. Yew Pharmaceutical manufactures TCM at its own facilities in Harbin
in accordance with the requirements of HFDA. Yew Pharmaceutical is also responsible for producing the finished product in accordance with the
requirements of good manufacturing practices, or GMP. In this regard, Yew Pharmaceutical received a GMP certificate in November 2009, and has filed all
applications with, and obtained all approvals from, the HFDA.
During the three months ended September
30, 2012, we sold 5,400 kg of TCM raw materials as compared to 5,160 kg of TCM raw materials during the three months ended September 30, 2011, a 4.7%
increase in sales volume due to increased sales efforts and customer demand, while the average unit selling price remained constant. We sold TCM raw
materials to Yew Pharmaceutical at a fixed price of RMB 1,000,000 (approximately $158,000) per metric ton pursuant to the Development Agreement, and we
sold TCM raw materials to other customers at a price of RMB 1,100,000 (approximately $174,000) per metric ton.
40
During the nine months ended September
30, 2012, we sold 16,800 kg of TCM raw materials as compared to 16,420 kg of TCM raw materials during the nine months ended September 30, 2011, a 2.3%
increase in sales volume due to increased sales efforts and customer demand, with a 5.1% increase in our average unit selling price. The increase in
our average unit selling price was attributable to the increase in the percentage of total TCM raw materials sales made to our third party customers.
We sold TCM raw materials to Yew Pharmaceutical at a fixed price of RMB 1,000,000 (approximately $158,000) per metric ton pursuant to the Development
Agreement, and we sold TCM raw materials to other customers at a price of RMB 1,100,000 (approximately $174,000) per metric ton.
For the three months ended September
30, 2012 and 2011, we had revenue of $442,467 and $251,876, respectively, from the sale of TCM raw materials to Yew Pharmaceutical pursuant to the
Development Agreement. As Yew Pharmaceutical did not make TCM raw materials purchases from us during the second quarter of 2012, it made more purchases
in the three months ended September 30, 2012 in order to meet its production needs. For the three months ended September 30, 2012 and 2011, revenue
from the sale of TCM raw materials to third parties amounted to $451,442 and $607,621, respectively, as we had less third-party customer demand and
seasonal limitations on the sale of TCM raw materials as a result of the growth rate of yew trees available for cutting branches and
leaves.
Sales of yew raw materials to a related
party customer, Yew Pharmaceutical, decreased during the first two quarters of 2012 because Yew Pharmaceutical had adequate inventory for its needs and
as we focused our attention on expanding such sales to third party customers. During the third quarter of 2012, sales of yew raw materials to Yew
Pharmaceutical increased because Yew Pharmaceutical required more yew raw material as its own inventory decreased, while sales of yew raw material to
third party customers decreased because such customers now had adequate inventory. Accordingly, our revenue generated from the related party revenue
increased and our revenue generated from the third party customers decreased during the third quarter of 2012.
For the nine months ended September 30,
2012 and 2011, pursuant to the Development Agreement, we had revenue of $600,556 and $1,169,688, respectively, from the sale of TCM raw materials to
Yew Pharmaceutical. For the nine months ended September 30, 2012 and 2011, revenue from the sale of TCM raw materials to third parties amounted to
$2,259,996 and $1,489,546, respectively, as we actively developed more sales to third party customers during 2012. Over the nine months ended September
30, 2012, the overall mix of sales of our yew raw materials consisted primarily of sales to third party customers compared to sales to the related
party customer.
Sales volume is summarized as
follows:
| Three Months Ended September 30, |
Nine Months Ended September 30, |
||||||||||||||||||
|---|---|---|---|---|---|---|---|---|---|---|---|---|---|---|---|---|---|---|---|
| 2012 |
2011 |
2012 |
2011 |
||||||||||||||||
Sales volume
— third parties (kg) |
2,600 | 3,560 | 13,000 | 8,810 | |||||||||||||||
Sales volume
— related party (kg) |
2,800 | 1,600 | 3,800 | 7,610 | |||||||||||||||
Total sales
volume |
5,400 | 5,160 | 16,800 | 16,420 | |||||||||||||||
Additionally, in order to ensure the
sustainability of our yew forests, we closely monitor the growth rate of our yew trees. The amount of TCM raw materials can be sold is limited by the
seasonal growth rate of our yew trees that are available for cutting branches and leaves. Over time, as more yew trees reach maturity, these limits may
be increased.
The decrease in our cost of revenues in
the TCM raw materials segment for the three and nine months ended September 30, 2012 as compared to the corresponding periods of 2011 was primarily
attributable to improved operational efficiencies in 2012. We have continued to find ways to improve our operational efficiencies and cost controls in
the TCM raw materials segment since we first started this segment’s operations in 2010. As a result, we were able to reduce the cost of revenues
as a percentage of our revenue.
41
Yew trees
During the three months ended September
30, 2012, we sold approximately 42,000 yew seedlings and trees as compared to approximately 51,000 yew seedlings and trees in the three months ended
September 30, 2011, a decrease in volume of 17.6%. For the three months ended September 30, 2012, demand for our yew trees decreased as our customers
did not have as many reforestation or landscaping projects as a result of the current slowdown in the Chinese economy. In addition, because the supply
of yew trees is relatively limited while our yew forests continue to grow and reach maturity, we have become more selective in selling to customers in
2012 who are capable of paying higher prices for yew trees, thereby generating greater profit margins for us, while maintaining the sustainability of
our yew trees inventory for our future revenue growth. We sold more yew trees in the potted miniature trees form as a percentage of our yew tree
revenues. Potted miniature trees are higher priced than yew seedlings and customers generally purchase potted miniature trees in smaller quantities. As
a result, we saw an increase in the average unit selling price of yew trees of 49.8% for the third quarter of 2012 as compared to the third quarter of
2011. The increase in our average unit selling price for yew trees was primarily attributable to the different sales revenue mix with varying unit
selling prices.
During the nine months ended September
30, 2012, we sold approximately 227,000 yew seedlings and trees as compared to approximately 349,000 yew seedlings and trees in the nine months ended
September 30, 2011, a decrease in volume of 35.0%. During the nine months ended September 30, 2012, demand for our yew seedling products decreased as
our customers did not have as many forestation or landscaping projects as a result of the current slowdown in the Chinese economy. Additionally, we
sold more yew trees in the potted miniature trees form. Potted miniature trees are generally more mature and higher priced than yew seedlings and
customers generally purchase potted miniature trees in smaller quantities. As such, the sales volume decreased in the nine months ended September 30,
2012 as compared to the nine months ended September 30, 2011. However, we saw an increase in the average unit selling price of yew trees of 71.3% for
the nine months ended September 30, 2012 as compared to the nine months ended September 30, 2011. The increase in our average unit selling price for
yew trees was primarily attributable to the different sales revenue mix with varying unit selling price. The selling price of yew trees is dependent on
the age, size and variety of the seedling or tree. For example, smaller, less developed yew seedlings or trees sell for less than more mature seedlings
or trees. We sold more matured and larger yew seedlings as a percentage of total yew trees sales during the three and nine months ended September 30,
2012 as compared to the three and nine months ended September 30, 2011.
The decrease in our cost of revenues in
the yew tree segment for the three months ended September 30, 2012 as compared to the comparable period of 2011 was because we sold less yew trees and
the percentage of younger trees sold was higher for the three months ended September 30, 2012. The increase in our cost of revenues in the yew trees
segment for the nine months ended September 30, 2012 as compared to the comparable period of 2011 was attributable to the increased cost of cultivating
yew trees in 2012 and overall more mature yew trees with higher costs being sold in 2012. We sold approximately 42,000 and 227,000 yew seedlings and
trees in the three and nine months ended September 30, 2012, respectively, as compared to approximately 51,000 and 349,000 yew seedlings and trees in
the three and nine months ended September 30, 2011, respectively. The average cost per yew tree was approximately $0.51 and $1.41 in the three and nine
months ended September 30, 2012, respectively, as compared to $1.73 and $0.82 per yew tree in the three and nine months ended September 30, 2011,
respectively.
In connection with our entering into a
land use agreement on July 18, 2012, or Fuye Field Agreement, we acquired more than 80,000 trees — which are not yew trees — located on that
property. These trees consist of approximately 20,000 larix, 56,700 spruce and 3,700 poplar trees. Larix trees are used primarily in landscaping and we
currently anticipate that we will begin selling larix trees to customers during 2013. Spruce and poplar trees are used primarily as building materials
and we currently anticipate that we will begin selling these trees to customers in later periods, when these trees reach maturity in several
years.
42
Handicrafts
During the three months ended September
30, 2012 and 2011, revenue from the sale of handicrafts made from yew timber amounted to $82,699 and $24,486, respectively, an increase of $58,213 or
237.7%. During the nine months ended September 30, 2012 and 2011, revenue from the sale of handicrafts made from yew timber amounted to $118,734 and
$91,391, including sales to a related party of $1,603 and $0, respectively, an increase of $27,343 or 29.9%. We sold more yew handicrafts, including
furniture, during the three and nine months ended September 30, 2012 as compared to the comparable period in 2011. We increased our sales effort in
promoting our high-priced yew handicrafts in the third quarter of 2012.
In August 2012, we began to more
actively market our handicraft products. Specific steps taken to market our handicraft products include:
• |
We will begin to engage first tier distributors to distributor our handicraft products in provincial capital cities in 10 provinces; each first tier distributor is required to reach minimal annual sales volume of 2,000,000 RMB. First tier distributors will be able to purchase handicrafts from us at a price below the price that basic distributors pay for the handicraft products. In addition to the discounted first tier distributor pricing provided, we will also provide approximately 3%-5% commission (payable in yew seedling products) to these first tier distributors. |
• |
We will engage second tier distributors in smaller cities. Each second tier distributor is required to reach minimal annual sales volume of 1,000,000 RMB. These distributors will also be offered beneficial pricing off the price that basic distributors pay. We will also provide approximately 2%-3% commission (payable in yew seedling products) to the second tier distributors. |
• |
We have instructed our sales representative to make frequent visits to our distributors to promote our handicraft products. |
The increase in our cost of revenues in
the handicrafts segments for the three and nine months ended September 30, 2012 as compared to the corresponding periods of 2011 was due to increased
costs incurred in connection with increased sales of handicrafts and a different product mix sold.
YEAR ENDED DECEMBER 31, 2011 COMPARED TO YEAR ENDED
DECEMBER 31, 2010
Revenues
For the year ended December 31, 2011
(“fiscal 2011”), we had total revenues of $5,961,039, as compared to $5,128,052 for the year ended December 31, 2010 (“fiscal
2010”), an increase of $832,987 or 16.2%. In fiscal 2011, the increase in total revenue was attributable to the increase in revenue from our TCM
raw material segment for which we began to produce and sell in June 2010 and the increase in revenue from the sale of yew trees, offset by the decrease
in revenue from the sale of handicrafts, and is summarized as follows:
| Fiscal 2011 |
Fiscal 2010 |
Increase (Decrease) |
Percentage Change |
|||||||||||||||
|---|---|---|---|---|---|---|---|---|---|---|---|---|---|---|---|---|---|---|
TCM raw
materials |
$ | 3,458,093 | $ | 2,845,067 | $ | 613,026 | 21.5 | % | ||||||||||
Yew trees
|
2,400,245 | 2,131,445 | 268,800 | 12.6 | % | |||||||||||||
Handicrafts
|
102,701 | 151,540 | (48,839 | ) | (32.2 | )% | ||||||||||||
Total
|
$ | 5,961,039 | $ | 5,128,052 | $ | 832,987 | 16.2 | % | ||||||||||
TCM raw materials
During fiscal 2011, we sold 21,170
kilogram of TCM raw materials as compared to 18,350 kilogram of TCM raw materials during fiscal 2010, a 15.4% increase in sales volume with minimal
change in our average unit selling price. The increase in sales volume was primarily attributable to increased sales efforts and customer demand in
fiscal 2011.
In February 2010, we began selling yew
branches and leaves that are used in the production of TCM. On January 9, 2010, we entered into the Development Agreement with Yew Pharmaceutical, a
related party, for
43
the development, production and sale of yew-based TCM. Pursuant to the Development Agreement, we sell yew branches and leaves to Yew Pharmaceutical. Yew Pharmaceutical manufactures TCM at its own facilities in Harbin in accordance with the requirements of HFDA. Yew Pharmaceutical is also responsible for producing the finished product in accordance with the GMP requirements. In this regard, Yew Pharmaceutical received a GMP certificate in November 2009, and has filed all applications with, and obtained all approvals from, the HFDA. In fiscal 2011 and fiscal 2010, pursuant to the Development Agreement, we had revenue of $1,391,826 and $1,326,203, respectively, from the sale of TCM raw materials to Yew Pharmaceutical. Additionally, in fiscal 2011 and fiscal 2010, revenue from the sale of TCM raw materials to third parties amounted to $2,066,267 and $1,518,864, respectively. Sales volume is summarized as follows:
| Years Ended December 31, |
|||||||||||
|---|---|---|---|---|---|---|---|---|---|---|---|
| 2011 |
2010 |
||||||||||
Sales volume
— third parties (kg) |
12,160 | 9,360 | |||||||||
Sales volume
— related party (kg) |
9,010 | 8,990 | |||||||||
Total sales
volume |
21,170 | 18,350 | |||||||||
Yew trees
During fiscal 2011, we sold
approximately 383,000 pieces of yew seedlings and trees as compared to approximately 953,000 pieces of yew seedlings and trees in fiscal 2010, a
decrease in volume of 59.8%. The majority of the decrease in sales volume was due to an approximately 647,000 decrease in units sold for our least
mature 2009 seedling product. However, we experienced an increase in the average unit selling price of yew trees of 167.4% for fiscal 2011 as compared
to fiscal 2010. The increase in our average unit selling price for yew trees was primarily attributable to the different sales revenue mix with varying
unit selling price. The selling price of yew trees is dependent on the age, size and variety of the seedling or tree. For example, smaller, less
developed yew seedlings or trees sell for less than more mature seedlings or trees. As we had more mature seedlings and trees sold in 2011, the average
unit selling price increased in 2011 accordingly.
Handicrafts
During fiscal 2011 and 2010, revenue
from the sale of handicrafts made from yew timber amounted to $102,701 and $151,540, including sales to a related party of $4,787 and $12,668,
respectively, a decrease of $48,839 or 32.2%.
The decrease in revenue from the sale
of handicrafts was primarily attributable to the downturn in antique furniture and handicrafts market reflecting the overall impact of international
economy environment, especially for higher priced items such as desks and high-end furniture, and our lack of marketing efforts. In August 2012, we
began to increase our marketing efforts in this operating segment.
Cost of Revenues
For fiscal 2011, cost of revenues
amounted to $1,125,965 as compared to $1,638,063 for fiscal 2010, a decrease of $512,098 or 31.3%. Our cost of revenues principally consists of the
cost of raw materials such as wood plates and yews, amortization of land and yew forest use rights, labor, utilities, manufacturing costs,
manufacturing related depreciation, machinery maintenance costs, purchasing and receiving costs, inspection costs, and other fixed costs. For fiscal
2011, cost of revenues accounted for 18.9% of total revenues compared to 31.9% of total revenues for fiscal 2010.
Cost of revenues by product categories
were as follows:
| 2011 |
2010 |
Decrease |
Percentage Change |
|||||||||||||||
|---|---|---|---|---|---|---|---|---|---|---|---|---|---|---|---|---|---|---|
TCM raw
materials |
$ | 897,154 | $ | 924,547 | $ | (27,393 | ) | (3.0 | )% | |||||||||
Yew trees
|
172,460 | 633,027 | (460,567 | ) | (72.8 | )% | ||||||||||||
Handicrafts
|
56,351 | 80,489 | (24,138 | ) | (30.0 | )% | ||||||||||||
Total
|
$ | 1,125,965 | $ | 1,638,063 | $ | (512,098 | ) | (31.3 | )% | |||||||||
44
The decrease in our cost of revenues in
the TCM raw material segment in fiscal 2011 as compared to fiscal 2010 was primarily attributable to improved operational efficiencies in fiscal
2011.
The decrease in our cost of revenues in
the Yew trees segments in fiscal 2011 as compared to fiscal 2010 was attributable to the less number of yew trees sold in 2011 and the cost of
cultivating yew trees being less in 2011. We sold approximately 383,000 pieces of yew seedlings and trees as compared to approximately 953,000 pieces
of yew seedlings and trees in fiscal 2010. The average cost per yew tree was approximately $0.45 in 2011 as compared to $0.66 per yew tree in 2010. As
a result of improved operational efficiencies, we were able to reduce our cost per yew tree in 2011.
The decrease in our cost of revenues in
the Handicrafts segments in fiscal 2011 as compared to fiscal 210 was due to the decrease in revenue generated from the sale of
handicrafts.
Gross Profit
For fiscal 2011, gross profit was
$4,835,074 as compared to $3,489,989 for fiscal 2010, representing gross margins of 81.1% and 68.1%, respectively. Gross profit margins by product
categories were as follows:
| 2011 |
2010 |
Increase (Decrease) |
||||||||||||
|---|---|---|---|---|---|---|---|---|---|---|---|---|---|---|
TCM raw
materials |
74.1 | % | 67.5 | % | 6.6 | % | ||||||||
Yew trees
|
92.8 | % | 70.3 | % | 22.5 | % | ||||||||
Handicrafts
|
45.1 | % | 46.9 | % | (1.8 | )% | ||||||||
Total
|
81.1 | % | 68.1 | % | 13.0 | % | ||||||||
The increase in our gross margin
percentage related to the sale of TCM raw materials was primarily attributable operational efficiencies from the increase in our production in fiscal
2011 as compared to fiscal 2010.
The increase in our gross margin
percentage related to the sale of yew trees for fiscal 2011 as compared to fiscal 2010 was because we had more mature yew seedlings and trees sold in
2011 and we had higher profit margin on those more mature yew tree products. As a result, we saw an increase in our average unit selling price and
higher overall gross margin in our yew tree segment.
The decrease in our gross margin
percentage related to the sale of handicrafts for fiscal 2011 as compared to fiscal 2010 was mainly due to the different sales revenue mix with
different gross profit margin. During fiscal 2011, we sold more handicrafts with lower profit margin, which contributed to the decrease in gross profit
margin.
Selling Expenses
| Year Ended December 31, |
|||||||||||
|---|---|---|---|---|---|---|---|---|---|---|---|
| 2011 |
2010 |
||||||||||
Salary and
related benefit |
$ | 12,865 | $ | 2,672 | |||||||
Advertising
|
8,604 | 2,571 | |||||||||
Shipping and
handling |
16,166 | 11,316 | |||||||||
Other
|
16,958 | 13,858 | |||||||||
Total
|
$ | 54,593 | $ | 30,417 | |||||||
For fiscal 2011, selling expenses were
$54,593 as compared to $30,417 for fiscal 2010, an increase of $24,176 or 79.5%. Selling expenses consisted of the following:
• |
For fiscal 2011, salary and related benefit increase by $10,193 which was primarily attributable to an increase in salaries paid to our sales staff due to the expansion in our sales team. |
• |
For fiscal 2011, advertising expenses increase by $6,033 in order to enhance our visibility. |
45
• |
For fiscal 2011, shipping and handling expenses increased by $4,850 due to the increase in our revenue and sales activities. |
• |
For fiscal 2011, other expenses increased by $3100 primarily due to the increase in travel and entertainment expenses. |
General and Administrative Expenses
| Year Ended December 31, |
|||||||||||
|---|---|---|---|---|---|---|---|---|---|---|---|
| 2011 |
2010 |
||||||||||
Compensation
and related benefits |
$ | 173,571 | $ | 76,584 | |||||||
Depreciation
|
154,266 | 133,861 | |||||||||
Travel and
entertainment |
86,408 | 80,679 | |||||||||
Professional
fees |
195,044 | 453,642 | |||||||||
Research and
development |
16,048 | 24,404 | |||||||||
Other
|
108,478 | 109,709 | |||||||||
Total
|
$ | 733,815 | $ | 878,879 | |||||||
For fiscal 2011, general and
administrative expenses amounted to $733,815 as compared to $878,879 for fiscal 2010, a decrease of $145,064 or 16.5%. General and administrative
expenses consisted of the following:
• |
For fiscal 2011, compensation and related benefits increased by $96,987 or 126.6%. The increase was primarily attributable to the increase in salaries paid to our management resulting from the expansion of our business in China. Additionally, during fiscal 2011 we hired our chief financial officer and other administrative staffs in connection with becoming a public company. |
• |
For fiscal 2011, depreciation increased by $20,405 or 15.2%. The increase was mainly attributable to an increase in depreciable assets. |
• |
Professional fees consisted of legal, accounting and other fees associated with preparing to be a public company. For fiscal 2011, professional fees decreased by $258,598 or 57.0% as compared to fiscal 2010. The decrease was primarily attributable to a decrease in legal fees of approximately $89,000, a decrease in accounting fees of approximately $93,000 and a decrease in consulting fees of approximately $77,000 related to our efforts to prepare to become a publicly listed company in the United States. |
• |
For fiscal 2011, research and development expenses decreased by $8,356 or 34.2%. The decrease was because we had less research and development activities incurred. |
• |
Travel and entertainment and other expenses remained materially consistent in fiscal 2011 as compared to fiscal 2010. |
Income from Operations
For fiscal 2011, income from operations
was $4,046,666 as compared to $2,580,693 for fiscal 2010, an increase of $1,465,973 or 56.8%.
Other Income (Expenses)
For fiscal 2011, total other expenses
amounted to $6,355 as compared to total other income of $5,267 for fiscal 2010. The change in total other (expenses) income was primarily attributable
to a loss on fixed asset disposals of $8,998 during fiscal 2011.
Net Income
As a result of the factors described
above, our net income was $4,040,311, or $0.10 per basic share and $0.08 per diluted share for fiscal 2011, as compared to $2,585,960, or $0.06 per
basic share and $0.05 per diluted share for fiscal 2010.
46
Foreign Currency Translation Adjustment
For fiscal 2011, we reported an
unrealized gain on foreign currency translation of $778,392 as compared to $463,826 for fiscal 2010. The change reflects the effect of the value of the
U.S. dollar in relation to RMB. These gains are non-cash items. As described elsewhere herein, the functional currency of our operating subsidiary,
JSJ, and our VIE, HDS, is the RMB. The accompanying consolidated financial statements have been translated and presented in U.S. dollars using period
end rates of exchange for assets and liabilities, and average rates of exchange for the period for net revenues, costs, and expenses. Net gains
resulting from foreign exchange transactions, if any, are included in the consolidated statements of income.
Comprehensive Income
For fiscal 2011, comprehensive income
of $4,818,703 was derived from the sum of our net income of $4,040,311 plus a foreign currency translation gain of $778,392. For fiscal 2010,
comprehensive income of $3,049,786 was derived from the sum of our net income of $2,585,960 plus a foreign currency translation gain of
$463,826.
Segment Operations
For the years ended December 31, 2011
and 2010, we operated in three reportable business segments: (1) the sale of yew raw materials for the production of TCM; (2) yew trees; and (3)
handicrafts. Our reportable segments are strategic business units that offer different products. They are managed separately based on the fundamental
differences in their operations. All of our operations are conducted in the PRC.
Information with respect to these
reportable business segments for the years ended December 31, 2011 and 2010 is as follows:
Year Ended December 31, 2011
| TCM raw materials |
Yew trees |
Handicrafts |
Total |
|||||||||||||||
|---|---|---|---|---|---|---|---|---|---|---|---|---|---|---|---|---|---|---|
Revenues
|
$ | 2,066,267 | $ | 2,400,245 | $ | 97,914 | $ | 4,564,426 | ||||||||||
Revenues
— related parties |
1,391,826 | — | 4,787 | 1,396,613 | ||||||||||||||
Total Revenue
|
3,458,093 | 2,400,245 | 102,701 | 5,961,039 | ||||||||||||||
Cost of sales
|
515,323 | 172,460 | 53,724 | 741,508 | ||||||||||||||
Cost of sales
— related parties |
381,831 | — | 2,627 | 384,457 | ||||||||||||||
Total Cost of
sales |
897,154 | 172,460 | 56,351 | 1,125,965 | ||||||||||||||
Year Ended December 31, 2010
| TCM raw materials |
Yew trees |
Handicrafts |
Total |
|||||||||||||||
|---|---|---|---|---|---|---|---|---|---|---|---|---|---|---|---|---|---|---|
Revenues
|
$ | 1,518,864 | $ | 2,131,445 | $ | 138,872 | $ | 3,789,181 | ||||||||||
Revenues
— related parties |
1,326,203 | — | 12,668 | 1,338,871 | ||||||||||||||
Total Revenue
|
2,845,067 | 2,131,445 | 151,540 | 5,128,052 | ||||||||||||||
Cost of sales
|
471,595 | 633,027 | 73,761 | 1,178,383 | ||||||||||||||
Cost of sales
— related parties |
452,952 | — | 6,728 | 459,680 | ||||||||||||||
Total Cost of
sales |
924,547 | 633,027 | 80,489 | 1,638,063 | ||||||||||||||
Liquidity and Capital Resources
Liquidity is the ability of a company
to generate funds to support its current and future operations, satisfy its obligations and otherwise operate on an ongoing basis. At September 30,
2012 and December 31, 2011, we had cash balances of $567,798 and $732,371, respectively. These funds are primarily located in various financial
institutions located in China. Our primary uses of cash have been for the purchase of yew trees, land
47
use rights and yew forest assets. Additionally, we use cash for employee compensation, and for working capital.
In July 2012, we entered into the Fuye
Field Agreement to acquire a land use right in the amount of approximately $2.4 million, payable in installments. We lease 117.5 mu (approximately 19.6
acres) located at Fuye Field, Beizhao Village, Hongxing Town, A’cheng District in Helongjiang Province, PRC. The term of the Fuye Field Agreement
is 16 years, through March 2028. During the term of the Fuye Field Agreement, we have the right to develop the property for the production of yew
trees. In addition, we acquired a building and more than 80,000 trees — which are not yew trees — located on the property. In connection with
the Fuye Field Agreement, we paid approximately $1.5 million as of September 30, 2012 and there is an amount payable related to the Fuye Field
Agreement of approximately $0.9 million as of September 30, 2012 which was included in accounts payable on the accompanying consolidated balance
sheets. We presently expect to be able to make the additional payments required by the Fuye Field Agreement from cash-on-hand and net cash flow from
operations.
Nine months Ended September 30, 2012 and
2011
The following table sets forth
information as to the principal changes in the components of our working capital from December 31, 2011 to September 30, 2012:
| December 31, 2011 to September 30, 2012 |
|||||||||||||||||||
|---|---|---|---|---|---|---|---|---|---|---|---|---|---|---|---|---|---|---|---|
| Category |
September 30, 2012 |
December 31, 2011 |
Change |
Percentage change |
|||||||||||||||
Current
assets: |
|||||||||||||||||||
Cash
|
$ | 567,798 | $ | 732,371 | $ | (164,573 | ) | (22.5 | )% | ||||||||||
Accounts
receivable |
530,471 | — | 530,471 | 100.0 | % | ||||||||||||||
Inventories
|
899,783 | 710,844 | 188,939 | 26.6 | % | ||||||||||||||
Prepaid rent
— related party |
67,292 | — | 67,292 | 100.0 | % | ||||||||||||||
Prepaid
expenses and other assets |
14,245 | 433 | 13,812 | 3,189.8 | % | ||||||||||||||
Current
liabilities: |
|||||||||||||||||||
Accounts
payable |
915,792 | 1,360,611 | (444,819 | ) | (32.7 | )% | |||||||||||||
Accrued
expenses and other payables |
49,939 | 119,901 | (69,962 | ) | (58.3 | )% | |||||||||||||
Taxes payable
|
11,303 | 500 | 10,803 | 2,160.6 | % | ||||||||||||||
Refundable
common stock subscription |
— | 950,000 | (950,000 | ) | (100.0 | )% | |||||||||||||
Due to
related parties |
56,098 | 266,488 | (210,390 | ) | (78.9 | )% | |||||||||||||
Working
capital: |
|||||||||||||||||||
Total current
assets |
$ | 2,079,589 | $ | 1,443,648 | $ | 635,941 | 44.1 | % | |||||||||||
Total current
liabilities |
1,033,132 | 2,697,500 | (1,664,368 | ) | (61.7 | )% | |||||||||||||
Working
capital (deficiency) |
$ | 1,046,457 | $ | (1,253,852 | ) | $ | 2,300,309 | (183.5 | )% | ||||||||||
Our working capital increased
$2,300,309 to $1,046,457 at September 30, 2012, from a working capital deficiency of $(1,253,852) at December 31, 2011. This increase in working
capital is primarily attributable to:
• |
An increase in accounts receivable of approximately $530,000; |
• |
An increase in inventories of approximately $189,000; |
• |
An increase in prepaid rent — related parties of approximately $67,000; |
• |
An increase in prepaid expenses and other assets of approximately $14,000; |
• |
A decrease in accounts payable of approximately $445,000; |
• |
A decrease in accrued expenses and other payables of approximately $70,000; |
• |
A decrease in refundable common stock subscription of approximately $950,000; |
• |
A decrease in due to related parties of approximately $210,000; |
48
offset by:
• |
A decrease in cash of approximately $165,000; and |
• |
An increase in taxes payable of approximately $11,000. |
For the nine months ended September 30,
2012, net cash flow provided by operating activities was $345,813, as compared to net cash flow provided by operating activities of $4,368,029 for the
nine months ended September 30, 2011, a decrease of $4,022,216. Because the exchange rate conversion is different for the balance sheet and the
statements of cash flows, the changes in assets and liabilities reflected on the statements of cash flows is not necessarily identical with the
comparable changes reflected on the balance sheets.
For the nine months ended September 30,
2012, net cash flow provided by operating activities of $345,813 was primarily attributable to:
• |
net income of approximately $3,360,000 adjusted for the add-back of non-cash items, such as: depreciation of approximately $159,000, and amortization of land use rights and yew forest assets of approximately $259,000, and |
• |
the receipt of cash from operations from changes in operating assets and liabilities of approximately $34,000, |
partially offset by:
• |
the use of cash from changes in operating assets and liabilities, such as: an increase in accounts receivable of approximately $531,000, an increase in inventories of approximately $2,335,000 mainly due to the acquired trees from Fuye Field Agreement, an increase in prepaid rent — related parties of approximately $67,000, a decrease in accounts payable of approximately $452,000 and a decrease in accrued expenses and other payables of approximately $67,000. |
For the nine months ended September 30,
2011, net cash flow provided by operating activities of $4,368,029 was primarily attributable to:
• |
net income of approximately $2,838,000 adjusted for the add-back of non-cash items, such as depreciation of approximately $128,000, amortization of land use rights and yew forest assets of approximately $213,000, loss on disposal of fixed assets of approximately $10,000; and |
• |
the receipt of cash from operations from changes in operating assets and liabilities, such as: a decrease in inventories of approximately $859,000, an increase in accounts payable of approximately $502,000, |
• |
partially offset by the use of cash from changes in operating assets and liabilities, such as a decrease in advances from customers of approximately $174,000. |
Net cash flow used by investing
activities was approximately $274,000 for the nine months ended September 30, 2012, as compared to net cash flow used in investing activities of
approximately $5,608,000 for the nine months ended September 30, 2011. During the nine months ended September 30, 2012, we spent approximately $208,000
on purchase of property and equipment and spent approximately $66,000 on purchase of land use rights and yew forest assets. During the nine months
ended September 30, 2011, we spent approximately $134,000 on purchase of property and equipment and spent approximately $5,495,000 on purchase of land
use rights and yew forest assets, offset by proceeds from disposal of property and equipment of approximately $20,000.
Net cash flow used in financing
activities was approximately $239,000 for the nine months ended September 30, 2012, as compared to net cash flow provided by financing activities of
approximately $200,000 for the nine months ended September 30, 2011. During the nine months ended September 30, 2012, we made repayments to a related
party of approximately $239,000. During the nine months ended September 30, 2011, we received proceeds from related party advances of approximately
$137,000 and received proceeds from a director’s advances of approximately $63,000.
49
Years ended December 31, 2011 and
2010
The following table sets forth
information as to the principal changes in the components of our working capital from December 31, 2010 to December 31, 2011:
| December 31, 2010 to December 31, 2011 |
|||||||||||||||||||
|---|---|---|---|---|---|---|---|---|---|---|---|---|---|---|---|---|---|---|---|
| Category |
December 31, 2011 |
December 31, 2010 |
Change |
Percentage Change |
|||||||||||||||
Current
assets: |
|||||||||||||||||||
Cash
|
$ | 732,371 | $ | 1,850,488 | $ | (1,118,117 | ) | (60.4 | )% | ||||||||||
Due from
related parties |
— | 57,131 | (57,131 | ) | (100.0 | )% | |||||||||||||
Inventories
|
710,844 | 972,048 | (261,204 | ) | (26.9 | )% | |||||||||||||
Prepaid
expenses and other assets |
433 | 2,250 | (1,817 | ) | (80.8 | )% | |||||||||||||
Current
liabilities: |
|||||||||||||||||||
Accounts
payable |
1,360,611 | 1,810,092 | (449,481 | ) | (24.8 | )% | |||||||||||||
Advance from
customers |
— | 322,151 | (322,151 | ) | (100.0 | )% | |||||||||||||
Accrued
expenses and other payables |
119,901 | 55,604 | 64,297 | 115.6 | % | ||||||||||||||
Taxes payable
|
500 | 7,112 | (6,612 | ) | (93.0 | )% | |||||||||||||
Refundable
common stock subscription |
950,000 | 950,000 | — | — | |||||||||||||||
Due to
related parties |
266,488 | 141,276 | 125,212 | 88.6 | % | ||||||||||||||
Working
capital: |
|||||||||||||||||||
Total current
assets |
$ | 1,443,648 | $ | 2,881,917 | $ | (1,438,269 | ) | (50.91 | )% | ||||||||||
Total current
liabilities |
2,697,500 | 3,286,235 | (588,735 | ) | (17.9 | )% | |||||||||||||
Working
capital deficiency |
$ | (1,253,852 | ) | $ | (404,318 | ) | $ | (849,534 | ) | (210.1 | )% | ||||||||
Our working capital deficiency
increased by $436,242 to $(1,340,680) at December 31, 2011 from a working capital deficiency of $(404,318) at December 31, 2010. This increase in
working capital deficiency is primarily attributable to:
• |
A decrease in cash of approximately $1,118,000, |
• |
A decrease in inventories of approximately $347,962 |
• |
An increase in due to related parties of approximately $125,000, |
offset by:
• |
A decrease in accounts payable of approximately $449,000, and |
• |
A decrease in advances from customers of approximately $322,000. |
For fiscal 2011, net cash flow provided
by operating activities was $4,370,422 as compared to $7,777,324 for fiscal 2010, a decrease of $3,406,902. Because the exchange rate conversion is
different for the balance sheet and the statements of cash flows, the changes in assets and liabilities reflected on the statements of cash flows is
not necessarily identical with the comparable changes reflected on the balance sheets.
For fiscal 2011, net cash flow provided
by operating activities of $4,370,422 was primarily attributable to:
• |
net income of approximately $4,040,000 adjusted for the add-back of non-cash items, such as: depreciation of approximately $178,000, and amortization of land use rights and yew forest assets of approximately $293,000, and |
• |
the receipt of cash from operations from changes in operating assets and liabilities, such as: a decrease in inventories of approximately $606,000, a decrease in due from related parties of approximately $26,000, and an increase in accrued expenses and other payable of approximately $62,000, |
50
| offset primarily by: |
• |
the use of cash from changes in operating assets and liabilities, such as: a decrease in accounts payable of approximately $511,000 and a decrease in advances from customers of approximately $329,000. |
For fiscal 2010, net cash flow provided
by operating activities of $7,777,324 was primarily attributable to:
• |
net income of approximately $2,586,000 adjusted for the add-back of non-cash items, such as depreciation of approximately $158,000, amortization of land use rights and yew forest assets of approximately $48,000, stock-based compensation expense of $50,000, and |
• |
the receipt of cash from operations from changes in operating assets and liabilities, such as: a decrease in accounts receivable of approximately $2,354,000 related to the collection of outstanding accounts receivable balances, a decrease in advance to suppliers of approximately $633,000, an increase in accounts payable of approximately $1,737,000 and an increase in advances from customers of approximately $314,000. |
• |
offset by the use of cash from changes in operating assets and liabilities, such as: an increase in inventories of approximately $222,000. |
Net cash flow used in investing
activities was $5,687,716 for fiscal 2011 as compared to net cash flow used in investing activities of $9,164,038 for fiscal 2010. During fiscal 2011,
we spent approximately $192,000 on purchase of property and equipment and spent approximately $5,516,000 on purchase of land use and yew forest assets
rights, offset by proceeds from disposal of property and equipment of approximately $20,000. During fiscal 2010, we spent approximately $169,000 on
purchase of property and equipment and spent approximately $9,022,000 on purchase of land use and yew forest assets rights, offset by proceeds from
disposal of property and equipment of approximately $27,000.
Net cash flow provided by financing
activities was $88,119 for fiscal 2011 as compared to net cash flow provided by financing activities of $1,326,624 for fiscal 2010. During fiscal 2011,
we received proceeds from related party advances of approximately $88,000. During fiscal 2010, we received proceeds from refundable common stock
subscription of $950,000 and received proceeds from related party advances of approximately $434,000, offset by repayments made for directors’
advances of approximately $57,000.
We have historically financed our
operations and capital expenditures through cash flows from operations, bank loans and advances from related parties. From March 2008 to September
2009, we received approximately $2.9 million of proceeds in the aggregate from offerings and sales of our common stock. Except for the portion used to
pay for professional and other expenses in the U.S., substantial portions of the proceeds we received through selling of our common stock were retained
in the PRC and used to fund our working capital requirements. As the PRC government imposes controls on PRC companies’ ability to convert RMB into
foreign currencies and the remittance of currency out of China, from time to time, in order to fund our corporate activities in the U.S., our CEO
Zhiguo Wang advanced funds to us in the U.S. and we repaid the amount owed to him in RMB in the PRC.
It is management’s intention to
expand our operations as quickly as reasonably practicable to capitalize on the demand opportunity for our products. We regularly review our cash
funding requirements and attempt to meet those requirements through a combination of cash on hand, cash provided by operations and any potential
available bank borrowings. We believe that we can continue meeting our cash funding requirements for our business in this manner over at least the next
twelve months. The majority of our funds are maintained in RMB in bank accounts in China. We receive all of our revenue in the PRC. Under existing PRC
foreign exchange regulations, payments of current account items, including profit distributions, interest payments and expenditures from trade related
transactions, can be made in foreign currencies by complying with certain procedural requirements. However, approval from the SAFE or its local
counterparts is required where RMB is to be converted into foreign currency and remitted out of China to pay capital expenses such as the repayment of
loans denominated in foreign currencies. The PRC government may also, at its discretion, restrict access to foreign currencies for current account
transactions. Approximately $24.5 million of our net
51
assets are located in the PRC. If the foreign exchange control system prevents us from obtaining sufficient foreign currency to satisfy our currency demands, and we may not be able to move funds deposited within the PRC to fund working capital requirements in the U.S. or pay dividends, which we have declared not but might declare in the future, in currencies other than the RMB, to our shareholders.
Contractual Obligations and Off-Balance Sheet
Arrangements
We have certain potential commitments
that include future estimated payments. Changes in our business needs, cancellation provisions, changing interest rates, and other factors may result
in actual payments differing from the estimates. We cannot provide certainty regarding the timing and amounts of payments. We have presented below a
summary of the most significant assumptions used in our determination of amounts presented in the tables, in order to assist in the review of this
information within the context of our consolidated financial position, results of operations, and cash flows.
The following tables summarize our
contractual obligations as of September 30, 2012, and the effect these obligations are expected to have on our liquidity and cash flows in future
periods:
| Contractual obligations: |
Total |
1 year |
1–3 years |
3–5 years |
5+ years |
|||||||||||||||||||||
|---|---|---|---|---|---|---|---|---|---|---|---|---|---|---|---|---|---|---|---|---|---|---|---|---|---|---|
Operating
leases |
$ | 667,293 | $ | 36,004 | $ | 69,561 | $ | 63,924 | $ | 497,804 | ||||||||||||||||
Land and yew
forest rights (1) |
895,532 | 105,778 | 789,754 | — | — | |||||||||||||||||||||
Total
|
$ | 1,562,825 | $ | 141,782 | $ | 859,315 | $ | 63,924 | $ | 497,804 | ||||||||||||||||
(1) |
On July 18, 2012, we entered into the Fuye Field Agreement, pursuant to which we acquired the right to use land with an area of 117.5 mu (approximately 19.6 acres), for a term of 16 years, through March 2028. We also acquired a building, and more than 80,000 trees — which are not yew trees — located on the property. During the term of the Fuye Field Agreement, we have the right to develop the property for the production of yew trees. The aggregate purchase price of RMB 15,002,300 (approximately $2,377,000) was divided into three installments. As of September 30, 2012, we made payment of RMB 9,330,000 (approximately $1.5 million) and we are required to pay RMB 670,000 (approximately $106,000) on December 25, 2012 and RMB 5,002,300 (approximately $790,000) on or before December 25, 2013. |
Off-Balance Sheet Arrangements
We have not entered into any other
financial guarantees or other commitments to guarantee the payment obligations of any third parties. We have not entered into any derivative contracts
that are indexed to our shares and classified as shareholder’s equity or that are not reflected in our consolidated financial statements.
Furthermore, we do not have any retained or contingent interest in assets transferred to an unconsolidated entity that serves as credit, liquidity or
market risk support to such entity. We do not have any variable interest in any unconsolidated entity that provides financing, liquidity, market risk
or credit support to us or engages in leasing, hedging or research and development services with us.
52
General
The Company, through YBP; its
wholly-owned subsidiaries Yew HK and JSJ; and its VIE, HDS; is a major grower and seller of yew trees and manufacturer of products made from yew trees
in China. We also sell raw material, including the branches and leaves of yew trees, used in the manufacture of TCM. The yew raw material contains
taxol, and TCM containing yew raw material has been approved in the PRC for use as a secondary treatment of certain cancers, meaning it must be
administered in combination with other pharmaceutical drugs. The yew industry is regulated in the PRC because the yew tree is considered an endangered
species.
We believe that our business is built
upon five unique components:
• |
We have entered into several land use agreements with various parties, which provide the potential for us to grow a large number of yew trees on large areas of land over the next few decades, although we cannot currently estimate the number of trees we will grow or the total amount of land we will put into production over such period. |
• |
We employ proprietary, patented accelerated growth technology, the Asexual Reproduction Method, to bring yew trees to commercialization decades faster than growing yew trees naturally. |
• |
Because of our more productive and faster rate of yew cultivation, we have a sufficient supply of raw material to allow us to use the branches and leaves, rather than the bark, of yew trees, to sell to customers for the purpose of making TCM. The yew industry is highly regulated in the PRC because the yew tree is considered an endangered species. By harvesting only branches and leaves of yew trees we respond to both environmental sensitivities and regulations, because cutting the bark of the yew trees will damage the trees and stop it from growing new branches. |
• |
We have permits from the Heilongjiang provincial government to sell our yew trees and manufacture handicrafts using yew timber. We believe that we are one of only a handful of companies in the PRC with permissions to manufacture handicrafts using yew timber. |
• |
The TCM raw materials and yew tree segments of our business are tax-free in the PRC. |
Using patented accelerated growth
technology developed by our founder and President, Zhiguo Wang, based on principles of asexual propagation and cloning, we can bring yew trees to
maturity and commercialize them in as little as two-to-three years, compared to more than 50 years needed for naturally grown yew trees. Additionally,
we have permits from the Heilongjiang provincial government to sell our yew trees and products made from yew trees. We believe that we are one of only
a few companies in the PRC with such permission.
We operate in three business segments:
TCM raw materials, yew trees and handicrafts. We sell raw materials in the form of yew tree branches and leaves to our customers, primarily an
affiliate, to manufacture TCM containing taxol. We began the TCM raw materials segment in 2010.
Our TCM raw materials business became
our largest operating segment in 2011 and is expected to continue to contribute an increasing percentage of net revenue in future
periods.
In December 2009, another company owned
directly and indirectly primarily by Mr. Wang, Yew Pharmaceutical, received approval from HFDA to sell Zi Shan, a TCM to be sold under both
prescription and over-the-counter drug categories. Zi Shan contains taxol, and the TCM is approved in the PRC as a secondary treatment of
cancer, meaning it must be administered in combination with other pharmaceutical drugs. In February 2010, we began selling to Yew Pharmaceutical
branches and leaves of yew trees, which is more environmentally responsible than using the bark of yew trees, to extract taxol.
We also derive a significant amount of
our revenue from the sale of yew seedlings and trees to state-owned enterprises and private businesses for reforestation in Heilongjiang Province and
Jilin Province, in the northeastern China, as well as the sale of potted yew trees to retail customers. Additionally, we generate revenue from the sale
of handicrafts, including furniture, made from yew timber. All of our revenue is derived from the Chinese domestic market.
53
For the nine months ended September 30,
2012, our TCM raw materials revenue represented approximately 59.2% of consolidated revenue (including 12.4% of consolidated revenues to related
parties); sale of yew trees represented approximately 38.3% of consolidated revenue; and the sale of handicrafts represented approximately 2.5% of
consolidated revenue (including 0.1% of consolidated revenues to related parties). For the nine months ended September 30, 2011, our TCM raw materials
revenue represented approximately 60.2% of consolidated revenue (including 26.5% of consolidated revenues to related parties); sale of yew trees
represented approximately 37.7% of consolidated revenue; and the sale of handicrafts represented approximately 2.1% of consolidated
revenue.
For the year ended December 31, 2011,
revenues from the sale of TCM raw materials represented approximately 58.0% of consolidated revenue (including 23.3% of consolidated revenues to
related parties); sale of yew trees represented approximately 40.3% of consolidated revenue; and the sale of handicrafts represented approximately 1.7%
of consolidated revenue. For the year ended December 31, 2010, our TCM raw materials revenue represented approximately 55.5% of consolidated revenue
(including 25.9% of consolidated revenues to related parties); sale of yew trees represented approximately 41.6% of consolidated revenue; and the sale
of handicrafts represented approximately 2.9% of consolidated revenue. We expect that sales from our TCM raw materials segment will become an
increasingly important source of revenue for us.
Under Article 27 of the Law of the PRC
on Enterprises Income Tax and Article 15 of the provisional regulations of the PRC on Value Added Tax, we do not pay any tax, including income tax and
VAT, in our TCM raw materials and yew tree segments. Our current VAT exemption certificate is valid from July 1, 2005 through December 31, 2016 and our
current income tax exemption certificate is valid from January 1, 2008 through December 31, 2058. We pay taxes on handicrafts made from yew
timber.
Zhiguo Wang, the founder of the Company
and our President, does not devote all of his time to the Company’s business. We estimate that Mr. Wang devotes approximately 71% of his time, or
approximately 120 hours per month, to the Company’s business. He devotes about 12% of his time, or approximately 20 hours per month, to the
business of Yew Pharmaceutical and the balance of his time, or approximately 28 hours per month, to the business of other companies in which he is
involved. These allocations are approximate only and are subject to change depending upon the particular projects and changing needs of the individual
businesses in which he is involved.
The executive offices of HDS, our
operating entity, are located in Harbin City, the capital of Heilongjiang Province in the PRC. Our four nurseries used to cultivate yew trees, and our
production facilities to manufacture products made from yew trees, are located in and around Harbin. We also have a facility in Harbin where we
exhibit and warehouse potted yew trees, handicrafts and furniture.
YBP was incorporated in Nevada on
November 5, 2007. YBP’s executive offices are located at 294 Powerbilt Avenue, Las Vegas, Nevada 89148 and our telephone number is (702) 487-4683.
Our website is www.yewchina.com. No part of our website is incorporated into this registration statement or any other report we file with the
SEC from time to time.
Industry Overview
Since 1996, we have grown Japanese yew
trees (also referred to in China as Northeast yew trees), taxus cuspidata, on mountain hillsides near Harbin and cultivate them in four
nurseries we operate near Harbin. We have successfully cultivated more than eight million yew nursery seedlings in four nurseries. These nurseries
occupy approximately 17,596 Mu (approximately 2,933 acres) of forested land. We currently have the capacity to grow up to two million yew nursery
seedlings annually. We also have an additional 1,000,000 Mu (approximately 166,667 acre) site in Wuchang, which we currently do not utilize, for future
expansion of our growing operations.
Northeast yew trees grow well in the
climate of Northeast China. Using our patented Asexual Reproduction Method, developed by our founder and President, Zhiguo Wang, based on principles of
asexual propagation and cloning, we can bring yew trees to maturity and commercialize them in as little as two-to-three years, compared to more than 50
years of maturity period for naturally grown yew trees. We believe that
54
utilizing the Asexual Reproduction Method addresses an imbalance between supply and demand for yew trees, both for reforestation and use in the production of cancer-fighting TCM.
The Northeast yew is a small- to
medium-sized evergreen tree, typically growing from between 35 and 65 feet tall, with a trunk up to 6-1/2 feet in diameter. The bark is thin and scaly
brown. The leaves are lanceolate, flat and dark green, typically between 1/2 and 1-1/2 inches long and about 0.1 inches broad, arranged in a spiral
pattern on the stem. The Northeast yew tree is relatively slow growing compared to other species of yew trees, but can be very long-lived. It is
estimated that a Northeast yew tree can live up to 2,000 years. The growing cycle of a Northeast yew tree is extremely long and regeneration is
difficult.
Yew trees are scarce and,
traditionally, it takes a long time to bring them to commercialization. It can take more than 50 years for a yew tree to mature naturally for
pharmaceutical use. Our Asexual Reproduction Method shortens this period significantly. We begin with cuttings from natural yew trees, which we
transplant at our nurseries. By using our Asexual Reproduction Method, the success rate of maturation is enhanced and in approximately two-to-three
years the yew tree is able to be used for commercialization. We use some trees in their entirety and parts of other yew trees that we need and take the
rest of the tree itself back to the forest to finish full growth to maturity in 10-15 years, creating a new generation of mature yew
trees.
Because the Northeast yew trees are
categorized as an endangered species and are protected in the PRC as a Level 2 preserved tree, the operation of the yew industry in the PRC is strictly
regulated by the PRC Forest Law and its Implementing Regulations, Rules on Permit for Felling of Forest Trees, Regulations on Wild Plants Protection
and other PRC laws and regulations. The available sources for yew trees for commercialization are scarce and costs of production are relatively
high.
In accordance with the Notification
about Key Points of Forestry Policies from National Forestry Bureau Registered (2007) No.173, or the Notification, issued on August 10, 2007
jointly by the National Forestry Bureau, the National Development and Reform Commission, the Finance Ministry, the Commerce Department, the State
Administration of Taxation, the China Banking Regulatory Commission, and China Security Regulatory Commission, the Chinese government encourages the
development of technologies promoting the cultivation of rare trees and plant-based pharmaceuticals; encourages the cultivation of fast growing timber
species, especially rare and large diameter timber; and accelerates the reorganization and integration of existing wood-based panels, furniture, wood
products manufacturing enterprises. The Notification also provides that the forestry industry shall enjoy state preferential taxation policies.
According to the provisions of the relevant tax laws and regulations on enterprises engaged in agriculture and forestry projects, the enterprise income
tax can be reduced or eliminated.
The Ministry of Science and Technology
of the PRC implemented the Spark Program, or the Spark Program, in 1986. The major task of the Spark Program is to rejuvenate the rural economy by
relying on science and technology and popularizing advanced and applicable scientific and technological findings in the rural areas. To encourage the
Spark Program, the Chinese government set up the National Spark Prize in 1987, including Spark Science and Technology Prize, Spark Talent Training
Prize, Spark Management Prize, Spark Outstanding Youth Prize and Spark Demonstrating Enterprise Prize. In 2001 the project of cultivation of yew trees
has been recognized by the Ministry of Science and Technology of PRC as the Spark Program.
We have entered into several land use
agreements with various parties, which provide the potential for us to grow a large number of yew trees on approximately 1,017,713.5 mu (approximately
169,619 acres) over the next few decades, although we cannot currently estimate the total number of trees we will grow or the total amount of land we
will put into production over such period. Among these land use agreements, on March 21, 2004, we entered into a Joint-Stock Construct Rare Plant
Northeast Yew Contract, or the Joint Venture Agreement, with the Heilongjiang Province Wuchang City Forestry Bureau, or the Wuchang Forestry Bureau,
pursuant to which the Wuchang Forestry Bureau has given us access to 1,000,000 mu (approximately 166,667 acres) of forest land located in Wuchang City
to develop yew tree forests and produce yew seedlings. Pursuant to the Joint Venture Agreement, we have permission to plant yew trees on this land from
2004 through 2034. Under the Joint Venture Agreement, any profits from the planting of yew trees and other agriculture shall be distributed 80% to the
Company and 20% to the Wuchang Forestry Bureau. We have not yet cultivated this land or generated any revenue under the Joint Venture Agreement.
Because of the profit-
55
sharing feature of this agreement, we presently intend to focus on cultivating yew trees on other land subject to existing and possibly future land use agreements as our priority for at least the next few years.
Our business is sustainable and
environmentally responsible. We accelerate the growth of yew trees utilizing our Asexual Reproduction Method, more than replenishing the number of yew
trees we cultivate and put into production. We harvest yew trees twice a year. We do not use the bark of yew trees in production, which would kill the
yew tree; instead, we use the branches and leaves of the yew tree.
Traditional Chinese Medicine
There is a long-established,
scientifically recognized relationship between the Pacific yew, taxus brevifolia, and similar species of yew (including the Northeast yew), and
certain cancer drugs, most notably paclitaxel, also known as taxol. Paclitaxel is a broad-spectrum mitotic inhibitor used in cancer chemotherapy. It
was discovered in a U.S. National Cancer Institute program at the Research Triangle Institute in 1967 when Monroe E. Wall and Mansukh C. Wani isolated
it from the bark of the Pacific yew tree and named it taxol. Taxol is found in the root, stem, leaf, seed and bark of the taxus family of trees,
including the Pacific and Northeast yews. It was developed commercially by Bristol-Myers Squibb under the brand name Taxol®. The PRC
State Food and Drug Administration, or the SFDA, approved a new drug certification for taxol in 1995.
The improvement on the extraction and
isolation technology of the biological properties of taxol made it a breakthrough in the treatment of cancer in the 1990s, providing a non-intrusive
alternative to the more radical techniques of radiotherapy and surgery. Taxol is used to treat patients with lung, ovarian, breast, head and neck
cancer, and advanced forms of Kaposi’s sarcoma.
Taxol, derived from certain species of
yew tree including the Northeast yew tree, is a taxane drug and mitotic inhibitor that is used to treat cancer. All cells grow by a process called
mitosis (cell division). Taxol targets rapidly growing cancer cells, sticks to them while they are trying to divide and prevents them from completing
the division process. Since the cancer cells cannot divide into new cells, they cannot grow and the cancer cannot metastasize. Taxol may suppress tumor
growth through regulating microtubule stabilization, inducing apoptosis and adjusting immunologic mechanism. Taxol can promote the polymerization of
microtubule and inhibit their degradation, through which taxol can block cell division in the G2/M stage and induce apoptosis of tumor
cells.
Taxol is a clear, colorless fluid that
is given intravenously as a chemotherapy injection or as an infusion pumped from a dose bag. Taxol can be administered as high-dose chemotherapy, once
every two or three weeks, or in low doses on a weekly basis. In the treatment of certain soft tissue cancers, such as breast cancer, taxol is given for
early stage and metastatic breast cancer after combination anthracycline and cytoxan therapy and is also given as neoadjuvant treatment
to shrink a tumor before surgery. Taxol can also be used together with a drug called Cisplatin to treat advanced ovarian cancer and non-small cell lung
cancer, or NSCLC. The U.S. Food and Drug Administration has approved taxol as the primary and secondary treatment for NSCLC. There are other generally
accepted protocols for the use of taxol as a cancer drug alone or in combination with other drugs depending upon the diagnosis, staging and type of
cancer, as well as a patient’s medical history, tolerances and allergies, among other relevant factors.
The Chinese Herbal Medicine
Standard (manual) of Heilogjiang Province (2011 version), edited by the HFDA, states that the Northeast yew has a secondary effect on treating
cancer, meaning that while it has an impact on treating cancer, yew tree extract by itself (as distinguished from processed taxol) cannot be used as a
stand-alone treatment of cancer. While the TCM raw material we sell contains taxol naturally, the companies to whom we sell such raw materials do not
extract taxol from our TCM raw materials to produce pharmaceutical taxol.
Certain species of yew trees are the
only natural source of taxol. Initially, taxol was extracted from the bark of the yew tree, but harvesting the bark usually kills the tree. Moreover,
taxol is extracted from the bark of yew trees in extremely small amounts, often requiring the destruction of several yew trees to extract enough taxol
to treat a single patient. Accordingly, taxol extracted from the yew is both very expensive and environmentally harmful. Because of environmental
concerns about the adverse impact on forests in the Pacific Northwest in the United States, by the 1990s taxol ceased being derived from the bark of
the Pacific
56
yew. Alternative ways to develop taxol from renewable resources is ongoing. These include taxol-producing fungi from the yew tree and using other parts of the yew tree that may contain taxol.
We believe using yew trees that have
been grown using our Asexual Reproduction Method significantly shortens the maturity cycle of naturally-grown yew trees and allows earlier
commercialization of yew trees as a source of taxol. We further believes that using the branches and leaves of yew trees in large quantities, as we do,
provides the key to solving the need for additional sources of taxol while not further endangering the PRC’s natural supply of yew trees, which
themselves were over-forested in previous decades since the discovery of taxol.
The founder and President of our
company, Zhiguo Wang, with the support of the Ministry of Forest and Science, and the Technology Department of Heilongjiang Province, successfully
completed a project from 1984 to 1995 for asexual reproduction of the Northeast yew, and developed the first artificial cloned yew forest in the world.
Tests conducted by the Ministry of Education’s Key Laboratory of Forest Plant Ecology in Northeast Forestry University have shown that the growing
cycle of a cloned yew is significantly shorter than that of a natural yew and the concentration is taxol is higher. In 1995, this project received the
Second Scientific and Technological Progress Award of Heilongjiang Province.
In December 2009, Yew Pharmaceutical
received authorization from HFDA approving the sale of a yew-based TCM as a secondary treatment of cancer and certain other disorders, including uric
disorders, certain liver diseases and menstrual discomfort. This TCM, sold under the brand name Zi Shan, has been approved to be sold under both
prescription and over-the-counter drug categories. We also believe that Zi Shan may provide general beneficial effects on overall health.
According to the Quintessence of Materia Medica, published in August 2006 by the Chinese Academy of Medical Sciences — Institute of
Medicinal Plants, the Northeast yew plays a role as a diuretic, detumescence and in restoring menstrual flow. The approval from HFDA allows Yew
Pharmaceutical to sell Zi Shan throughout the PRC.
In November 2010, Yew Pharmaceutical
applied to the SFDA to approve an upgrade of Zi Shan from provincial to national standard, which we believe will enhance its general market
acceptance and therefore could create additional demand for the raw materials we sell to Yew Pharmaceutical. As of the date of this registration
statement, the application is pending.
We entered into the Development
Agreement with Yew Pharmaceutical, a related party, for the development, production and sale of yew-based TCM. Under the Development Agreement, we sell
yew branches and leaves to Yew Pharmaceutical. Yew Pharmaceutical manufactures TCM at its own facilities in Harbin in accordance with the requirements
of HFDA. Yew Pharmaceutical is also responsible for producing the finished product in accordance with GMP requirements (in this regard, it received a
GMP certificate in November 2009), and filing all applications with and obtaining all approvals from the HFDA.
Yew Pharmaceutical is the primary
purchaser of the raw materials we sell in our TCM raw materials business. Pursuant to the Development Agreement, Yew Pharmaceutical pays us RMB
1,000,000 per ton of raw material, whereas the current market price for such raw material is approximately RMB 1,100,000 per ton. The term of the
Development Agreement is ten years, terminating on January 9, 2020. We began selling raw material in the form of branches and leaves of yew trees to
Yew Pharmaceutical commencing in February 2010.
Yew Pharmaceutical is owned 95% by
Heilongjiang Hongdoushan Ecology Forest Co., Ltd, a Chinese company, or HEFS, which itself is owned 63% by our founder, President and one of our
directors, Zhiguo Wang, and 34% by his wife, Guifang Qi, who is also one of our directors. The remaining 5% is owned directly by Madame Qi. See
“Certain Relationships and Related Transactions, and Director Independence”.
Yew Pharmaceutical is the exclusive
manufacturer of Zi Shan in the PRC. Zi Shan is sold in sachets in HFDA-approved dosages of two grams per sachet. It is consumed as a tea
twice a day for therapeutic purposes or once a day for general health benefits. Approximately 30% of Zi Shan sales to date are in Heilongjiang
Province and approximately 70% of such sales are from other provinces.
Starting in June 2010, other
pharmaceutical companies started purchasing yew raw materials from us to manufacture and sell TCM similar to Zi Shan in other
provinces.
57
Yew Trees
We have developed a detailed process of
yew tree breeding. We start growing yew trees from seedlings that we purchase from various third parties, including certain affiliates. These seedlings
come from naturally-grown mature yew trees. Because yew trees are protected, yew seedlings are scarce. Prices have been rising for yew seedlings by
approximately 20% per year in recent years and we expect that to continue for at least the next few years. Our largest supplier of yew seedlings is a
company that is directly and indirectly owned primarily by Mr. Wang and Madame Qi. See “Suppliers” below and “Certain Relationships and
Related Transactions, and Director Independence”.
We cultivate the yew seedlings at our
nurseries for at least three to four years. Most of the land we lease from various parties for the growth of yew trees is location in and around
Harbin. We have entered into several land use agreements with various parties, which provide the potential for us to grow a large number of yew trees
on large areas of land over the next few decades, although we cannot currently estimate the number of trees we will grow or the total amount of land we
will put into production over such period. Among these land use agreements, pursuant to the Joint Venture Agreement, we have been granted permission to
grow yew trees on up to 1,000,000 mu (approximately 166,667 acres) and to share profits 80% to the Company and 20% to the Wuchang Forestry Bureau. In
addition, we have been provided two areas to use as nurseries for the cultivation of yew seedlings in the aggregate amount of 1,400 mu (approximately
233 acres). See “Properties”.
When the yew trees are mature enough
for transplanting, we prepare survey and design specifications for an afforestation plan. Once this has been prepared and approved, we clean and divide
the reproducing area, clearing brushwood and weeds, and mark off breeding areas of between five and eight meters in width and less than one meter in
length. We typically plant stock in the spring, when the defrosted soil is a depth of at least 15 centimeters.
The cut materials are then dried for a
period of 18-20 hours at a temperature of between 55°C and 60°C, with the temperature monitored every three hours. After the drying process,
the moisture content of the plant material should not exceed 8.0%. We then use a crusher to grind the plant material into a powder. The powder is mixed
before being put into sealed plastic bags. The sealed plastic bags are put into outer shipping material and the package undergoes a final inspection
before being ready for shipment.
By using our patented Asexual
Reproduction Method, developed by our founder and President, Zhiguo Wang, we are able to accelerate the commercial viability of a yew tree, so that it
is able to be used for commercialization starting in approximately three years, compared to more than 50 years for naturally grown yew trees. For
example, the branches and leaves from an accelerated growth yew tree can be used in the production of TCM in three to five years, and a cutting from an
accelerated growth yew tree will develop into a small yew tree that can be sold as a potted tree starting in approximately three years. We are
authorized sell cuttings of cloned yew trees without a government permit.
We sell yew trees primarily to
state-owned enterprises and private businesses for reforestation in Heilongjiang Province and Jilin Province, in Northeast China. Historically, we have
sold the majority of our yew trees to a small number of larger customers. However, even though we have a number of long-term customers, we do not enter
into long-term agreements for the sale of our yew trees. Because our profit margin is smaller for larger customers due to volume price discounts, we
are making efforts to increase sales to smaller customers. Our business relating to the sale of yew trees is seasonal. March to May, November and
December are our strongest months.
After a period of three-to-seven years
under cultivation, we also transplant some yew trees into decorative ceramic pots and sell these to retail customers for display in homes and offices.
The Chinese people believe that in addition to its aesthetic qualities, yew trees help cleanse the air and reduce pollution. Accordingly, yew trees are
purchased by individuals for personal use in their home or office and are often given as gifts. Yew trees can be found at landmarks around the world,
including the White House and Lincoln Memorial.
We purchase high quality ceramic pots
from third parties into which the yew trees are transplanted. We believe that there is a readily available supply of high-quality ceramic pots at
relatively low and stable prices.
58
Because of the limited supply of yew
trees and restrictions on the commercial use of yew trees, combined with the high quality of the ceramic pots we purchase from third-party sources,
primarily in South China, used for the transplanted trees, the potted yew trees that we sell are highly prized and we charge premium retail prices by
Chinese standards. Retail prices of potted yew trees vary based on the age, shape and other desirable qualities of the tree, and range from
approximately RMB 280 to approximately RMB 3,080.
In connection with our entering into
the Fuye Field Agreement in July 2012, we acquired more than 80,000 trees — which are not yew trees — located on that property. These trees
consist of approximately 20,000 larix, 56,700 spruce and 3,700 poplar trees. Larix trees are used primarily in landscaping and we currently anticipate
that we will begin selling larix trees to customers during 2013. Spruce and poplar trees are used primarily as building materials and we currently
anticipate that we will begin selling these trees to customers in later periods, when these trees reach maturity in several years.
Handicrafts
Yew wood is of medium strength, making
it possible to fashion products from the yew tree without undue effort or expense requiring special equipment. To create our current inventory of
handicrafts, including furniture, historically we employed between 15 and 20 artisans from throughout the PRC, principally from Fujian Province and
Jiangxi Province in southern China, annually from summer through late fall, to manufacture handicrafts made from yew timber at our production facility
near Harbin. Since we currently have an adequate inventory of handicrafts, we now manufacture additional handicrafts only when orders are placed. We
had minimal manufacturing activities in 2010 and 2011.
We begin the process of manufacturing
handicrafts by selecting yew timber with greater variation in molding, which is indicative of a more attractive grain to the wood. The selected timber
is then placed in a drying chamber and steam is injected to accelerate water evaporation until moisture content is only 3%. Depending upon the size and
thickness of the timber, this process can take as long as one week.
The process of designing the item to be
created begins with rough basing, based on geometrical form to summarize the overall artistic idea. During the entire process of carving the timber it
is important to minimize knife scarring. Our crafted pieces typically go through a dying process; this not only can address certain small imperfections
in the wood but is also done to aesthetically enhance the finished piece. After waiting at least twelve hours following dyeing, the carved item is then
polished with sandpapers of different roughness and finally finishing cloths.
All of our products are hand-made,
using yew tree timber of different maturities. Much of the furniture that we produce is reproductions of popular Ming and Qing Dynasty styles. We have
acquired an inventory of yew timber from various parties over a number of years and have an adequate supply on hand for approximately five more
years’ worth of production. Because of the scarcity of yew timber needed to produce handicrafts, it is very expensive to acquire new inventory of
yew timber and supplies are extremely limited, if available at all. Accordingly, we plan to reduce and eventually eliminate our handicraft segment over
the next several years.
Pursuant to the Department of Forestry
of Heilongjiang Province (2003) Document No.188, issued by Department of Forestry of Heilongjiang Province on October 25, 2003, we have been granted
rights to develop comprehensively and use Northeast yew resources. We believe that we are one of only a few companies in the PRC to have received
approval for the manufacture of items made from yew timber.
Because of the limited supply of yew
timber and restrictions on the commercial use of yew trees, combined with the high quality of artisans we employ, the handicrafts and furniture we
manufacture are highly prized and we charge premium retail prices to our customers. Examples of retail prices for some of our products are as
follows:
• |
a pair of yew chopsticks sells for approximately RMB198; |
• |
a fountain pen sells for approximately RMB 2480; |
• |
sculptures can sell for tens of thousands of RMB; and |
• |
large pieces of furniture can sell for more than RMB 100,000. |
59
Suppliers
We obtain yew seedlings from several
sources. Prior to January 1, 2011, our largest supplier was ZTC, a related party. We believe that we pay market rate for the seedlings and cuttings we
purchase from our suppliers. Mr. Wang and Madame Qi own approximately 39.4% and 30.7%, respectively, of ZTC. See “Certain Relationships and
Related Transactions, and Director Independence”. We do not plan on making significant purchases from ZTC in the future.
None of the agreements we have with our
suppliers are long-term contracts, meaning they can be canceled at any time. We believe that the supply of yew seedlings is readily available and if we
lost one of our suppliers, we could readily find a replacement.
Sales and Marketing
We primarily serve the Chinese domestic
market. The sale of yew trees for reforestation in Heilongjiang Province and Jilin Province is to both state-owned enterprises and private
businesses.
We sell yew trees to a relatively small
number of customers. For the nine months ended September 30, 2012, the following customers accounted for 10% or more of our consolidated
revenue:
• |
Anhui Bairun accounted for approximately 16% of our consolidated revenue |
• |
Shenzhen Keiji accounted for approximately 14% of our consolidated revenue |
• |
Changchun Hengtai accounted for approximately 14% of our consolidated revenue |
• |
Wuchang Hongyi Co., Ltd. accounted for approximately 13% of our consolidated revenue |
• |
Yew Pharmaceutical accounted for approximately 12% of our consolidated revenue |
• |
Shenzhen Tianyitang accounted for approximately 11% of our consolidated revenue |
For the year ended December 31, 2011,
the following customers accounted for 10% or more of our consolidated revenue:
• |
Anhui Bairun accounted for approximately 29% of our consolidated revenue |
• |
Yew Pharmaceutical accounted for approximately 23% of our consolidated revenue |
• |
Wuchang Hongyi accounted for approximately 13% of our consolidated revenue |
• |
Changchun Hengtai accounted for approximately 10% of our consolidated revenue. |
Yew Pharmaceutical is the manufacturer
of Zi Shan and other pharmaceutical products, and is owned, directly and indirectly, primarily by Zhiguo Wang and Guifang Qi. Anhui Baiyun and
Changchun Hengchai are large pharmaceutical distribution companies engage in producing and distributing western and TCM pharmaceutical products.
Wuchang Hongyi is a mid-size mining company engaged in iron ore mining and the iron ore fine processing business. Wuchang Hongyi purchases yew
seedlings and trees from us for forestation in mining areas.
While we generally do not enter into
written agreements for the purchasers of our yew trees and other products, we have entered into written agreements for the sale of yew seedlings,
cuttings, branches, raw materials for medicinal use and handicrafts with some of our larger customers.
The sale of furniture and handicrafts
from our cultivated yew trees, as well as the sale of potted yew trees for display in homes and offices, is to the Chinese domestic market. We
exhibit and warehouse potted yew trees, handicrafts and furniture at a facility located in Harbin.
Retail prices for potted yew trees are
high by Chinese standards, but have remained stable. We provide the potted yew trees that we sell, from our nurseries. the supply of ceramic pots that
we purchase from third-parties suppliers that we use to transplant cultivated yew trees is good and prices are stable.
The sale of handicrafts is not
seasonal. Until December 2012, our store in Harbin maintained inventory of a range of handicrafts and furniture, for sale and can also
take orders for products custom-made to the
60
specifications of our customers. We currently use this facility to exhibit and warehouse our products. Prices and delivery time for custom pieces vary depending upon the item and time of year, since our artisans work primarily during the warmer months from April to September.
We also sell our products through a
network of distributors throughout the PRC. Generally, we appoint one distributor in a given province for all of our products. Anhui Bairun and
Changchun Hengtai are both distributors accounting for more than 10% of our revenue. We believe that if one or both of these distributors ceased
purchasing our products, we would be able to find other large distributors because yew products are unique and in high demand.
Beginning in August 2010, we began the
direct sale of handicrafts, including furniture, through the Internet, to supplement the sale of handicrafts in our store in Harbin and through
distributors.
In August 2012, we began to more
actively market our handicraft products. Specific steps taken to market our handicraft products include:
• |
We will begin to engage first tier distributors to distributor our handicraft products in provincial capital cities in 10 provinces; each first tier distributor is required to reach minimal annual sales volume of 2,000,000 RMB. First tier distributors will be able to purchase handicrafts from us at a price below the price that basic distributors pay for the handicraft products. In addition to the discounted first tier distributor pricing provided, we will also provide approximately 3%-5% commission (payable in yew seedling products) to these first tier distributors. |
• |
We will engage second tier distributors in smaller cities. Each second tier distributor is required to reach minimal annual sales volume of 1,000,000 RMB. These distributors will also be offered beneficial pricing off the price that basic distributors pay. We will also provide approximately 2%-3% commission (payable in yew seedling products) to the second tier distributors. |
• |
We have instructed our sales representatives to make frequent visits to our distributors to promote our handicraft products. |
In December 2012, we closed our
store in Harbin, although we continue to use the facility to exhibit and warehouse our products.
Zi Shan is marketed and sold
exclusively through Yew Pharmaceutical, under the Development Agreement. Yew Pharmaceutical is also our major purchaser of yew raw material used in the
production of TCM. Yew Pharmaceutical is owned directly and indirectly primarily by Mr. Wang and Madame Qi.
Other TCM that is produced by
manufacturers who buy yew raw material from us is marketed and sold by them to third party users, including hospitals.
Intellectual Property
We believe that we are able to
cultivate and grow yew trees successfully and faster by using our patented Asexual Reproduction Method, based on principles of asexual propagation and
cloning, developed by our founder and President, Zhiguo Wang. Our patented Asexual Reproduction Method functions through cell replication with
identical genes, sometimes referred to as cloning, of Northeast Yew with only a single parent present.
Mr. Wang first studied yew cloning
techniques in 1982, for the purpose of addressing the long reproduction time, low reproduction rates and weak survival rates for yew trees in general.
With the support of the Ministry of Forest and Science, and the Technology Department of Heilongjiang Province, Mr. Wang successfully completed a
project from 1984 to 1995 for asexual cultivation and cloning technology of the yew, and developed the first artificial cloned yew forest in the world.
Tests conducted by the Ministry of Education’s Key Laboratory of Forest Plant Ecology in Northeast Forestry University have shown that the growing
cycle of a cultivated yew is significantly shorter than that of a natural yew and the concentration is taxol is higher.
61
We have been issued two patents related
to our advanced growth technology:
• |
“Yew Tree Plant Extracts, Methods for Extracting the Plant Extracts and Application”, or the Yew Extract Method, was granted by the State Intellectual Property Office, or SIPO, to HDS on August 16, 2011. This patent had previously been held by Heilongjiang Yew Pharmaceutical Co., Ltd. This patent is valid for 20 years, from June 23, 2004 through June 22, 2024. |
• |
“Northeast Yew Asexual Reproduction Method”, or the Asexual Reproduction Method, was granted by SIPO to HDS on September 21, 2011. This patent is valid for 20 years, from September 30, 2010 through September 29, 2030. |
We believe that our patented Asexual
Reproduction Method has three unique advantages:
• |
The Asexual Reproduction Method addresses the low rooting rate problem and accelerates the seedling rate and the maturity period for Northeast yew. It increases the rooting rate to over 80% and the seedling rate to over 85% for Northeast yew. It can bring the Northeast yew to maturity and ready for commercialization for medical use in as little as two-to-three years, compared to more than 50 years for naturally growing yew trees. |
• |
Large colonies can form to out-compete other organisms for nutrients. The active ingredients in the offspring were relatively stable with little difference. |
• |
There is high chance of survival of the offspring with little variation. |
Our patented Yew Extract Method is an
extraction process to extract anti-cancer active ingredients from yew branches and leaves for use in anti-cancer drugs. It utilizes Northeast yew
branches and leaves as new medicinal parts to obtain anti-cancer ingredients. The Yew Extract Method has high yield rate and low costs. According to
the Shanghai Institute of Pharmaceutical Industry, the anti-cancer effect of the ingredients obtained through Yew Extract Method is no less than that
of taxol. Clinical research studies show the ingredients obtained through the Yew Extract Method has also low side effects. The Yew Extract Method
increases the sustainability and enhances the utilization rates for yew trees in medical use from 1/5000 (in obtaining taxol) to 1/200. The Yew Extract
Method has not yet been used for commercial purposes. We are currently studying the possibility of commercializing the Yew Extract Method for medical
uses.
We do not currently own any trade
names, trademarks or service marks the loss of which would be materially adverse to our business.
Research and Development
We entered into a Technology
Development Service Agreement dated January 1, 2010, or the Technology Agreement, with Kairun. Under the Technology Agreement, Kairun provides us with
testing and technologies regarding utilization of yew trees to extract taxol and develop higher concentration of taxol in the yew trees we grow and
cultivate. For these services, we have agreed to pay Kairun a one-time fee in the amount of RMB 200,000 after the technologies developed by Kairun are
tested and approved by us. We retain all intellectual property rights in connection with the technologies developed by Kairun. Kairun may not provide
similar services to any other party without our prior written consent.
The initial term of the Technology
Agreement was two years. Kairun informed us that it is taking longer than originally expected to develop the technologies and conduct the tests under
the Technology Agreement. Accordingly, in February 2012, we entered into a supplemental agreement with Kairun, extending the term of the Technology
Agreement indefinitely until project results specified in the original Technology Agreement are achieved. Kairun is owned directly and indirectly
primarily by Mr. Wang and Madame Qi. See “Certain Relationships and Related Transactions, and Director Independence”.
We incurred $24,404 and $16,048 of
research and development expenses in 2010 and 2011, respectively, and we did not incur research and development expenses for the nine months ended
September 30, 2012.
62
Competition
We believe that we face little
competition within the PRC for the growth and cultivation of yew trees because of the amount of space needed for proper cultivation of yew trees, the
long period to maturity of the yew tree, the difficulties of propagation, the scarcity of yews and the regulation of the yew industry in the PRC.
Because of the need for governmental approval to grow, cultivate and commercialize yew trees, we believe that there are high barriers to entry to our
industry.
Most of our competitors are smaller
companies that do not have cloning technology and therefore have to engage in substantially longer growing cycles to commercialize yew trees. Our main
competitors in the growth of yew trees and cultivation of yew cuttings include Zhejiang Changshan Mandiya Yew Science and Technology Limited Company,
located in Zhejiang, China; and Luo Yang Madia Yew Science and Technology Development Limited Company, or Luo Yang, located in Henan, China. For
example, Luo Yang has only approximately 300 mu (approximately 50 acres) of yew seedlings under cultivation.
There is significant competition for
the sale of furniture, handicrafts and potted trees in the PRC. This is a highly fragmented industry in the PRC with innumerable competitors and
little, if any, concentration of market share locally, regionally or nationally. Many of our competitors are probably larger than we are and can devote
more resources than we can to the manufacture, distribution and sale of furniture, handicrafts and potted trees. Additionally, many of our competitors
sell furniture and handicrafts, not made of yew trees, at prices considerably lower than the premium prices at which we sell our products. However, we
believe that there is relatively little competition within the Chinese domestic market for our premium-priced yew products, primarily because of the
scarcity of yew trees and the regulation of the yew industry in the PRC. We believe that we are the only business in the PRC that has been given
permission to produce furniture and handicrafts from yew timber.
While we do not manufacture TCM or any
taxol-based product ourselves, we could be seen as indirectly competing with companies that do manufacture taxol-based medicine. We face potential
competition from many providers of TCM for many ailments. With respect to TCM specifically for use as a secondary treatment for cancer, we may be seen
to compete with companies such as Fujian Leephick Pharmaceutical Limited Company, or Fujian Leephick, located in Wuping, China, and Qi Ao Chinese
Medicine Tablet Co., Ltd., or Qi Ao, located in Anguo City, Hebei Province, China. Fujian Leephick is a fairly new company that we believe is only in
an early stage of its research and development. Qi Ao can be differentiated from our company in that Qi Ao does not cultivate yew trees and requires
third party supply of raw materials to produce TCM, whereas we produce the raw materials and sell them to our affiliate under the Development Agreement
for the production of TCM, thereby providing a reliable supply of raw materials combined with the financial assurance of being paid up-front rather
than being paid depending upon the timing and amount of sales to purchasers of the TCM.
Ningbo Green-Health Pharmaceutical
Company Co., Ltd. is a leading manufacturer of food and drugs with substantially greater financial and other resources than ours. However, taxol-based
medicine is only one of Ningbo’s products and they do not produce any other yew-based products other than taxol-based medicine.
Plant and Equipment
The machinery and other equipment that
we use in making our products are manufactured, for the most part, in the PRC. We conduct our own maintenance of our machinery and equipment.
Replacement parts are relatively easy to obtain without delays as and when required, and are not subject to significant price
fluctuations.
Government Regulations
Certain parts of our business are
regulated under national, provincial and local laws in the PRC. The following information summarizes certain major regulations that apply to
us.
Regulations at the national, provincial
and local levels in the PRC are subject to change. To date, compliance with governmental regulations has not had a material impact on our earnings or
competitive
63
position, but, because of the evolving nature of such regulations, we are unable to predict the impact such regulation may have in the foreseeable future.
The growing and cultivation of yew
trees and manufacturing products from yew trees, is regulated by Forest Law and its Implementing Regulations, Rules on Permit for Felling of Forest
Trees, Regulations on Wild Plants Protection and other PRC laws and regulations. HDS received approval issued by the Department of Forestry of
Heilongjiang Province (Document No. 188) on October 25, 2003, allowing it to sell yew trees and manufacture handicrafts using yew timber. There is no
cost to the Company to maintain this approval. This approval has no expiration date.
As a foreign-invested enterprise, JSJ
is subject to the Foreign-Invested Enterprise Law (1986), as amended, and the Regulations of Implementation of the Foreign Investment Enterprise Law
(1990), as amended, both of which provide for incorporation, corporate governance, operation, business and other aspects of a foreign-invested
enterprise.
PRC resident shareholders of the
Company are required to complete foreign exchange registration with SAFE. In October 2005, SAFE issued the Notice on Issues Relating to the
Administration of Foreign Exchange in Fund-raising and Return Investment Activities of Domestic Residents Conducted via Offshore Special Purpose
Companies, or SAFE Circular 75, which became effective as of November 1, 2005, and was further supplemented by two implementation notices issued by the
SAFE on November 24, 2005, May 29, 2007 and July1, 2011, respectively. SAFE Circular 75 states that PRC residents, whether natural or legal persons,
must register with the relevant local SAFE branch prior to establishing or taking control of an offshore entity established for the purpose of overseas
equity financing involving onshore assets or equity interests held by them.
In 2006, six PRC regulatory agencies
jointly adopted the M&A Rule. The M&A Rule requires that, if an overseas company established or controlled by PRC domestic companies or
citizens intends to acquire equity interests or assets of any other PRC domestic company affiliated with the PRC domestic companies or citizens, such
acquisition must be submitted to the Ministry of Commerce, rather than local regulators, for approval. In addition, this regulation requires that an
overseas company controlled directly or indirectly by PRC companies or citizens and holding equity interests of PRC domestic companies needs to obtain
the approval of the CSRC prior to listing its securities on an overseas stock exchange. On September 21, 2006, the CSRC published a notice on its
official website specifying the documents and materials required to be submitted by overseas special purpose companies seeking CSRC’s approval of
their overseas listings.
Environmental Issues
Our operations are subject to various
pollution control regulations with respect to noise, water and air pollution and the disposal of waste and hazardous materials. We are also subject to
periodic inspections by local environmental protection authorities. Our operating facilities have received certifications from the relevant PRC
government agencies in charge of environmental protection indicating that the operations are in compliance with the relevant PRC environmental laws and
regulations.
We believe that we are in substantial
compliance with all environmental laws and regulations applicable to our business. We are not currently subject to any pending actions alleging any
violations of applicable PRC environmental laws.
Corporate Structure and
Recapitalization
First Restructure
HDS was incorporated under the laws of
the PRC on August 22, 1996. On April 17, 2003, HDS was privatized when the original shareholder of HDS, the State Forest Fire Control Research and
Development Fund Heilongjiang Management Team, transferred its shares in HDS to a company controlled by Zhiguo Wang and his wife, Guifang
Qi.
On November 28, 2003, the registered
capital of HDS was increased from RMB 500,000 to RMB 30,000,000 and the number of shareholders of HDS increased to 35, including 34 individual
shareholders and
64
one entity shareholder. On June 28, 2008, 29 individual shareholders of HDS transferred their shares in HDS to Mr. Wang and one individual shareholder transferred its shares in HDS to Xingming Han, and there was an increase of the registered capital of HDS from RMB 30,000,000 to RMB 45,000,000, the balance of which was paid by Mr. Wang in the amount of RMB 10,500,000 and HEFS in the amount of RMB 4,500,000.
Until February 23, 2010, HDS was owned
by Zhiguo Wang (62.81%), his wife Guifang Qi (18.53%), Xingming Han (4.82%), a PRC individual named Yingjun Jiang (3.22%) and HEFS (10.62%). Mr. Wang,
Madame Qi, Mr. Han, Mr. Jiang and HEFS are collectively referred to as the Original Shareholders. Mr. Wang is the President and a director of the
Company. Madame Qi is the wife of Mr. Wang and an officer and director of the Company. Mr. Han is an officer and director of the Company. HEFS is owned
primarily by Mr. Wang and Madame Qi.
YBP was incorporated under the laws of
Nevada on November 13, 2007. On October 29, 2009, YBP established a wholly-owned subsidiary, JSJ, incorporated in the PRC, as part of a reorganization
of the Company, or the First Restructure.
Also on October 29, 2009, the Harbin
Economic Cooperation and Promotion Bureau, or HECPB, approved JSJ to become a wholly-owned foreign enterprise, or WOFE, of YBP. HECPB is a governmental
department of the City of Harbin with responsibility for business and economic cooperation and development in the city. According to the website of
HECPB, it was established by the People’s Government of Harbin in 2004 and is in charge of issuing approvals and related documents to foreign
companies with investments in Harbin. HECPB may be regarded as a municipal counterpart to and acting under grant of authority from MOFCOM, which has
the ultimate authority with respect to matters pertaining to businesses operating in the PRC, including foreign ownership of businesses and
WOFEs.
Pursuant to the First Restructure, on
February 23, 2010, the Company, through JSJ, entered into an Equity Transfer Agreement, referred to collectively as the First Transfer Agreements, with
each of the Original Shareholders. Pursuant to the First Transfer Agreements, the terms of which are substantially identical to each other, the
Original Shareholders transferred all of their respective ownership in HDS to JSJ for an aggregate RMB 45,000,000, which amount represents the amount
of the then registered capital of HDS. As a result of this transaction, HDS became a wholly-owned subsidiary of JSJ.
JSJ and the Original Shareholders also
entered into a Supplemental Agreement dated February 26, 2010, or the First Supplemental Agreement, pursuant to which JSJ had the right to put the
shares of HDS back to the Original Shareholders for the original purchase price of an aggregate RMB 45,000,000, in the event that the transaction did
not close or PRC governmental approval was not received, within six months following the execution of the First Transfer Agreements.
As a result of the First Restructure,
as described above, the organization of the Company looked as follows:
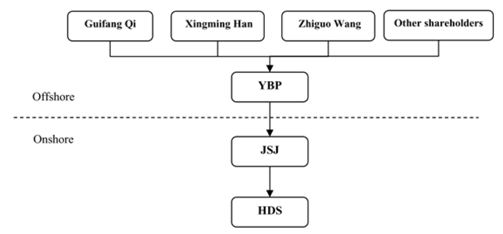
65
On May 10, 2010, JSJ, Mr. Wang, Mr.
Jiang and HEFS entered into a Debtor’s and Creditors’ Rights Agreement, or the Creditors’ Agreement, pursuant to which Mr. Jiang and
HEFS assigned their rights, including the right to be paid for the HDS shares transferred by them to JSJ, under their respective First Transfer
Agreements, to Mr. Wang, and Mr. Wang assumed the obligations of Mr. Jiang and HEFS under their respective First Transfer Agreements.
Before, during and after the First
Restructure, Mr. Wang, Madame Qi and Mr. Han served as the sole directors and principal executive officers of the Company, other than the position of
CFO.
Second Restructure
In October 2010, the Company
determined, in consultation with its professional advisors, that the First Restructure did not meet certain technical PRC legal requirements and that
the Company would need to be further reorganized, or the Second Restructure. Accordingly, on October 28, 2010, JSJ and each of the HDS Shareholders
entered into new Equity Transfer Agreement, referred to collectively as the Second Transfer Agreements, the terms of which are substantially identical
to each other, pursuant to which 100% of the common stock of HDS was transferred by JSJ back to the HDS Shareholders for aggregate consideration of RMB
45,000,000. Since the consideration of RMB 45,000,000 due to the HDS Shareholders in the First Restructure had not yet been paid, pursuant to a
Supplemental Agreement to the Second Equity Transfer Agreements dated February 16, 2011, the aggregate RMB 45,000,000 amount payable by the HDS
Shareholders to JSJ for the return of their HDS common stock in respect of the Second Restructure, was offset against JSJ’s liability to the HDS
Shareholders in the same aggregate amount in respect of the First Transfer Agreements, which amount had not yet been paid by JSJ.
As discussed above, Mr. Jiang and HEFS
had assigned to Mr. Wang their respective rights and obligations vis-a-vis JSJ resulting from the First Restructure, pursuant to the First Supplemental
Agreement and the Creditors’ Agreement, since as of such time Mr. Jiang and HEFS had not yet been paid for the transfer of their interests in HDS
to JSJ in the First Restructure in the amount of 3.22% and 10.62% of HDS’s equity interest, respectively. Therefore, in the Second Restructure,
pursuant to the Second Transfer Agreements, JSJ transferred to Mr. Wang not only his previous shareholdings in HDS before the First Restructure
(representing 62.81% of HDS’s total equity), but also an additional 13.84% of the equity in HDS as a result of Mr. Wang’s being assigned Mr.
Jiang’s 3.22% equity interest in HDS and HEFS’s 10.62% equity interest in HDS.
After the foregoing transactions were
completed, the HDS Shareholders then owned 100% of the shares of HDS in the following percentages:
Mr. Wang
|
76.65 | % | ||||
Madame Qi
|
18.53 | % | ||||
Mr. Han
|
4.82 | % |
On November 5, 2010, JSJ entered into a
series of contractual arrangements, or the Contractual Arrangements, with HDS and/or the HDS Shareholders, as described below:
• |
Exclusive Business Cooperation Agreement. Pursuant to the Exclusive Business Cooperation Agreement between JSJ and HDS, or the Business Cooperation Agreement, JSJ has the exclusive right to provide to HDS general business operation services, including advice and strategic planning, as well as consulting services related to technology, research and development, human resources, marketing and other services deemed necessary, or collectively referred to as the Services. Under the Business Cooperation Agreement, JSJ has exclusive and proprietary rights and interests in all rights, ownership, interests and intellectual properties arising out of or created during the performance of the Business Cooperation Agreement, including but not limited to copyrights, patents, patent applications, software and trade secrets. HDS shall pay to JSJ a monthly consulting service fee, or the Service Fee, in RMB that is equal to 100% of the monthly net income of HDS. Upon the prior written consent by JSJ, the rate of Service Fee may be adjusted pursuant to the operational needs of HDS. Within 30 days after the end of each month, HDS shall (a) deliver to JSJ the management accounts and operating statistics of HDS for such month, including the net income of HDS during |
66
| such month, or the Monthly Net Income, and (b) pay 80% of such Monthly Net Income to JSJ, each such payment referred to as a Monthly Payment. Within ninety (90) days after the end of each fiscal year, HDS shall (a) deliver to JSJ financial statements of HDS for such fiscal year, which shall be audited and certified by an independent certified public accountant approved by JSJ, and (b) pay an amount to JSJ equal to the shortfall, if any, of the aggregate net income of HDS for such fiscal year, as shown in such audited financial statements, as compared to the aggregate amount of the Monthly Payments paid by HDS to JSJ in such fiscal year. HDS also granted an irrevocable and exclusive option to JSJ to purchase any and all of the assets of HDS, to the extent permitted under PRC law, at the lowest price permitted by PRC law. Unless earlier terminated in accordance with the provisions of the Business Cooperation Agreement or other agreements separately executed between JSJ and HDS, the Business Cooperation Agreement is for a term of ten years and expires on November 5, 2020; however, the term of the Business Cooperation Agreement may be extended if confirmed in writing by JSJ prior to the expiration of the term thereof. The period of the extended term shall be determined exclusively by JSJ and HDS shall accept such extended term unconditionally. Unless JSJ commits gross negligence, or a fraudulent act, against HDS, HDS shall not terminate the Business Cooperation Agreement prior to the expiration of the term, including any extended term. Notwithstanding the foregoing, JSJ shall have the right to terminate the Business Cooperation Agreement at any time upon giving 30 days’ prior written notice to HDS. |
• |
Exclusive Option Agreement. Under an Exclusive Option Agreement among JSJ, HDS and each HDS Shareholder, individually referred to as an Option Agreement, the terms of which are substantively identical to each other, each HDS Shareholder has granted JSJ or its designee the irrevocable and exclusive right to purchase, to the extent permitted under PRC law, all or any part of the HDS Shareholder’s equity interests in HDS, or the Equity Interest Purchase Option, for RMB 10. If an appraisal is required by PRC laws at the time when and if JSJ exercises the Equity Interest Purchase Option, the parties shall negotiate in good faith and, based upon the appraisal, make a necessary adjustment to the purchase price so that it complies with any and all then applicable PRC laws. Without the consent of JSJ, the HDS Shareholders shall not sell, transfer, mortgage or dispose of their respective shares of HDS stock. Additionally, without the prior consent of JSJ, the HDS Shareholders shall not in any manner supplement, change or amend the articles of association and bylaws of HDS, increase or decrease its registered capital, change the structure of its registered capital in any other manner, or engage in any transactions that could materially affect HDS’ assets, liabilities, rights or operations, including, without limitation, the incurrence or assumption of any indebtedness except incurred in the ordinary course of business, execute any major contract over RMB 500,000, sell or purchase any assets or rights, incur of any encumbrance on any of its assets or intellectual property rights in favor of a third party or transfer of any agreements relating to its business operation to any third party. The term of each Option Agreement is ten years commencing on November 5, 2020 and may be extended at the sole election of JSJ. |
• |
Equity Interest Pledge Agreement. In order to guarantee HDS’s performance of its obligations under the Business Cooperation Agreement, each HDS Shareholder, JSJ and HDS entered into an Equity Interest Pledge Agreement, individually referred to as a Pledge Agreement, the terms of which are substantially similar to each other. Pursuant to the Pledge Agreement, each HDS Shareholder pledged all of his or her equity interest in HDS to JSJ. If HDS or the HDS Shareholders breach their respective contractual obligations and such breach is not remedied to the satisfaction of JSJ within 20 days after the giving of notice of breach, JSJ, as pledgee, will be entitled to exercise certain rights, including the right to foreclose upon and sell the pledged equity interests. During the term of the Pledge Agreement, the HDS Shareholder shall not transfer his or her equity interest in HDS or place or otherwise permit any other security interest of other encumbrance to be placed on such equity interest. Upon the full payment of the Service Fee under the Business Cooperation Agreement and upon the termination of HDS’s obligations thereunder, the Pledge Agreement shall be terminated. |
• |
Power of Attorney. Under a Power of Attorney executed by each HDS Shareholder, individually referred to as a Power of Attorney, the terms of which are substantially similar to each other, JSJ has |
67
| been granted an exclusive, irrevocable power of attorney to take actions in the place and stead of the HDS Shareholder, to act on behalf of the HDS Shareholder as his or her exclusive agent and attorney with respect to all matters concerning the HDS Shareholder’s equity interests in HDS, including without limitation, the right to: 1) attend shareholders’ meetings of HDS; 2) exercise all the HDS Shareholder’s rights, including voting rights under PRC laws and HDS’s Articles of Association, including but not limited to the sale or transfer or pledge or disposition of the HDS Shareholder’s equity interests in HDS in whole or in part; and 3) designate and appoint on behalf of the HDS Shareholder the legal representative, executive director, supervisor, manager and other senior management of HDS. |
On November 29, 2010, YBP established a
wholly-owned subsidiary, Yew HK, a limited liability company incorporated under the laws of Hong Kong. On January 26, 2011, YBP transferred its
ownership in JSJ to Yew HK. As a result of the Second Restructure, HDS is considered a VIE, and YBP, as the sole shareholder of Yew HK and the ultimate
parent company, is the controlling entity of HDS.
On April 15, 2011, Mr. Wang, Madame Qi
and Mr. Han completed an updated registration with the State Administration of Foreign Exchange, or SAFE, pursuant to the requirements under SAFE
Circular 75.
As a result of the Second Restructure,
as described above, the organization of the Company now looks as follows:
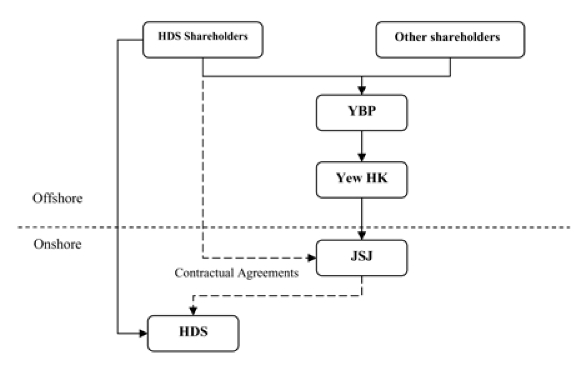
As of November 30,
2012, the HDS Shareholders collectively owned 22,805,512 shares, or approximately 45.61%, of YBP’s common stock, or the HDS Shareholders’
Stock. Before, during and after the Second Restructure, the HDS Shareholders served as the sole directors and principal executive officers of the
Company, other than the position of CFO.
While we have not discovered any
precedent under Nevada law for a transaction like the Second Restructure, it is possible that the Second Restructure should have been approved by
YBP’s shareholders because it may be viewed as having involved the sale of all or substantially all of YBP’s assets in that the stock of HDS
was transferred from a wholly-owned subsidiary, JSJ, to the HDS Shareholders. However, because the Company was not yet subject to the reporting
obligations of the Exchange Act, YBP was unable to issue a proxy statement that complied with SEC proxy rules to its shareholders in connection with
such approval. Once the Company became subject to the reporting obligations of the Exchange Act, it sought and obtained
shareholder ratification of the Second Restructure and all of the transactions contemplated and effected in connection therewith at the Special Meeting
on December 13, 2012. While we believe that it is unclear if the Second Restructure required shareholder approval under Nevada law, we also
believe that since the Second Restructure has been ratified by our shareholders, any possible concerns about the manner by which the
Second Restructure was approved under Nevada law has been alleviated, since we believe that the
68
Nevada Corporations Law allows for shareholder ratification after-the-fact of transactions requiring shareholder approval. See “Certain Relationships and Related Transactions, and Director Independence”.
Recapitalization
Generally, the founders of a
corporation in the United States receive shares of stock in consideration of the tangible and intangible assets contributed by them to the enterprise.
Since the consideration for those shares is the transfer of assets, including intellectual property, and business know-how, sometimes referred to as
“sweat equity”, no cash payment for such shares occurs.
However, unfamiliar with the usual way
that founders acquire equity interests in corporations in the United States, the HDS Shareholders both contributed assets to the Company and actually
purchased their HDS Shareholders’ Stock between March 2008 and September 2009, for cash, in a series of four different offerings of YBP common
stock during that period, at prices ranging between $0.02 and $0.10 per share, for an aggregate purchase price of $966,501.
As a result of the Contractual
Arrangements of the Second Restructure, in which all of the profits of HDS will be paid under the terms of the Business Cooperation Agreement to JSJ,
which is an indirect wholly-owned subsidiary of YBP, combined with the actual purchase by the HDS Shareholders of the HDS Shareholders’ Stock for
cash, it could be viewed that Mr. Wang, Madame Qi and Mr. Han have, in effect, paid for their HDS Shareholders’ Stock twice.
Accordingly, the Company
rectified this situation by obtaining shareholder approval at the Special Meeting on December 13, 2012 to issue a stock purchase option,
each referred to as a Founder’s Option and collectively referred to as the Founders’ Options, to each of Mr. Wang, Madame Qi and Mr. Han in
an amount equal to the number of shares of YBP common stock that each of them then currently owned. The terms of the
Founders’ Options are identical to each other except for the name of the optionee and the number of shares of YBP common
stock subject to each such Founder’s Option. Those terms include:
• |
The issuance of the Founders’ Options was subject to pre-issuance approval by our shareholders, which approval was obtained at the Special Meeting; |
• |
Each Founder’s Option was fully vested upon issuance; |
• |
Each Founder’s Option is exercisable for a period of five years; |
• |
Each Founder’s Option has a per share exercise price equal to the fair market value of a shares of YBP common stock on the date of grant, or $0.22 per share; and |
• |
Each Founder’s Option has a cashless exercise feature, pursuant to which, at the optionee’s election, he or she may choose to deliver previously-owned shares of YBP common stock in payment of the exercise price or not pay the exercise price of the Founder’s Option and receive instead a reduced number of shares of YBP common stock reflecting the value of the number of shares of YBP common stock equal to the difference, if any, between the aggregate fair market value of the shares issuable upon exercise of the Founder’s Option and the exercise price of the Founder’s Option. |
The number of shares of YBP common
stock subject to each Founder’s Option is as follows:
| Number of Optionee |
Number of Shares Subject to Founder’s Option |
|||||
|---|---|---|---|---|---|---|
Zhioguo Wang
|
20,103,475 | |||||
Guifang Qi
|
2,488,737 | |||||
Xingming Han
|
213,300 | |||||
69
The terms of the Founders’ Options
have not been determined as a result of arm’s-length negotiations. The Board of Directors of YBP, which consists of the same persons who are the
HDS Shareholders and the grantees of the Founders’ Options, obtained shareholder approval of the issuance of the Founders’ Options
at the Special Meeting on December 13, 2012.
To the extent that the Founders’
Options are exercised, the number of shares of YBP common stock then held by each HDS Shareholder could as much as double, which would be highly
dilutive to the other existing YBP shareholders. The following chart shows the maximum effect of this dilution assuming full exercise of each
Founder’s Option for cash:
| Shareholder |
Number Shares Presently Held |
Percentage of Issued Shares Presently Held |
Number Shares Held Assuming Exercise of All Founders’ Options |
Percentage of Issued Shares Following Exercise of All Founders’ Options |
||||||||||||||
|---|---|---|---|---|---|---|---|---|---|---|---|---|---|---|---|---|---|---|
Zhiguo Wang
|
20,103,475 | 40.21 | % | 40,206,950 | 55.23 | % | ||||||||||||
Guifang Qi
|
2,488,737 | 4.98 | % | 4,977,474 | 6.84 | % | ||||||||||||
Xingming Han
|
213,300 | 0.43 | % | 426,600 | 0.59 | % | ||||||||||||
All HDS
Shareholders as a group (3 persons) |
22,805,512 | 45.61 | % | 45,611,024 | 62.65 | % | ||||||||||||
All other
existing shareholders |
27,194,488 | 54.39 | % | 27,194,488 | 37.35 | % | ||||||||||||
Total
|
50,000,000 | 100.00 | % | 72,805,512 | 100.00 | % | ||||||||||||
See “Certain Relationships and
Related Transactions, and Director Independence”.
Employees
As of September 30, 2012, we had
approximately 80 employees, of whom approximately 41 were full-time employees and approximately 39 were part-time employees. Of these employees, all
full-time employees and all but two part-time employees were employed in the PRC. Our employees belong to a trade union. We believe that we maintain
good labor relations with our employees.
We believe that we are current in
making required social insurance payments for our employees. However, we have not paid into a housing fund for our employees, as required under
relevant PRC laws and regulations. The unpaid amount is approximately RMB 40,000 at December 31, 2011 and RMB 60,000at September 30, 2012 and there is
an additional penalty of up to RMB 50,000 that we are required to pay for our failure to make this contribution in a timely manner.
About Harbin
Harbin is the capital of Heilongjiang
Province in Northeast China, an area sometimes referred to in the West as Manchuria. The city lies in southern Heilongjiang Province, on the
southeastern edge of the Songnen Plain and the southern bank of the Songhua River. Harbin is the tenth largest city in the PRC, with a population of
approximately 9.9 million people. It serves as a key political, economic, scientific, cultural, communications and transportation hub in Northeastern
China. Harbin is one of the largest railway hubs in Northeast China, with five major railways (Jingha, Binsui, Binzhou, Binbei and Labin) meeting
here.
Harbin enjoys a diversified economy,
including light industry, textile, medicine, foodstuff, automobile, metallurgy, electronics, building materials and chemicals. The Harbin International
Economic and Trade Fair has been held annually since 1990 and is one of the largest foreign trade fairs authorized by the Chinese government. The fair
attracts exhibitors and visitors from throughout Asia, including Japan and Korea, and other important regional countries, including
Russia.
Harbin has a continental climate with
hot, humid summers and extremely cold, dry and sunny winters. Both spring and fall are short transition seasons. Average annual precipitation is low,
at 20.6 inches, and is heavily concentrated from May to September. Harbin’s climate is favorable for growing yew trees.
The modern city of Harbin originated in
1898 from a small village, with the start of the construction of the Chinese Eastern Railway by Russia, an extension of the Trans-Siberian Railway,
shortcutting substantially
70
the distance to Vladivostok and creating a link to the Chinese port city of Dalian and the Russian Naval Base at Port Arthur.
With the establishment of the Japanese
puppet state of Manchukuo, Japanese troops occupied Harbin on February 4, 1932. The Soviet Army took the city on August 20, 1945 and transferred the
city’s administration to the Chinese People’s Liberation Army in April 1946.
Properties
Office and Retail Space
The principal executive offices of YBP
are located at 294 Powerbilt Avenue, Las Vegas, Nevada, a property owned by the Company’s President, Zhiguo Wang, which he provides rent-free to
the Company. However, we pay utilities, property insurance, real estate tax, association dues and certain other expenses on the property to third
parties, which, in 2011, aggregated approximately $9,830. See “Certain Relationships and Related Transactions, and Director Independence”.
None of YBP, Yew HK or JSJ owns or rents any properties.
HDS leases office space in the
Xiangfang District of Harbin from the Company’s President, Zhiguo Wang, under a 15-year lease commencing January 1, 2010 and expiring December 31,
2025. We pay rent in the amount of RMB 15,000 per year. We believe that the rent is at or below market for the space we are occupying. See
“Certain Relationships and Related Transactions, and Director Independence”.
HDS leases approximately 40 square
meters of usable retail space in the Nangang District of Harbin from Guifang Qi, a director of the Company and the wife of Zhiguo Wang. Pursuant to a
Lease Contract dated December 3, 2008, the premises were provided rent-free for the first year of the three-year lease. Beginning December 3, 2009, we
paid rent in the amount of RMB 12,000 per year for the second and third years of the lease term. We entered into the current lease on these premises on
November 15, 2011. The term of the new three-year lease is from December 1, 2011 through December 1, 2014. We pay rent in the amount of RMB 1,300 per
month (RMB 15,600 per year), payable annually on or before May 30 of each year of the term. We believe that the rent is at or below market for the
space we are occupying. We closed the store in December 2012, although we continue to lease the facility to exhibit and warehouse our finished
products. See “Certain Relationships and Related Transactions, and Director Independence”.
HDS leases approximately 3,886 square
meters of office space in Beichuan Village from Heilongjiang Pingshan Yew Comprehensive Development Co., Ltd., or Pingshan, under a 23-year lease
commencing March 20, 2002 and expiring March 19, 2025. We pay rate an annual rate of RMB 25,000 for each year of the terms as follows: RMB 250,000 on
or before December 31, 2012 for the first ten years of the term; RMB 125,000 on or before December 31, 2017 for the next five years of the term; and a
final payment of RMB 175,000 on or before the end of the term for the remaining seven years of the term. We made the first payment covering the first
ten years of rent in the amount of RMB 250,000 in February 2012.
71
Land Use and Similar Agreements
There is no private ownership of land
in the PRC. Land is owned by the government and the government grants land use rights for specified terms. Therefore, we have entered into several
long-term agreements to use land and/or cultivate yew trees on such land, as summarized in the following table:
| Date of Agreement |
Transferor (Lessor) |
Location |
Land Use Area |
Term |
||||||||||||||
|---|---|---|---|---|---|---|---|---|---|---|---|---|---|---|---|---|---|---|
March 21,
2004 |
Wuchang City Forestry Bureau |
Wuchang City |
1,000,000 mu |
30 years |
||||||||||||||
March 22,
2004 |
Changshan Niu |
Beichuan Village, Pingshan Town |
125
mu |
50 years |
||||||||||||||
April 4,
2004 |
Pingshan Town Government (Beichuan Village Committee) |
Beichuan Village, Pingshan Town |
400
mu(1) |
50 years |
||||||||||||||
March 25,
2005 |
ZTC |
Lalin
Town, Wuchang City |
361
mu |
30 years |
||||||||||||||
January 18,
2008 |
Shukun Jiang and Shubao Jiang |
Pinshan Dalazi Mountain |
290
mu |
50 years |
||||||||||||||
March 4,
2010 |
Heilongjiang Pingshan Yew Comprehensive Development Co., Ltd. |
Pingfangdian |
15,865 mu |
45 years |
||||||||||||||
July 18,
2012 |
Huazhong Liu |
Beizhao Village, Hongxing Town, A’cheng District |
117.5
mu |
16 years |
||||||||||||||
(1) |
This agreement provides for 400 mu, which is the total usable area subject to the agreement. A survey completed after the agreement was entered into concluded that a total of 955 mu is covered by the agreement, to which the parties have agreed. |
On March 21, 2004, we entered into the
Joint Venture Agreement with the Wuchang Forestry Bureau, pursuant to which the Wuchang Forestry Bureau has given us access to 1,000,000 mu
(approximately 166,667 acres) of forest land located in Wuchang City to develop yew tree forests and produce yew seedlings. The Wuchang Forestry Bureau
has also granted us land to use for two nurseries, of 400 mu (approximately 67 acres) and 1400 mu (approximately 233 acres), respectively, to cultivate
yew tree seedlings. Pursuant to the Joint Venture Agreement, we have permission to plant yew trees on this land from 2004 to 2034. Any profits from the
planting of yew trees and other agriculture shall be distributed 80% to the Company and 20% to the Wuchang Forestry Bureau. We have not yet cultivated
this land or generated any revenue under the Joint Venture Agreement.
Under an agreement dated March 22,
2004, we lease from one individual 125 mu (approximately 21 acres) of land in Beichuan Village, Pingshan Town, A’cheng City, Heilongjiang
Province. We made a one-time payment to the lessor in the amount RMB 552,500 under this lease, which has a term of 50 years.
Under an agreement dated April 4, 2004,
we lease from Pingshan Town Government (Beichuan Village Committee) 400 mu (approximately 67 acres) of barren hill and uncultivated land in Beichuan
Village, Heilongjiang Province, for a term of 50 years. We made a one-time payment of RMB 1,003,000 under this agreement. Based on surveying undertaken
jointly between HDS and the Beichuan Village Committee, we have agreed that the land subject to this agreement actually comprises 955 mu (approximately
159 acres), although only 400 mu is usable land. At the end of the 50-year term of this agreement, we will retain the right to use the land without
making further payments.
72
Under an agreement dated March 25, 2005
with ZTC, we lease 361 mu (approximately 60 acres) of land in Lalin Town, Wuchang City, Heilongjiang Province, for nursery land used to cultivate yew
stock. This agreement is for a term of 30 years expiring on March 24, 2035, after which term the right of land use shall be transferred to us. Under
this agreement, we pay RMB 162,450 per year, with a lump sum payment of RMB 812,250 representing the first five years of the lease on or before
December 31, 2010. We made a payment in the amount of RMB 1,000,000 in March 2012. Thereafter, we are required to pay each next five years’ rent
in advance. Mr. Wang and Madame Qi are the principal owners of ZTC. See “Certain Relationships and Related Transactions, and Director
Independence”.
Under an agreement dated January 18,
2008, we lease from two individuals approximately 290 mu (approximately 48 acres) and the building thereon, on the north side of Dabeilazi Mountain
located in Pingshan Town, Heilongjiang Province. We paid RMB 2,370,000 for the use of the land, the yew trees thereon and the buildings thereon. We own
the trees and buildings and lease the land. The lease has a term of 50 years. At the end of the 50-year term of this agreement, we will retain the
right to use the land without making further payments.
Under an agreement dated March 4, 2010,
we lease from Pingshan 15,865 mu (approximately 2,644 acres) of land in Beichuan Village, Pingshan Town, A’Cheng District, for a term of 45 years
expiring on March 4, 2055, and purchased all the yews situated thereon. We are required to make total payments of RMB 80,152,900 to Pingshan. The total
payment has been divided into three installments, each installment representing a parcel of land. In 2010, we made payments in two installments
aggregating RMB 42,434,000 (approximately $6,300,000), for a parcel of 10,720 mu and all the yew trees and seedlings situated thereon and had a balance
due of RMB 37,718,900 as of December 31, 2010, of which amount RMB 26,314,300 (approximately $4,100,000) related to the final parcel of 5,145 mu.
Subsequent to December 31, 2010, we acquired the remaining 5,145 mu and made payments aggregating RMB 31,579,600 (approximately $4,700,000), leaving a
balance of RMB 6,139,300 (approximately $1,000,000).
On July 18, 2012, we entered into the
Fuye Field Agreement with an individual in the PRC. Pursuant to the Fuye Field Agreement, HDS will lease 117.5 mu (approximately 19.6 acres) located at
Fuye Field, Beizhao Village, Hongxing Town, A’cheng District in Helongjiang Province, PRC. The term of the agreement is 16 years, through March
2028. During the term of the Fuye Field Agreement, HDS has the right to develop the property for the production of yew trees. In addition, HDS has
acquired a building and more than 80,000 trees — which are not yew trees — located on the property. These trees consist of approximately
20,000 larix, 56,700 spruce and 3,700 poplar trees.
Payments to be made by the Company
under the Fuye Field Agreement total RMB 15,002,300, payable as follows:
• |
RMB 6,300,000 upon receipt by HDS of all related supporting documents and materials on the ownership and land use right of the property |
• |
RMB 3,700,000 on December 25, 2012 |
• |
RMB 5,002,300 on or before December 25, 2013. |
The Company prepaid the first
installment of RMB 6,300,000 on or about June 20, 2012 and presently expects to be able to make the additional payments required by the Fuye Field
Agreement from cash-on-hand and net cash flow from operations.
Litigation
From time to time, we may become
involved in various lawsuits and legal proceedings, which arise, in the ordinary course of business. However, litigation is subject to inherent
uncertainties, and an adverse result in these or other matters may arise from time to time that may harm our business. We are currently not aware of
any such legal proceedings or claims that we believe will have a material adverse effect on our business, financial condition or operating
results.
73
Our directors and executive officers
and additional information concerning them are as follows:
| Name |
Age |
Position |
||||||||
|---|---|---|---|---|---|---|---|---|---|---|
Zhiguo Wang
|
50 |
Chief Executive Officer, President, Secretary and Chairman of the Board |
||||||||
Adam Wasserman
|
48 |
Chief Financial Officer |
||||||||
Guifang Qi
|
50 |
Treasurer-YBP and Director |
||||||||
Xingming Han
|
47 |
General Manager-HDS and Director |
||||||||
Zhiguo Wang has been the
President and a director of YBP since the company was incorporated in November 2007, and has been the Secretary of YBP since January 2010. Mr. Wang
founded our company in 1996 and has served as Chairman of the Board and General Manager of HDS since its inception. Since August 2007, Mr. Wang has
served as executive director of the China National Forest Industry Association. In January 2007, he was elected to the first board of directors by the
Heilongjiang Province Pharmaceutical Professional Association. In August 2007, he was elected Executive Director of the China National Forest Industry
Association. In December 2010, Mr. Wang was elected vice chairman of the Heilongjiang Province Forestry Industry Association. Mr. Wang is also involved
in the management of other businesses, including Yew Pharmaceutical, Kairun and ZTC. He currently devotes approximately 71% of his time, or 120 hours
per month, on average, to the Company’s business. Mr. Wang graduated from Northeast Forestry University, located in Harbin, for both his
undergraduate and graduate degrees. Mr. Wang is the husband of Guifang Qi.
Adam Wasserman has been our
chief financial officer since September 2011. He is chief executive officer for CFO Oncall, Inc. and CFO Oncall Asia, Inc., collectively referred to as
CFO Oncall, in which he owns 80% and 60% of such businesses, respectively. CFO Oncall provides chief financial officer services to various companies.
Currently, Mr. Wasserman also serves as the Chief Financial Officer of Oriental Dragon Corp since June 2010, and Apps Genius Corp since January 2011
and other U.S listed public companies. Mr. Wasserman also served as Chief Financial Officer for Gold Horse International, Inc. from July 2007 to
September 2011, Cleantech Solutions International, Inc. in 2007 and 2008, Transax International Limited from May 2005 to December 2011, and other
companies all under the terms of consulting agreements with CFO Oncall. Mr. Wasserman holds a Bachelor of Science from the State University of New York
at Albany. He is a member of The American Institute of Certified Public Accountants, is a director, treasurer and an executive board member of Gold
Coast Venture Capital Association and is a director of CD International Enterprises, Inc. since January 2010.
Guifang Qi has been the
Treasurer of YBP since May 2010 and a director of YBP since December 2010. Since 1997, she has also served as Vice General Manager of HDS in charge of
purchasing and suppliers. Madame Qi graduated from Mudanjiang Forestry School, located in Mudanjiang, Heilongjiang Province, where she majored in
forestry. Madame Qi is the wife of Zhiguo Wang.
Xingming Han has been a director
of YBP since May 2010. From 2000 to 2009, he has also served as Vice General Manager of HDS, and since 2009 as the General Manager of HDS, in charge of
manufacturing. He also served as the General Manager of Yew Pharmaceutical from 2008 to 2010. Mr. Han graduated from Harbin Architectural Engineering
College in Harbin. In December 2006, he received the qualification of China Senior Business Manager.
During the past ten years, there have
been no events under any bankruptcy act, no criminal proceedings and no judgments, injunctions, orders or decrees material to the evaluation of the
ability and integrity of any director, executive officer, promoter or control person of the Company, including any allegations (not subsequently
reversed, suspended or vacated), permanent or temporary injunction, or any other order of any federal or state authority or self-regulatory
organization, relating to activities in any phase of the securities, commodities, banking, savings and loan, or insurance businesses in connection with
the purchase or sale of any security or commodity, or involving mail or wire fraud in any business. None of our directors presently serves as a
director of any other public companies.
Each of our director’s primary
qualification to serve as such involves his or her extensive experience with different aspects of yew tree technology, cultivation, engineering and/or
project management.
74
Mr. Wang is the founder of the Company,
and formally educated and trained as an Engineer in Forestry and a Senior Engineer of Pharmaceutical Engineering. His specific experience,
qualifications, attributes and skills that led to the conclusion that he should serve as a director of the Company include the following. From 1984 to
1995, Mr. Wang developed and created the first artificial yew forest in the world, for which he received the Second Scientific and Technological
Progress Award for Heilongjiang Province in 1995. In 2002, Mr. Wang took part in, and took charge of, the research and development of Dakesu,
which was a project in the scientific and technological development program of Ministry of Science and Technology under the PRC’s Tenth Five-Year
Plan. In 2005, Mr. Wang took part in, and took charge of, the pre-clinical research of the new anti-cerebral ischemia marine vaccine
“Maitong” which was a project of the 863 Program under the PRC’s Tenth Five-Year Plan. On January 18, 2006, this project passed the
check and acceptance of the Ministry of Science and Technology. In 2006, Mr. Wang took part in, and took charge of, clinical research of the sea
cucumber polysaccharide vaccine, which was also an 863 Program under the PRC’s Eleventh Five-Year Plan”. In 2006, the extract from plants of
taxus species and the extracting method and the application of the extract (taxus injection solution) researched and developed by Mr. Wang received a
patent issued by SIPO.
Mr. Wang has received numerous awards
for his work in yew tree development, cultivation and cloning, and related fields. Among them, in 2002, he received the gold award of Century Cup in
Academic Exchange Conference about China’s Entry Into WTO, High and New Pharmaceutical Technology and Chinese Traditional Medicine Development. On
December 28, 2007, he was granted “Contribution Award of Guangcai Program and Land Forestation” by Ministry of Forestry, All-China Federation
of Industry and Commerce and China Society for Promotion of Guangcai Program.
The specific experience,
qualifications, attributes and skills that led to the conclusion that Madame Qi should serve as a director of the Company include her background as a
technician in the Weihe Forestry Administration, located in Heilongjiang Province, the province where the Company’s operations are located.
Additionally, Madame Qi was an integral part of an asexual cultivation and cloning technology of the yew trees project from 1984 to 1995. She was in
charge of project organization and implementation, and as well as documenting the auditing and result analysis of the project, giving her specific
experience in the Company’s patent technologies, in-depth knowledge of yew tree production technology and yew tree production costs
controls.
The specific experience,
qualifications, attributes and skills that led to the conclusion that Mr. Han should serve as a director of the Company include his education in civil
engineering and prior experience at Harbin Shangzhi Yimiaonpo Construction Company, or Yimiaonpo, where his responsibilities included engineer, vice
general manager and project manager. During his tenure at Yimiaonpo, Mr. Han was in charge of overall construction project progress, project safety,
and quality and cost controls. Mr. Han was responsible for establishing the national revitalizing Northeast old industrial base for breeding and
industrializing yew forest for medical use project in 2005 and he successfully led the project to pass national inspections. Mr. Han has developed,
organized and implemented a number of yew tree related projects at Harbin city and Heilongjiang provincial levels, which projects have passed
governmental inspections.
Involvement in Certain Legal Proceedings
None of our directors and officers has
not been convicted in a criminal proceeding, excluding traffic violations or similar misdemeanors, nor has been a party to any judicial or
administrative proceeding during the past ten years that resulted in a judgment, decree or final order enjoining the person from future violations of,
or prohibiting activities subject to, federal or state securities laws, or a finding of any violation of federal or state securities laws, except for
matters that were dismissed without sanction or settlement. There have been no events under any bankruptcy act, no criminal proceedings, no judgments,
injunctions, orders or decrees material to the evaluation of the ability and integrity of any of our directors, executive officers, promoters or
control persons during the past ten years.
75
The Summary Compensation Table shows
certain compensation information for services rendered in all capacities for the fiscal years ended December 31, 2011, 2010 and 2009. Other than as set
forth herein, no executive officer’s salary and bonus exceeded $100,000 in any of the applicable years. The following information includes the
dollar value of base salaries, bonus awards, the number of stock options granted and certain other compensation, if any, whether paid or
deferred.
Summary Compensation Table
| Name and Principal Position |
Year |
Salary ($) |
Bonus ($) |
Stock Awards ($) |
Option Awards ($) |
Non-equity incentive plan compensation ($) |
Non-qualified deferred compensation earnings ($) |
All other compensation ($) |
Total ($) |
|||||||||||||||||||||||||||||
|---|---|---|---|---|---|---|---|---|---|---|---|---|---|---|---|---|---|---|---|---|---|---|---|---|---|---|---|---|---|---|---|---|---|---|---|---|---|---|
Zhiguo Wang
President, |
2011 | 15,757 | — | — | — | — | — | — | 15,757 | |||||||||||||||||||||||||||||
Chief
Executive Officer |
2010 | 11,507 | — | — | — | — | — | — | 11,507 | |||||||||||||||||||||||||||||
| 2009 | 9,648 | — | — | — | — | — | — | 9,648 | ||||||||||||||||||||||||||||||
Adam
Wasserman (1) |
2011 | 40,000 | — | — | — | — | — | — | 40,000 | |||||||||||||||||||||||||||||
Chief
Financial Officer |
2010 | — | — | — | — | — | — | — | — | |||||||||||||||||||||||||||||
| 2009 | — | — | — | — | — | — | — | — | ||||||||||||||||||||||||||||||
Guifang Qi
|
2011 | 11,586 | — | — | — | — | — | — | 11,586 | |||||||||||||||||||||||||||||
Treasurer,
YBP and Vice |
2010 | 9,146 | — | — | — | — | — | — | 9,146 | |||||||||||||||||||||||||||||
General
Manager, HDS |
2009 | 7,894 | — | — | — | — | — | — | 7,894 | |||||||||||||||||||||||||||||
Xingming Han
|
2011 | 15,757 | — | — | — | — | — | — | 15,757 | |||||||||||||||||||||||||||||
General
Manager, HDS |
2010 | 11,212 | — | — | — | — | — | — | 11,212 | |||||||||||||||||||||||||||||
| 2009 | 6,856 | — | — | — | — | — | — | 6,856 | ||||||||||||||||||||||||||||||
Li Zhao (2)
|
2011 | 901 | — | — | — | — | — | — | 901 | |||||||||||||||||||||||||||||
Chief
Financial Officer |
2010 | 4,426 | — | — | — | — | — | — | 4,426 | |||||||||||||||||||||||||||||
| 2009 | 4,385 | — | — | — | — | — | — | 4,385 | ||||||||||||||||||||||||||||||
Shiyi Li (3)
|
2011 | 2,188 | — | — | — | — | — | — | 2,188 | |||||||||||||||||||||||||||||
Chief
Financial Officer |
2010 | N/A | — | — | — | — | — | — | N/A | |||||||||||||||||||||||||||||
| 2009 | N/A | — | — | — | — | — | — | N/A | ||||||||||||||||||||||||||||||
(1) |
Mr. Wasserman has served as CFO since September 1, 2011. |
(2) |
Ms. Zhao served as CFO from January 1, 2009 to March 10, 2011. |
(3) |
Shiyi Li served as CFO from March 10, 2011 to September 1, 2011. |
Employment Agreements
We have entered into employment
agreements with our Chinese executive officers in the form and with the provisions specified by the Harbin Labor and Social Security Bureau. The
provisions of these agreements are not negotiable and do not vary other than providing the term, title and salary of the individual
employee.
We had an employment agreement with Mr.
Wang, pursuant to which he is employed in the capacity of Chief Executive Officer, for a term of three years, commencing May 9, 2009 and terminating on
May 8, 2012. His contractually-provided compensation was RMB 7,000 per month for the entire term, although management increased his salary to RMB
10,000 per month from July 2011 through May 8, 2012. We entered into a new employment agreement with Mr. Wang for a three-year term, commencing May 10,
2012 and terminating on May 9, 2015. Mr. Wang’s compensation under the new agreement is RMB 10,000 per month.
We had an employment agreement with Mr.
Han, pursuant to which he is employed in the capacity of General Manager, for a term of three years, commencing April 9, 2009 and terminating on April
8, 2012. His
76
contractually-provided compensation was RMB 7,000 per month for the entire term, although management increased his salary to RMB 10,000 per month from July 2011 through April 8, 2012. We entered into a new employment agreement with Mr. Han for a three-year term, commencing April 10, 2012 and terminating on April 9, 2015. Mr. Han’s compensation under the new agreement is RMB 10,000 per month.
We had an employment agreement with
Madame Qi, pursuant to which she is employed in the capacity of Vice General Manager, for a term of three years, commencing April 9, 2009 and
terminating on April 8, 2012. Her contractually-provided compensation was RMB 4,500 per month for the entire term, although management increased her
salary to RMB 7,000 per month from July 2011 through April 8, 2012. We entered into a new employment agreement with Madame Qi for a three-year term,
commencing April 10, 2012 and terminating on April 9, 2015. Madame Qi’s compensation under the new agreement is RMB 5,000 per
month.
Effective September 1, 2011, Mr.
Wasserman, through CFO Oncall Asia, Inc. entered into an agreement, or the Wasserman Agreement, with us providing for his appointment as our Chief
Financial Officer of the Company for a period of one year. Pursuant to the Wasserman Agreement, Mr. Wasserman will receive a salary of $96,000 per
year, payable in equal monthly installments. Mr. Wasserman’s compensation is paid to CFO Oncall Asia, Inc., of which he serves as Chief Executive
Officer and in which he is the majority shareholder.
Outstanding Equity Awards at Fiscal
Year-End
As of December 31, 2012, the
following equity awards were outstanding, in the form of the Founders’ Options, to our named executive officers:
| Number of Optionee |
Number of Shares Subject to Founder’s Option |
|||||
|---|---|---|---|---|---|---|
Zhioguo
Wang |
20,103,475 | |||||
Guifang Qi
|
2,488,737 | |||||
Xingming
Han |
213,300 | |||||
We are authorized to issue up to
15,000,000 shares of common stock for grants under the 2012 Plan, which was adopted by our Board of Directors on September 25, 2012 and
approved by our shareholders at the Special Meeting on December 13, 2012. No grants have been made under the 2012 Plan to
date.
Bonuses and Deferred Compensation
We do not have any bonus, deferred
compensation or retirement plan. All decisions regarding compensation are determined by our board of directors.
Payment of Post-Termination Compensation
We do not have change-in-control
agreements with any of our directors or executive officers, and we are not obligated to pay severance or other enhanced benefits to executive officers
upon termination of their employment.
Board of Directors and Director Compensation
All directors hold office until the
next annual meeting of shareholders and until their successors have been duly elected and qualified. Officers are elected by and serve at the
discretion of the board of directors. We do not currently have any independent directors. Our directors do not receive compensation for serving in such
capacity.
Corporate Governance
We do not have standing audit,
compensation and corporate governance committees, or committees performing similar functions. We have not adopted a code of ethics. We anticipate that
as we become more familiar with the obligations of U.S. public companies, we will implement appropriate corporate governance structures to comply with
SEC and/or stock exchange requirements. We intend to comply with all corporate governance requirements applicable to us at this time.
77
Under the Development Agreement, we
sell yew branches and leaves to Yew Pharmaceutical and Yew Pharmaceutical manufactures taxol-based TCM in accordance with the requirements of the HFDA.
Yew Pharmaceutical produces the TCM at its own facilities in Harbin and is responsible for producing the finished product medicine in accordance with
the requirements of good manufacturing practices, filing all applications and obtaining all approvals from the HFDA. Yew Pharmaceutical is also the
exclusive distributor of this TCM, Zi Shan. Under the Development Agreement, Yew Pharmaceutical pays us RMB 1,000,000 per ton of raw material.
This amount is below the current market rate of approximately RMB 1,100,000 per ton of raw material. Given the 10-year term of the Development
Agreement and our belief that the fair market value for yew raw material will continue to rise, the difference between fair market value and the
contractually-set price at which we sell yew raw material to Yew Pharmaceutical is expected to increase, especially in later years of the term of the
Development Agreement. As the purchaser of raw material for the production of TCM, Yew Pharmaceutical is also the primary customer in our TCM raw
materials segment and a major customer of the Company as a whole. Yew Pharmaceutical is owned directly and indirectly primarily by Mr. Wang and Madame
Qi. Under the Technology Agreement we entered into with Kairun, Kairun provides us with testing and technologies regarding utilization of yew trees to
extract taxol and develop higher concentration of taxol in the yew trees we grow and cultivate. For these services, we have agreed to pay Kairun RMB
200,000 after the technologies developed by Kairun are tested and approved by us. We retain all intellectual property rights in connection with the
technologies developed by Kairun. Kairun may not provide similar services to any other party without our prior written consent.
The initial term of the Technology
Agreement was two years. Kairun informed us that it is taking longer than originally expected to develop the technologies and conduct the tests under
the Technology Agreement. Accordingly, in February 2012, we entered into a supplemental agreement with Kairun, extending the term of the Technology
Agreement indefinitely until project results specified in the original Technology Agreement are achieved. Kairun is owned directly and indirectly
primarily by Mr. Wang and Madame Qi.
The principal executive offices of YBP
are located at 294 Powerbilt Avenue, Las Vegas, Nevada, a property owned by the Company’s President, Zhiguo Wang, which he provides rent-free to
the Company. However, we pay utilities, property insurance, real estate tax, association dues and certain other expenses on the property to third
parties, which, in 2011, aggregated approximately $9,830, which we believe approximates the fair market value of rent that we would have paid for
similar office space.
HDS leases office space in Xiangfang
District, Harbin from the Company’s President, Zhiguo Wang, under a 15-year lease commencing January 1, 2010 and expiring December 31, 2025. We
pay rent in the amount of RMB 15,000 per year. We believe that the rent is at or below market for the space we are occupying.
HDS occupies approximately 40 square
meters of usable retail space in the Nangang District of Harbin from Guifang Qi, a director of the Company and the wife of Zhiguo Wang. Pursuant to a
Lease Contract dated December 3, 2008, the premises were provided rent-free for the first year of the three-year lease. Beginning December 3, 2009, we
paid rent in the amount of RMB 12,000 per year for the second and third years of the lease term. We entered into the current lease on this property on
November 15, 2011. The term of the new three-year lease is from December 1, 2011 through December 1, 2014. We pay rent in the amount of RMB 1,300 per
month (RMB 15,600 per year), payable annually on or before May 30 of each year of the term. We believe that the rent is at or below market for the
space we are occupying. We closed the store in December 2012, although we continue to lease the facility to exhibit and warehouse our
finished products.
Under an agreement dated March 25, 2005
with ZTC, we lease 361 mu (approximately 60 acres) of land in Lalin Town, Wuchang City, Heilongjiang Province, for nursery land used to cultivate yew
stock. This agreement is for a term of 30 years expiring on March 24, 2035. Under this agreement, we pay RMB 162,450 per year, with a lump sum payment
of RMB 812,250 representing the first five years of the lease on or before December 31, 2010. We made a payment in the amount of RMB 1,000,000 in March
2012. Thereafter, we are required to pay each next five years’ rent in advance. Mr. Wang and Madame Qi own approximately 39.4% and 30.7%,
respectively, of ZTC.
78
Prior to January 1, 2011, ZTC was also
the major supplier of yew seedlings that we purchased for cultivation in our business. We do not plan on making significant purchases from ZTC in the
future.
We have received advanced from, and in
the past we have provided advances to, certain of our directors, officers and/or related parties, as follows:
| Due to related parties |
|||||||||||
|---|---|---|---|---|---|---|---|---|---|---|---|
| Name of related party |
September 30, 2012 |
December 31, 2011 |
|||||||||
Zhiguo Wang
|
$ | 54,409 | $ | 31,357 | |||||||
Yew
Pharmaceutical |
— | 62,847 | |||||||||
Madame Qi
|
1,689 | — | |||||||||
ZTC
|
— | 172,284 | |||||||||
Total
|
$ | 56,098 | $ | 266,488 | |||||||
These advances are unsecured and
payable on demand.
The First Restructure and the Second
Restructure involved transactions between the Company and the HDS Shareholders, who are also all of our directors and three of our executive officers.
These transactions were not negotiated at arm’s length. While we have not discovered any precedent under Nevada law for a transaction like the
Second Restructure, it is possible that the Second Restructure should have been approved by YBP’s shareholders because it may be viewed as having
involved the sale of all or substantially all of YBP’s assets in that the stock of HDS was transferred from a wholly-owned subsidiary, JSJ, to the
HDS Shareholders. However, because the Company was not yet subject to the reporting obligations of the Exchange Act, YBP was unable to issue a
proxy statement to its shareholders in connection with such approval. The Company sought and obtained shareholder ratification of the Second
Restructure and all of the transactions contemplated and effected in connection therewith at the Special Meeting on December 13,
2012.
The terms of the Founders’ Options
have not been determined as a result of arm’s-length negotiations. The Board of Directors of YBP, which consists of the same persons who are the
HDS Shareholders and the grantees of the Founders’ Options, sought and obtained shareholder approval of the issuance of the Founders’
Options at the Special Meeting on December 13, 2012.
None of our directors is independent at
this time.
79
The following table sets forth, as of
January 15, 2013, the number of shares of our common stock owned of record and beneficially by all directors, executive officers and persons who
beneficially own more than 5% of the outstanding shares of our common stock:
| Name and Address |
Amount and Nature of Beneficial Ownership |
Percentage of Class(1) |
||||||||
|---|---|---|---|---|---|---|---|---|---|---|
Directors and
Executive Officers: |
||||||||||
Zhiguo Wang
(2)(3) No.234, Gexin Street Nangang District, Harbin City People’s Republic of China |
47,150,561 | 64.76 | % | |||||||
Guifang Qi
(2)(4) No.234, Gexin Street Nangang District, Harbin City People’s Republic of China |
47,150,561 | 64.76 | % | |||||||
Xingming
Han(5) Door 3, Floor 7, Unit 2, vice No.23 Tongzhan Street Xiangfang District, Harbin City People’s Republic of China |
426,600 | * | ||||||||
Adam
Wasserman 1643 Royal Grove Way Weston, FL 33327 |
0 | 0 | % | |||||||
All Directors
and Executive Officers as a group (4 persons) |
47,577,161 | 65.35 | % | |||||||
* |
less than 1% |
(1) |
Percentage ownership is based on 72,805,512 shares of YBP common stock deemed outstanding on January 15, 2013, assuming exercise of all outstanding Founders’ Options, all of which are exercisable within 60 days. Beneficial ownership is determined in accordance with the rules of the SEC and generally includes voting or investment power with respect to securities. Shares of common stock subject to options, warrants and convertible notes currently exercisable or convertible, or exercisable or convertible within 60 days, are deemed outstanding for determining the number of shares beneficially owned and for computing the percentage ownership of the person holding such options, but are not deemed outstanding for computing the percentage ownership of any other person. Except as indicated by footnote, the persons named in the table have sole voting and investment power with respect to all shares of common stock shown as beneficially owned by them. |
(2) |
Zhiguo Wang and Guifang Qi are husband and wife. |
(3) |
Consists of (i) 20,103,475 shares held by Mr. Wang; (ii) 2,488,737 shares held by Madame Qi; (iii) 1,966,137 shares held by an immediate family member living in Mr. Wang’s and Madame Qi’s residence and as to which Mr. Wang disclaims beneficial ownership; (iv) 20,103,475 shares which are issuable upon exercise of the Founder’s Option issued to Mr. Wang, which option is exercisable within 60 days; and (v) 2,488,737 shares which are issuable upon exercise of the Founder’s Option issued to Madame Qi, which option is exercisable within 60 days. |
(4) |
Consists of (i) 2,488,737 shares held by Madame Qi; (ii) 20,103,475 shares held by Mr. Wang; (iii) 1,966,137 shares held by an immediate family member living in Mr. Wang’s and Madame Qi’s residence and as to which Madame Qi disclaims beneficial ownership; (iv) 2,488,737 shares which are issuable upon exercise of the Founder’s Option issued to Madame Qi, which option is exercisable within 60 days; and (v) 20,103,475 shares which are issuable upon exercise of the Founder’s Option issued to Mr. Wang, which option is exercisable within 60 days. |
(5) |
Consists of (i) 213,300 shares held by Mr. Han; and (ii) 213,300 shares which are issuable upon exercise of the Founder’s Option issued to Mr. Han, which option is exercisable within 60 days. |
80
This description of our securities
is a summary only of certain provisions contained in our Articles of Incorporation and is qualified in its entirety by reference to the complete terms
contained therein.
YBP’s Articles of
Incorporation, as amended, authorize the Company to issue 140,000,000 shares of common stock and 10,000,000 shares of preferred
stock. As of January 15, 2013, 50,000,000 shares of our common stock were issued and outstanding.
Common Stock
All outstanding shares of common stock
are of the same class and have equal rights and attributes. The holders of common stock are entitled to one vote per share on all matters submitted to
a vote of stockholders of the Company. All stockholders are entitled to share equally in dividends, if any, as may be declared from time to time by the
Board of Directors out of funds legally available therefor. In the event of liquidation, the holders of common stock are entitled to share ratably in
all assets remaining after payment of all liabilities. Holders of common stock do not have cumulative or preemptive rights.
Preferred Stock
As of the date of this registration
statement, we are not authorized to issue any shares of preferred stock, we have not issued any such shares and we are not registering any such
securities herein.
Debt Securities
As of the date of this registration
statement, we have not issued any debt securities and we are not registering any such securities herein.
Warrants
As of the date of this registration
statement, we have not issued any warrants, options or other securities which are convertible into or exercisable for shares of our common stock or
preferred stock and we are not registering any such securities herein, except that on December 13, 2012, we issued the Founders’ Options. We
are not registering any of the shares of common stock for which the Founders’ Options may be exercised. For more information, regarding the terms
of the Founders’ Options, see “Our Business — Recapitalization”.
81
We are registering a total of
16,500,000 shares of common stock, consisting of shares of our common stock issued in one or more of the private placement transactions in which we
engaged between March 2008 and September 2009, which amount includes 3,868,540 shares held by our management.
The following table sets forth the
names of the selling security holders, the number of shares of common stock beneficially owned by each of the selling stockholders as of November 30,
2012 and the number of shares of common stock being offered by the selling stockholders. The shares being offered hereby are being registered to permit
public secondary trading, and the selling stockholders may offer all or part of the shares for resale from time to time. However, the selling
stockholders are under no obligation to sell all or any portion of such shares nor are the selling stockholders obligated to sell any shares
immediately upon effectiveness of this prospectus. All information with respect to share ownership has been furnished by the selling
stockholders.
| Shares Beneficially Owned Prior to the Offering (1) |
Shares Being Offered |
Shares Beneficially Owned After the Offering (1) |
|||||||||||||||||||||
|---|---|---|---|---|---|---|---|---|---|---|---|---|---|---|---|---|---|---|---|---|---|---|---|
| Name of Beneficial Owner |
Number |
Percentage (2) |
Number |
Percentage (2) |
|||||||||||||||||||
Tie Zhi Cheng
|
474 | * | 474 | 0 | * | ||||||||||||||||||
Guangqing
Yang |
498 | * | 498 | 0 | * | ||||||||||||||||||
Qingsheng Liu
|
498 | * | 498 | 0 | * | ||||||||||||||||||
Yong An Zhao
|
498 | * | 498 | 0 | * | ||||||||||||||||||
Yong Qiang
Han |
498 | * | 498 | 0 | * | ||||||||||||||||||
Zhen Da Zhou
|
498 | * | 498 | 0 | * | ||||||||||||||||||
Bing Ying
Wang |
790 | * | 790 | 0 | * | ||||||||||||||||||
Guixiang
Zhang |
790 | * | 790 | 0 | * | ||||||||||||||||||
Jing Yan Shao
|
790 | * | 790 | 0 | * | ||||||||||||||||||
Jing Yue Peng
|
790 | * | 790 | 0 | * | ||||||||||||||||||
Ning Shu Yang
|
790 | * | 790 | 0 | * | ||||||||||||||||||
Liping Liu
|
830 | * | 830 | 0 | * | ||||||||||||||||||
Liping Sun
|
830 | * | 830 | 0 | * | ||||||||||||||||||
Jin Dong Wang
|
878 | * | 878 | 0 | * | ||||||||||||||||||
Gui Mei Zhang
|
965 | * | 965 | 0 | * | ||||||||||||||||||
Hong Xu Ji
|
965 | * | 965 | 0 | * | ||||||||||||||||||
Meng Lan Yuan
|
965 | * | 965 | 0 | * | ||||||||||||||||||
Min Luo
|
965 | * | 965 | 0 | * | ||||||||||||||||||
Ning Zhang
|
965 | * | 965 | 0 | * | ||||||||||||||||||
Peiye Ma
|
965 | * | 965 | 0 | * | ||||||||||||||||||
Qing Yuan
Jiang |
965 | * | 965 | 0 | * | ||||||||||||||||||
Ri Qiang Lu
|
965 | * | 965 | 0 | * | ||||||||||||||||||
Rui Sun
|
965 | * | 965 | 0 | * | ||||||||||||||||||
Shijie Guo
|
965 | * | 965 | 0 | * | ||||||||||||||||||
Wei Dong
Zhang |
965 | * | 965 | 0 | * | ||||||||||||||||||
Wei Na
|
965 | * | 965 | 0 | * | ||||||||||||||||||
Yan Ling Zhao
|
965 | * | 965 | 0 | * | ||||||||||||||||||
Yan Zuo
|
965 | * | 965 | 0 | * | ||||||||||||||||||
Yong Wang
|
965 | * | 965 | 0 | * | ||||||||||||||||||
Yongfa Guo
|
965 | * | 965 | 0 | * | ||||||||||||||||||
Zhong Wei
Wang |
965 | * | 965 | 0 | * | ||||||||||||||||||
Zu Bin Sun
|
965 | * | 965 | 0 | * | ||||||||||||||||||
Honghai Sun
|
995 | * | 995 | 0 | * | ||||||||||||||||||
Jianru Shao
|
995 | * | 995 | 0 | * | ||||||||||||||||||
Weidong Song
|
995 | * | 995 | 0 | * | ||||||||||||||||||
Shi Ying Yang
|
1,024 | * | 1,024 | 0 | * | ||||||||||||||||||
82
| Shares Beneficially Owned Prior to the Offering (1) |
Shares Being Offered |
Shares Beneficially Owned After the Offering (1) |
|||||||||||||||||||||
|---|---|---|---|---|---|---|---|---|---|---|---|---|---|---|---|---|---|---|---|---|---|---|---|
| Name of Beneficial Owner |
Number |
Percentage (2) |
Number |
Percentage (2) | |||||||||||||||||||
Zhi Ling Shan
|
1,024 | * | 1,024 | 0 | * | ||||||||||||||||||
Li Zhang
|
1,043 | * | 1,043 | 0 | * | ||||||||||||||||||
Fajun Lian
|
1,493 | * | 1,493 | 0 | * | ||||||||||||||||||
Hong Xia Li
|
1,493 | * | 1,493 | 0 | * | ||||||||||||||||||
Li Zhang
|
1,493 | * | 1,493 | 0 | * | ||||||||||||||||||
Qingbin Zhu
|
1,493 | * | 1,493 | 0 | * | ||||||||||||||||||
Qiyuan Zhao
|
1,493 | * | 1,493 | 0 | * | ||||||||||||||||||
Shu Qin Zhang
|
1,493 | * | 1,493 | 0 | * | ||||||||||||||||||
Xiaorong E
|
1,493 | * | 1,493 | 0 | * | ||||||||||||||||||
Jun Yang
|
1,536 | * | 1,536 | 0 | * | ||||||||||||||||||
Li Zhu Zhai
|
1,536 | * | 1,536 | 0 | * | ||||||||||||||||||
Xi Bin Wang
|
1,536 | * | 1,536 | 0 | * | ||||||||||||||||||
Xing Kui Li
|
1,536 | * | 1,536 | 0 | * | ||||||||||||||||||
Feng Ying
Zhao |
1,564 | * | 1,564 | 0 | * | ||||||||||||||||||
Meng Li Wang
|
1,564 | * | 1,564 | 0 | * | ||||||||||||||||||
Shuang Jun
Cao |
1,564 | * | 1,564 | 0 | * | ||||||||||||||||||
Fengzhen Yang
|
1,580 | * | 1,580 | 0 | * | ||||||||||||||||||
Jian Xie
|
1,580 | * | 1,580 | 0 | * | ||||||||||||||||||
Li Sun
|
1,580 | * | 1,580 | 0 | * | ||||||||||||||||||
Liu Dan Li
|
1,580 | * | 1,580 | 0 | * | ||||||||||||||||||
Ming Yang Liu
|
1,580 | * | 1,580 | 0 | * | ||||||||||||||||||
Wei Quan Zhou
|
1,580 | * | 1,580 | 0 | * | ||||||||||||||||||
Xiu Lian
Zhang |
1,580 | * | 1,580 | 0 | * | ||||||||||||||||||
Yajie Liu
|
1,580 | * | 1,580 | 0 | * | ||||||||||||||||||
Ying Cao
|
1,580 | * | 1,580 | 0 | * | ||||||||||||||||||
Yuming Li
|
1,580 | * | 1,580 | 0 | * | ||||||||||||||||||
Zhanhua Chen
|
1,580 | * | 1,580 | 0 | * | ||||||||||||||||||
Zhenwen Li
|
1,580 | * | 1,580 | 0 | * | ||||||||||||||||||
Hongman Yu
|
1,659 | * | 1,659 | 0 | * | ||||||||||||||||||
Jihai Song
|
1,659 | * | 1,659 | 0 | * | ||||||||||||||||||
Jun Meng
|
1,659 | * | 1,659 | 0 | * | ||||||||||||||||||
Lanying Wang
|
1,659 | * | 1,659 | 0 | * | ||||||||||||||||||
Shuchun Zhang
|
1,659 | * | 1,659 | 0 | * | ||||||||||||||||||
Shujian Sun
|
1,659 | * | 1,659 | 0 | * | ||||||||||||||||||
Shuxiang Sun
|
1,659 | * | 1,659 | 0 | * | ||||||||||||||||||
Wen Xin Chen
|
1,659 | * | 1,659 | 0 | * | ||||||||||||||||||
Yandong Song
|
1,659 | * | 1,659 | 0 | * | ||||||||||||||||||
Yukun Liu
|
1,659 | * | 1,659 | 0 | * | ||||||||||||||||||
Zhaohui Geng
|
1,659 | * | 1,659 | 0 | * | ||||||||||||||||||
Guang Hua Xie
|
1,706 | * | 1,706 | 0 | * | ||||||||||||||||||
Gui Min Zhao
|
1,706 | * | 1,706 | 0 | * | ||||||||||||||||||
Qiang Jia
|
1,706 | * | 1,706 | 0 | * | ||||||||||||||||||
Cui Ping Yin
|
1,722 | * | 1,722 | 0 | * | ||||||||||||||||||
Huaibin Huang
|
1,738 | * | 1,738 | 0 | * | ||||||||||||||||||
Hui Mei Shang
|
1,738 | * | 1,738 | 0 | * | ||||||||||||||||||
Jun Li Liu
|
1,738 | * | 1,738 | 0 | * | ||||||||||||||||||
Li Hua Zhou
|
1,738 | * | 1,738 | 0 | * | ||||||||||||||||||
Ling Lu
|
1,738 | * | 1,738 | 0 | * | ||||||||||||||||||
Ling Ma
|
1,738 | * | 1,738 | 0 | * | ||||||||||||||||||
83
| Shares Beneficially Owned Prior to the Offering (1) |
Shares Being Offered |
Shares Beneficially Owned After the Offering (1) |
|||||||||||||||||||||
|---|---|---|---|---|---|---|---|---|---|---|---|---|---|---|---|---|---|---|---|---|---|---|---|
| Name of Beneficial Owner |
Number |
Percentage (2) |
Number |
Percentage (2) | |||||||||||||||||||
Shu Mei Zhang
|
1,738 | * | 1,738 | 0 | * | ||||||||||||||||||
Tie Li Wang
|
1,738 | * | 1,738 | 0 | * | ||||||||||||||||||
Wen Li Xu
|
1,738 | * | 1,738 | 0 | * | ||||||||||||||||||
Xiaowei Wang
|
1,738 | * | 1,738 | 0 | * | ||||||||||||||||||
Yurong Cao
|
1,738 | * | 1,738 | 0 | * | ||||||||||||||||||
Zhigang Feng
|
1,738 | * | 1,738 | 0 | * | ||||||||||||||||||
Ning Xin
|
1,755 | * | 1,755 | 0 | * | ||||||||||||||||||
Changjiang
Yang |
1,930 | * | 1,930 | 0 | * | ||||||||||||||||||
Chunrong Yang
|
1,930 | * | 1,930 | 0 | * | ||||||||||||||||||
Cheng Yu Wang
|
1,931 | * | 1,931 | 0 | * | ||||||||||||||||||
Dacheng Wang
|
1,931 | * | 1,931 | 0 | * | ||||||||||||||||||
Fu Wei Zhang
|
1,931 | * | 1,931 | 0 | * | ||||||||||||||||||
Gui Ying Ma
|
1,931 | * | 1,931 | 0 | * | ||||||||||||||||||
Guiling Zhang
|
1,931 | * | 1,931 | 0 | * | ||||||||||||||||||
Guoqiang Xie
|
1,931 | * | 1,931 | 0 | * | ||||||||||||||||||
Hong Ying
Wang |
1,931 | * | 1,931 | 0 | * | ||||||||||||||||||
Hui Jun Han
|
1,931 | * | 1,931 | 0 | * | ||||||||||||||||||
Jin Zhi Wang
|
1,931 | * | 1,931 | 0 | * | ||||||||||||||||||
Juan Du
|
1,931 | * | 1,931 | 0 | * | ||||||||||||||||||
Li Dong
|
1,931 | * | 1,931 | 0 | * | ||||||||||||||||||
Li Liu
|
1,931 | * | 1,931 | 0 | * | ||||||||||||||||||
Lihong Zou
|
1,931 | * | 1,931 | 0 | * | ||||||||||||||||||
Ming Kai Ren
|
1,931 | * | 1,931 | 0 | * | ||||||||||||||||||
Rui Xiang Han
|
1,931 | * | 1,931 | 0 | * | ||||||||||||||||||
Shu Ran Miao
|
1,931 | * | 1,931 | 0 | * | ||||||||||||||||||
Xiufen Li
|
1,931 | * | 1,931 | 0 | * | ||||||||||||||||||
Zhao Ge Wang
|
1,931 | * | 1,931 | 0 | * | ||||||||||||||||||
Gui Lan Zhang
|
1,991 | * | 1,991 | 0 | * | ||||||||||||||||||
Lin Li
|
1,991 | * | 1,991 | 0 | * | ||||||||||||||||||
Ying Pan
|
1,991 | * | 1,991 | 0 | * | ||||||||||||||||||
Xiang De Yu
|
2,074 | * | 2,074 | 0 | * | ||||||||||||||||||
Tao Yang
|
2,086 | * | 2,086 | 0 | * | ||||||||||||||||||
Bin Chen
|
2,370 | * | 2,370 | 0 | * | ||||||||||||||||||
Chang Qing Li
|
2,370 | * | 2,370 | 0 | * | ||||||||||||||||||
Dong Wei Wang
|
2,370 | * | 2,370 | 0 | * | ||||||||||||||||||
Gongwei Yang
|
2,370 | * | 2,370 | 0 | * | ||||||||||||||||||
Gui Rong Wang
|
2,370 | * | 2,370 | 0 | * | ||||||||||||||||||
Hao Qi Chen
|
2,370 | * | 2,370 | 0 | * | ||||||||||||||||||
Hui Lin Qiao
|
2,370 | * | 2,370 | 0 | * | ||||||||||||||||||
Jun Wang
|
2,370 | * | 2,370 | 0 | * | ||||||||||||||||||
Jun Wu
|
2,370 | * | 2,370 | 0 | * | ||||||||||||||||||
Lan Ying Wang
|
2,370 | * | 2,370 | 0 | * | ||||||||||||||||||
Lei Bao
|
2,370 | * | 2,370 | 0 | * | ||||||||||||||||||
Li Ping Zhang
|
2,370 | * | 2,370 | 0 | * | ||||||||||||||||||
Qiuhong Ma
|
2,370 | * | 2,370 | 0 | * | ||||||||||||||||||
Quan An Cao
|
2,370 | * | 2,370 | 0 | * | ||||||||||||||||||
Shi Xiang Jia
|
2,370 | * | 2,370 | 0 | * | ||||||||||||||||||
Shu Hua Qu
|
2,370 | * | 2,370 | 0 | * | ||||||||||||||||||
Shufang Sun
|
2,370 | * | 2,370 | 0 | * | ||||||||||||||||||
84
| Shares Beneficially Owned Prior to the Offering (1) |
Shares Being Offered |
Shares Beneficially Owned After the Offering (1) |
|||||||||||||||||||||
|---|---|---|---|---|---|---|---|---|---|---|---|---|---|---|---|---|---|---|---|---|---|---|---|
| Name of Beneficial Owner |
Number |
Percentage (2) |
Number |
Percentage (2) | |||||||||||||||||||
Tong Xu
|
2,370 | * | 2,370 | 0 | * | ||||||||||||||||||
Wen Long Yang
|
2,370 | * | 2,370 | 0 | * | ||||||||||||||||||
Wen Qing Liu
|
2,370 | * | 2,370 | 0 | * | ||||||||||||||||||
Xiang Zhe
Zheng |
2,370 | * | 2,370 | 0 | * | ||||||||||||||||||
Xianhua Hua
|
2,370 | * | 2,370 | 0 | * | ||||||||||||||||||
Xiao Dong
Wang |
2,370 | * | 2,370 | 0 | * | ||||||||||||||||||
Xiao Hong
Yang |
2,370 | * | 2,370 | 0 | * | ||||||||||||||||||
Xiu Ling Wang
|
2,370 | * | 2,370 | 0 | * | ||||||||||||||||||
Xu Gui Xie
|
2,370 | * | 2,370 | 0 | * | ||||||||||||||||||
Yu Ming He
|
2,370 | * | 2,370 | 0 | * | ||||||||||||||||||
Yu Qin Liu
|
2,370 | * | 2,370 | 0 | * | ||||||||||||||||||
Yumei Wang
|
2,370 | * | 2,370 | 0 | * | ||||||||||||||||||
Gui Zhi Yang
|
2,413 | * | 2,413 | 0 | * | ||||||||||||||||||
Yong Hai Yu
|
2,413 | * | 2,413 | 0 | * | ||||||||||||||||||
Cheng Hui
Tang |
2,489 | * | 2,489 | 0 | * | ||||||||||||||||||
Jun Li
|
2,489 | * | 2,489 | 0 | * | ||||||||||||||||||
Li Yan Hua
|
2,489 | * | 2,489 | 0 | * | ||||||||||||||||||
Shu Min Gao
|
2,489 | * | 2,489 | 0 | * | ||||||||||||||||||
Zhende Zhang
|
2,489 | * | 2,489 | 0 | * | ||||||||||||||||||
Zhi Ping Xiao
|
2,489 | * | 2,489 | 0 | * | ||||||||||||||||||
Guo Zhen Dai
|
2,545 | * | 2,545 | 0 | * | ||||||||||||||||||
Dian Jin Luan
|
2,560 | * | 2,560 | 0 | * | ||||||||||||||||||
Jian Zhang
|
2,560 | * | 2,560 | 0 | * | ||||||||||||||||||
Huan Qin Liu
|
2,607 | * | 2,607 | 0 | * | ||||||||||||||||||
Jin Song
|
2,607 | * | 2,607 | 0 | * | ||||||||||||||||||
Lifang Zhu
|
2,607 | * | 2,607 | 0 | * | ||||||||||||||||||
Shu Jie Jiang
|
2,607 | * | 2,607 | 0 | * | ||||||||||||||||||
Yan Han
|
2,607 | * | 2,607 | 0 | * | ||||||||||||||||||
Zhiguo Liu
|
2,607 | * | 2,607 | 0 | * | ||||||||||||||||||
Shi Guo Liang
|
2,752 | * | 2,752 | 0 | * | ||||||||||||||||||
Chun Hui Jia
|
2,765 | * | 2,765 | 0 | * | ||||||||||||||||||
Shu Qing Sun
|
2,852 | * | 2,852 | 0 | * | ||||||||||||||||||
Gui Mei Shi
|
2,896 | * | 2,896 | 0 | * | ||||||||||||||||||
Hua Li
|
2,896 | * | 2,896 | 0 | * | ||||||||||||||||||
Hui Jiang
|
2,896 | * | 2,896 | 0 | * | ||||||||||||||||||
Hui Zhu
|
2,896 | * | 2,896 | 0 | * | ||||||||||||||||||
Huiying Liu
|
2,896 | * | 2,896 | 0 | * | ||||||||||||||||||
Jia Zhi Wang
|
2,896 | * | 2,896 | 0 | * | ||||||||||||||||||
Jingshu Lv
|
2,896 | * | 2,896 | 0 | * | ||||||||||||||||||
Li Bin Du
|
2,896 | * | 2,896 | 0 | * | ||||||||||||||||||
Li Juan Xia
|
2,896 | * | 2,896 | 0 | * | ||||||||||||||||||
Li Ping Yang
|
2,896 | * | 2,896 | 0 | * | ||||||||||||||||||
Li Tang
|
2,896 | * | 2,896 | 0 | * | ||||||||||||||||||
Qing Ren Li
|
2,896 | * | 2,896 | 0 | * | ||||||||||||||||||
Rui Yue
|
2,896 | * | 2,896 | 0 | * | ||||||||||||||||||
Wen Xian Dong
|
2,896 | * | 2,896 | 0 | * | ||||||||||||||||||
Xianzhang Sun
|
2,896 | * | 2,896 | 0 | * | ||||||||||||||||||
Xin Yun Wang
|
2,896 | * | 2,896 | 0 | * | ||||||||||||||||||
Yan Ping Qu
|
2,896 | * | 2,896 | 0 | * | ||||||||||||||||||
85
| Shares Beneficially Owned Prior to the Offering (1) |
Shares Being Offered |
Shares Beneficially Owned After the Offering (1) |
|||||||||||||||||||||
|---|---|---|---|---|---|---|---|---|---|---|---|---|---|---|---|---|---|---|---|---|---|---|---|
| Name of Beneficial Owner |
Number |
Percentage (2) |
Number |
Percentage (2) | |||||||||||||||||||
Yi Tao Lang
|
2,896 | * | 2,896 | 0 | * | ||||||||||||||||||
Yu Qin Wang
|
2,896 | * | 2,896 | 0 | * | ||||||||||||||||||
Yu Zhang Yue
|
2,896 | * | 2,896 | 0 | * | ||||||||||||||||||
Zhengguang
Shao |
2,896 | * | 2,896 | 0 | * | ||||||||||||||||||
Zhenmei Qu
|
2,896 | * | 2,896 | 0 | * | ||||||||||||||||||
Zhiqiang Wang
|
2,896 | * | 2,896 | 0 | * | ||||||||||||||||||
Zhiwei Tian
|
2,896 | * | 2,896 | 0 | * | ||||||||||||||||||
Feng Hu Ma
|
2,986 | * | 2,986 | 0 | * | ||||||||||||||||||
Xi Qin Wang
|
3,072 | * | 3,072 | 0 | * | ||||||||||||||||||
Lin Juan Xu
|
3,128 | * | 3,128 | 0 | * | ||||||||||||||||||
Xiaoli Xu
|
3,160 | * | 3,160 | 0 | * | ||||||||||||||||||
Xiuzhi Zhao
|
3,160 | * | 3,160 | 0 | * | ||||||||||||||||||
Congge Tang
|
3,318 | * | 3,318 | 0 | * | ||||||||||||||||||
Dingli Sun
|
3,318 | * | 3,318 | 0 | * | ||||||||||||||||||
Fenglan Guan
|
3,318 | * | 3,318 | 0 | * | ||||||||||||||||||
Guiying Song
|
3,318 | * | 3,318 | 0 | * | ||||||||||||||||||
Guizhi Yin
|
3,318 | * | 3,318 | 0 | * | ||||||||||||||||||
Hongnan Yu
|
3,318 | * | 3,318 | 0 | * | ||||||||||||||||||
Jihua Zhang
|
3,318 | * | 3,318 | 0 | * | ||||||||||||||||||
Jinxia Lu
|
3,318 | * | 3,318 | 0 | * | ||||||||||||||||||
Jirong Zhang
|
3,318 | * | 3,318 | 0 | * | ||||||||||||||||||
Lihua Zhang
|
3,318 | * | 3,318 | 0 | * | ||||||||||||||||||
Linglin Chen
|
3,318 | * | 3,318 | 0 | * | ||||||||||||||||||
Shuying Zhang
|
3,318 | * | 3,318 | 0 | * | ||||||||||||||||||
Xiuhua Cao
|
3,318 | * | 3,318 | 0 | * | ||||||||||||||||||
Xiujuan Li
|
3,318 | * | 3,318 | 0 | * | ||||||||||||||||||
Ying Sun
|
3,318 | * | 3,318 | 0 | * | ||||||||||||||||||
Hong Kuai
Feng |
3,413 | * | 3,413 | 0 | * | ||||||||||||||||||
Zhan Xiang
Zhang |
3,413 | * | 3,413 | 0 | * | ||||||||||||||||||
Fu Yu
|
3,476 | * | 3,476 | 0 | * | ||||||||||||||||||
Guang Fa
Zhang |
3,476 | * | 3,476 | 0 | * | ||||||||||||||||||
Gui Qin Zhang
|
3,476 | * | 3,476 | 0 | * | ||||||||||||||||||
Hua Geng
|
3,476 | * | 3,476 | 0 | * | ||||||||||||||||||
Jian Fu Zhang
|
3,476 | * | 3,476 | 0 | * | ||||||||||||||||||
Jing Li
|
3,476 | * | 3,476 | 0 | * | ||||||||||||||||||
Li Ming Hu
|
3,476 | * | 3,476 | 0 | * | ||||||||||||||||||
Liqiu Wang
|
3,476 | * | 3,476 | 0 | * | ||||||||||||||||||
Min Feng
Zhang |
3,476 | * | 3,476 | 0 | * | ||||||||||||||||||
Xuejun Li
|
3,476 | * | 3,476 | 0 | * | ||||||||||||||||||
Xueru Cai
|
3,476 | * | 3,476 | 0 | * | ||||||||||||||||||
Yanjie Yu
|
3,476 | * | 3,476 | 0 | * | ||||||||||||||||||
Zhong Shan
Yang |
3,583 | * | 3,583 | 0 | * | ||||||||||||||||||
Jing Zhi Yu
|
3,862 | * | 3,862 | 0 | * | ||||||||||||||||||
Changjun Wang
|
3,950 | * | 3,950 | 0 | * | ||||||||||||||||||
Dongyu Wang
|
3,950 | * | 3,950 | 0 | * | ||||||||||||||||||
Feng Yan Gai
|
3,950 | * | 3,950 | 0 | * | ||||||||||||||||||
Fenglan Liu
|
3,950 | * | 3,950 | 0 | * | ||||||||||||||||||
Hong Yun
Jiang |
3,950 | * | 3,950 | 0 | * | ||||||||||||||||||
Jian Jun Yang
|
3,950 | * | 3,950 | 0 | * | ||||||||||||||||||
86
| Shares Beneficially Owned Prior to the Offering (1) |
Shares Being Offered |
Shares Beneficially Owned After the Offering (1) |
|||||||||||||||||||||
|---|---|---|---|---|---|---|---|---|---|---|---|---|---|---|---|---|---|---|---|---|---|---|---|
| Name of Beneficial Owner |
Number |
Percentage (2) |
Number |
Percentage (2) | |||||||||||||||||||
Jie Zhao
|
3,950 | * | 3,950 | 0 | * | ||||||||||||||||||
Jing Hai Li
|
3,950 | * | 3,950 | 0 | * | ||||||||||||||||||
Jingzhi Peng
|
3,950 | * | 3,950 | 0 | * | ||||||||||||||||||
Jun Yang
|
3,950 | * | 3,950 | 0 | * | ||||||||||||||||||
Lianyu Wang
|
3,950 | * | 3,950 | 0 | * | ||||||||||||||||||
Qiang Miao
|
3,950 | * | 3,950 | 0 | * | ||||||||||||||||||
Suping Zhu
|
3,950 | * | 3,950 | 0 | * | ||||||||||||||||||
Xiang Dong Yu
|
3,950 | * | 3,950 | 0 | * | ||||||||||||||||||
Xiu Qiu Wang
|
3,950 | * | 3,950 | 0 | * | ||||||||||||||||||
Xun Zhou
|
3,950 | * | 3,950 | 0 | * | ||||||||||||||||||
Ya Lin Jiang
|
3,950 | * | 3,950 | 0 | * | ||||||||||||||||||
Ya Qin Wang
|
3,950 | * | 3,950 | 0 | * | ||||||||||||||||||
Yun Zhen Zuo
|
3,950 | * | 3,950 | 0 | * | ||||||||||||||||||
Zhong Hua Fu
|
3,950 | * | 3,950 | 0 | * | ||||||||||||||||||
Ying Chen
|
3,982 | * | 3,982 | 0 | * | ||||||||||||||||||
Qiulan Bian
|
4,029 | * | 4,029 | 0 | * | ||||||||||||||||||
Yaqin Zhao
|
4,108 | * | 4,108 | 0 | * | ||||||||||||||||||
Jianbo He
|
4,213 | * | 4,213 | 0 | * | ||||||||||||||||||
Hong Jun Fu
|
4,227 | * | 4,227 | 0 | * | ||||||||||||||||||
Ya Wen Gao
|
4,266 | * | 4,266 | 0 | * | ||||||||||||||||||
Ji Chao Wang
|
4,345 | * | 4,345 | 0 | * | ||||||||||||||||||
Jin Qi Jiang
|
4,345 | * | 4,345 | 0 | * | ||||||||||||||||||
Lihua Sun
|
4,345 | * | 4,345 | 0 | * | ||||||||||||||||||
Shao Chen
Song |
4,345 | * | 4,345 | 0 | * | ||||||||||||||||||
Xu Zhang
|
4,345 | * | 4,345 | 0 | * | ||||||||||||||||||
Xuemei Zheng
|
4,345 | * | 4,345 | 0 | * | ||||||||||||||||||
Chang Hai Li
|
4,388 | * | 4,388 | 0 | * | ||||||||||||||||||
Zhaojie Zhang
|
4,441 | * | 4,441 | 0 | * | ||||||||||||||||||
Ming Cai Ye
|
4,608 | * | 4,608 | 0 | * | ||||||||||||||||||
Deyi Sun
|
4,740 | * | 4,740 | 0 | * | ||||||||||||||||||
Ji Xiang Wang
|
4,740 | * | 4,740 | 0 | * | ||||||||||||||||||
Jialan Huang
|
4,740 | * | 4,740 | 0 | * | ||||||||||||||||||
Shuqing Zhang
|
4,740 | * | 4,740 | 0 | * | ||||||||||||||||||
Wei Xie
|
4,740 | * | 4,740 | 0 | * | ||||||||||||||||||
Yuying Li
|
4,826 | * | 4,826 | 0 | * | ||||||||||||||||||
Guo Hui Wang
|
4,827 | * | 4,827 | 0 | * | ||||||||||||||||||
Jian Chun Qi
|
4,827 | * | 4,827 | 0 | * | ||||||||||||||||||
Shu Ran Zheng
|
4,827 | * | 4,827 | 0 | * | ||||||||||||||||||
Yanli Ma
|
4,827 | * | 4,827 | 0 | * | ||||||||||||||||||
Bing Yan Cui
|
4,828 | * | 4,828 | 0 | * | ||||||||||||||||||
Chunzhu Yang
|
4,828 | * | 4,828 | 0 | * | ||||||||||||||||||
Daowei Zhou
|
4,828 | * | 4,828 | 0 | * | ||||||||||||||||||
De Xiang Sun
|
4,828 | * | 4,828 | 0 | * | ||||||||||||||||||
Fan Lu Bai
|
4,828 | * | 4,828 | 0 | * | ||||||||||||||||||
Feng Qin Hao
|
4,828 | * | 4,828 | 0 | * | ||||||||||||||||||
Gui Jie Zhang
|
4,828 | * | 4,828 | 0 | * | ||||||||||||||||||
Guiying Zhou
|
4,828 | * | 4,828 | 0 | * | ||||||||||||||||||
Guo Wei
|
4,828 | * | 4,828 | 0 | * | ||||||||||||||||||
Hong Wei
Zhang |
4,828 | * | 4,828 | 0 | * | ||||||||||||||||||
87
| Shares Beneficially Owned Prior to the Offering (1) |
Shares Being Offered |
Shares Beneficially Owned After the Offering (1) |
|||||||||||||||||||||
|---|---|---|---|---|---|---|---|---|---|---|---|---|---|---|---|---|---|---|---|---|---|---|---|
| Name of Beneficial Owner |
Number |
Percentage (2) |
Number |
Percentage (2) | |||||||||||||||||||
Hui Dan Lu
|
4,828 | * | 4,828 | 0 | * | ||||||||||||||||||
Jiang Li
|
4,828 | * | 4,828 | 0 | * | ||||||||||||||||||
Jie Zhang
|
4,828 | * | 4,828 | 0 | * | ||||||||||||||||||
Jin Guo Zhang
|
4,828 | * | 4,828 | 0 | * | ||||||||||||||||||
Jin Song Wu
|
4,828 | * | 4,828 | 0 | * | ||||||||||||||||||
Jing Yang
|
4,828 | * | 4,828 | 0 | * | ||||||||||||||||||
Jingwu Zhang
|
4,828 | * | 4,828 | 0 | * | ||||||||||||||||||
Jun Hui Liu
|
4,828 | * | 4,828 | 0 | * | ||||||||||||||||||
Lanxiang Li
|
4,828 | * | 4,828 | 0 | * | ||||||||||||||||||
Li Ping Yang
|
4,828 | * | 4,828 | 0 | * | ||||||||||||||||||
Li Yu
|
4,828 | * | 4,828 | 0 | * | ||||||||||||||||||
Lijun Zhao
|
4,828 | * | 4,828 | 0 | * | ||||||||||||||||||
Mei Ying Xin
|
4,828 | * | 4,828 | 0 | * | ||||||||||||||||||
Mingwen Zhao
|
4,828 | * | 4,828 | 0 | * | ||||||||||||||||||
Ping Zhao
|
4,828 | * | 4,828 | 0 | * | ||||||||||||||||||
Qing Zhi Liu
|
4,828 | * | 4,828 | 0 | * | ||||||||||||||||||
Ru Xiao
|
4,828 | * | 4,828 | 0 | * | ||||||||||||||||||
Ruihua Sun
|
4,828 | * | 4,828 | 0 | * | ||||||||||||||||||
Shang Wei Hu
|
4,828 | * | 4,828 | 0 | * | ||||||||||||||||||
Shou Feng Du
|
4,828 | * | 4,828 | 0 | * | ||||||||||||||||||
Shuyuan Lu
|
4,828 | * | 4,828 | 0 | * | ||||||||||||||||||
Tiejun Liang
|
4,828 | * | 4,828 | 0 | * | ||||||||||||||||||
Ting Xiang Lv
|
4,828 | * | 4,828 | 0 | * | ||||||||||||||||||
Wan He Qin
|
4,828 | * | 4,828 | 0 | * | ||||||||||||||||||
Wen Chen
Zhang |
4,828 | * | 4,828 | 0 | * | ||||||||||||||||||
Wen Peng
|
4,828 | * | 4,828 | 0 | * | ||||||||||||||||||
Xiang Li Ma
|
4,828 | * | 4,828 | 0 | * | ||||||||||||||||||
Xiao Xiang
Lan |
4,828 | * | 4,828 | 0 | * | ||||||||||||||||||
Xin Liu
|
4,828 | * | 4,828 | 0 | * | ||||||||||||||||||
Xing Wei
Jiang |
4,828 | * | 4,828 | 0 | * | ||||||||||||||||||
Xirong Zhao
|
4,828 | * | 4,828 | 0 | * | ||||||||||||||||||
Xiuyan Ben
|
4,828 | * | 4,828 | 0 | * | ||||||||||||||||||
Yan Fei Sun
|
4,828 | * | 4,828 | 0 | * | ||||||||||||||||||
Yan Hong Gao
|
4,828 | * | 4,828 | 0 | * | ||||||||||||||||||
Yang Liu
|
4,828 | * | 4,828 | 0 | * | ||||||||||||||||||
Yanlin Zhang
|
4,828 | * | 4,828 | 0 | * | ||||||||||||||||||
Yongping Hu
|
4,828 | * | 4,828 | 0 | * | ||||||||||||||||||
Yu Ping Xu
|
4,828 | * | 4,828 | 0 | * | ||||||||||||||||||
Yu Qin He
|
4,828 | * | 4,828 | 0 | * | ||||||||||||||||||
Yu Rong Su
|
4,828 | * | 4,828 | 0 | * | ||||||||||||||||||
Yulan Yan
|
4,828 | * | 4,828 | 0 | * | ||||||||||||||||||
Yun Bai
|
4,828 | * | 4,828 | 0 | * | ||||||||||||||||||
Yuqin Ye
|
4,828 | * | 4,828 | 0 | * | ||||||||||||||||||
Zhanlin Zhang
|
4,828 | * | 4,828 | 0 | * | ||||||||||||||||||
Zhi An Tao
|
4,828 | * | 4,828 | 0 | * | ||||||||||||||||||
Zhi Ling Wang
|
4,828 | * | 4,828 | 0 | * | ||||||||||||||||||
Zhimin Li
|
4,828 | * | 4,828 | 0 | * | ||||||||||||||||||
Zhiying Zhang
|
4,828 | * | 4,828 | 0 | * | ||||||||||||||||||
Zu En Hu
|
4,828 | * | 4,828 | 0 | * | ||||||||||||||||||
88
| Shares Beneficially Owned Prior to the Offering (1) |
Shares Being Offered |
Shares Beneficially Owned After the Offering (1) |
|||||||||||||||||||||
|---|---|---|---|---|---|---|---|---|---|---|---|---|---|---|---|---|---|---|---|---|---|---|---|
| Name of Beneficial Owner |
Number |
Percentage (2) |
Number |
Percentage (2) | |||||||||||||||||||
Hong Li
|
4,898 | * | 4,898 | 0 | * | ||||||||||||||||||
Chang Yu
Zhang |
4,977 | * | 4,977 | 0 | * | ||||||||||||||||||
Chunbo Zhao
|
4,977 | * | 4,977 | 0 | * | ||||||||||||||||||
Jie Ming
|
4,977 | * | 4,977 | 0 | * | ||||||||||||||||||
Jumei Sun
|
4,977 | * | 4,977 | 0 | * | ||||||||||||||||||
Laibin Zhao
|
4,977 | * | 4,977 | 0 | * | ||||||||||||||||||
Lihong Tian
|
4,977 | * | 4,977 | 0 | * | ||||||||||||||||||
Wei Qiang Ji
|
4,977 | * | 4,977 | 0 | * | ||||||||||||||||||
Wenli Zhao
|
4,977 | * | 4,977 | 0 | * | ||||||||||||||||||
Xikui Qiao
|
4,977 | * | 4,977 | 0 | * | ||||||||||||||||||
Xiu Lian Sun
|
4,977 | * | 4,977 | 0 | * | ||||||||||||||||||
Yanju Zhao
|
4,977 | * | 4,977 | 0 | * | ||||||||||||||||||
Ying Huang
|
4,977 | * | 4,977 | 0 | * | ||||||||||||||||||
Yong Wei Han
|
4,977 | * | 4,977 | 0 | * | ||||||||||||||||||
Yongxia Zhu
|
4,977 | * | 4,977 | 0 | * | ||||||||||||||||||
Zhengze Huang
|
4,977 | * | 4,977 | 0 | * | ||||||||||||||||||
Zhi Min Liu
|
4,977 | * | 4,977 | 0 | * | ||||||||||||||||||
Zhiling Li
|
4,977 | * | 4,977 | 0 | * | ||||||||||||||||||
Dewei Zhao
|
5,000 | * | 5,000 | 0 | * | ||||||||||||||||||
Jianyi Yang
|
5,000 | * | 5,000 | 0 | * | ||||||||||||||||||
Ping Han
|
5,000 | * | 5,000 | 0 | * | ||||||||||||||||||
Shi Yi Li
|
5,000 | * | 5,000 | 0 | * | ||||||||||||||||||
Wei Cao
|
5,000 | * | 5,000 | 0 | * | ||||||||||||||||||
Xiaofeng Li
|
5,000 | * | 5,000 | 0 | * | ||||||||||||||||||
Xue Wang
|
5,000 | * | 5,000 | 0 | * | ||||||||||||||||||
Ling Shan
Kong |
5,119 | * | 5,119 | 0 | * | ||||||||||||||||||
Qiao Lian
Wang |
5,119 | * | 5,119 | 0 | * | ||||||||||||||||||
Dongmei Liu
|
5,214 | * | 5,214 | 0 | * | ||||||||||||||||||
Feng Hong
Liang |
5,214 | * | 5,214 | 0 | * | ||||||||||||||||||
He An Wang
|
5,214 | * | 5,214 | 0 | * | ||||||||||||||||||
Jing Zhao
|
5,214 | * | 5,214 | 0 | * | ||||||||||||||||||
Ku Chen
|
5,214 | * | 5,214 | 0 | * | ||||||||||||||||||
Lan Rong Zou
|
5,214 | * | 5,214 | 0 | * | ||||||||||||||||||
Ping Li
|
5,214 | * | 5,214 | 0 | * | ||||||||||||||||||
Xiao Dong Liu
|
5,214 | * | 5,214 | 0 | * | ||||||||||||||||||
Jun Lv
|
5,530 | * | 5,530 | 0 | * | ||||||||||||||||||
Zhiyuan Sun
|
5,530 | * | 5,530 | 0 | * | ||||||||||||||||||
Hui Li
|
5,609 | * | 5,609 | 0 | * | ||||||||||||||||||
Shuqin Zhang
|
5,609 | * | 5,609 | 0 | * | ||||||||||||||||||
Lianshan Chen
|
5,688 | * | 5,688 | 0 | * | ||||||||||||||||||
Chunying Yang
|
5,793 | * | 5,793 | 0 | * | ||||||||||||||||||
Sheng Jiang
Liu |
5,793 | * | 5,793 | 0 | * | ||||||||||||||||||
Shukun Mao
|
5,793 | * | 5,793 | 0 | * | ||||||||||||||||||
Xueshen Xu
|
5,793 | * | 5,793 | 0 | * | ||||||||||||||||||
Qing Guo Wang
|
6,070 | * | 6,070 | 0 | * | ||||||||||||||||||
Kaimei Tan
|
6,083 | * | 6,083 | 0 | * | ||||||||||||||||||
Yi Fei Lin
|
6,083 | * | 6,083 | 0 | * | ||||||||||||||||||
Feng Jun Xi
|
6,276 | * | 6,276 | 0 | * | ||||||||||||||||||
Rong Guo Li
|
6,320 | * | 6,320 | 0 | * | ||||||||||||||||||
89
| Shares Beneficially Owned Prior to the Offering (1) |
Shares Being Offered |
Shares Beneficially Owned After the Offering (1) |
|||||||||||||||||||||
|---|---|---|---|---|---|---|---|---|---|---|---|---|---|---|---|---|---|---|---|---|---|---|---|
| Name of Beneficial Owner |
Number |
Percentage (2) |
Number |
Percentage (2) | |||||||||||||||||||
Yan Hua Li
|
6,320 | * | 6,320 | 0 | * | ||||||||||||||||||
Yong Zheng
|
6,350 | * | 6,350 | 0 | * | ||||||||||||||||||
Songling Li
|
6,372 | * | 6,372 | 0 | * | ||||||||||||||||||
Yueying Yu
|
6,478 | * | 6,478 | 0 | * | ||||||||||||||||||
Shu Qin Han
|
6,510 | * | 6,510 | 0 | * | ||||||||||||||||||
Xiaoxia Xie
|
6,636 | * | 6,636 | 0 | * | ||||||||||||||||||
Feng Xian
Zhao |
6,758 | * | 6,758 | 0 | * | ||||||||||||||||||
Feng Ying
Tang |
6,758 | * | 6,758 | 0 | * | ||||||||||||||||||
Qing Sheng Li
|
6,758 | * | 6,758 | 0 | * | ||||||||||||||||||
Xiu Rong Liu
|
6,758 | * | 6,758 | 0 | * | ||||||||||||||||||
Anrong Wang
|
6,952 | * | 6,952 | 0 | * | ||||||||||||||||||
Guishan Wang
|
6,952 | * | 6,952 | 0 | * | ||||||||||||||||||
Xiuyun Zhang
|
6,952 | * | 6,952 | 0 | * | ||||||||||||||||||
Lifen Li
|
7,110 | * | 7,110 | 0 | * | ||||||||||||||||||
Bao Yu Xu
|
7,338 | * | 7,338 | 0 | * | ||||||||||||||||||
Bingyou Feng
|
7,466 | * | 7,466 | 0 | * | ||||||||||||||||||
Feng Qing Yu
|
7,466 | * | 7,466 | 0 | * | ||||||||||||||||||
Huimin Tian
|
7,466 | * | 7,466 | 0 | * | ||||||||||||||||||
Jiafang Xu
|
7,466 | * | 7,466 | 0 | * | ||||||||||||||||||
Tong Chen
|
7,466 | * | 7,466 | 0 | * | ||||||||||||||||||
Xueqiu Yu
|
7,466 | * | 7,466 | 0 | * | ||||||||||||||||||
Guangren
Zhang |
7,724 | * | 7,724 | 0 | * | ||||||||||||||||||
Honghua Zhen
|
7,724 | * | 7,724 | 0 | * | ||||||||||||||||||
Li Feng
|
7,724 | * | 7,724 | 0 | * | ||||||||||||||||||
Li Zhao
|
7,724 | * | 7,724 | 0 | * | ||||||||||||||||||
Xi Ling Tong
|
7,724 | * | 7,724 | 0 | * | ||||||||||||||||||
Lai Fa Wang
|
7,821 | * | 7,821 | 0 | * | ||||||||||||||||||
Yan Song Zhao
|
7,899 | * | 7,899 | 0 | * | ||||||||||||||||||
Chongbin Xiu
|
7,900 | * | 7,900 | 0 | * | ||||||||||||||||||
Deling Wang
|
7,900 | * | 7,900 | 0 | * | ||||||||||||||||||
Fenghua Li
|
7,900 | * | 7,900 | 0 | * | ||||||||||||||||||
Fengqin Li
|
7,900 | * | 7,900 | 0 | * | ||||||||||||||||||
Guanghua
Liang |
7,900 | * | 7,900 | 0 | * | ||||||||||||||||||
Guihua Yu
|
7,900 | * | 7,900 | 0 | * | ||||||||||||||||||
Guiqin Liu
|
7,900 | * | 7,900 | 0 | * | ||||||||||||||||||
Haiquan Yang
|
7,900 | * | 7,900 | 0 | * | ||||||||||||||||||
Haitao Yang
|
7,900 | * | 7,900 | 0 | * | ||||||||||||||||||
Hong Li
|
7,900 | * | 7,900 | 0 | * | ||||||||||||||||||
Huawei Mao
|
7,900 | * | 7,900 | 0 | * | ||||||||||||||||||
Li Zhao
|
7,900 | * | 7,900 | 0 | * | ||||||||||||||||||
Liping Xu
|
7,900 | * | 7,900 | 0 | * | ||||||||||||||||||
Liyuan Sun
|
7,900 | * | 7,900 | 0 | * | ||||||||||||||||||
Shouxin Ye
|
7,900 | * | 7,900 | 0 | * | ||||||||||||||||||
Shubin Cheng
|
7,900 | * | 7,900 | 0 | * | ||||||||||||||||||
Shuqing Wang
|
7,900 | * | 7,900 | 0 | * | ||||||||||||||||||
Wan Zhu Liu
|
7,900 | * | 7,900 | 0 | * | ||||||||||||||||||
Xiao Dong Liu
|
7,900 | * | 7,900 | 0 | * | ||||||||||||||||||
Xuehua Wang
|
7,900 | * | 7,900 | 0 | * | ||||||||||||||||||
Ya Bin Yu
|
7,900 | * | 7,900 | 0 | * | ||||||||||||||||||
90
| Shares Beneficially Owned Prior to the Offering (1) |
Shares Being Offered |
Shares Beneficially Owned After the Offering (1) |
|||||||||||||||||||||
|---|---|---|---|---|---|---|---|---|---|---|---|---|---|---|---|---|---|---|---|---|---|---|---|
| Name of Beneficial Owner |
Number |
Percentage (2) |
Number |
Percentage (2) | |||||||||||||||||||
Yanping Dong
|
7,900 | * | 7,900 | 0 | * | ||||||||||||||||||
Yanxi Wu
|
7,900 | * | 7,900 | 0 | * | ||||||||||||||||||
Ying Fu
|
7,900 | * | 7,900 | 0 | * | ||||||||||||||||||
Yongxin Hao
|
7,900 | * | 7,900 | 0 | * | ||||||||||||||||||
Yu Qin Shan
|
7,900 | * | 7,900 | 0 | * | ||||||||||||||||||
Zhenfeng Wang
|
7,900 | * | 7,900 | 0 | * | ||||||||||||||||||
Zhenjia Liu
|
7,900 | * | 7,900 | 0 | * | ||||||||||||||||||
Zhizhong Tao
|
7,900 | * | 7,900 | 0 | * | ||||||||||||||||||
Zun Li Gao
|
7,900 | * | 7,900 | 0 | * | ||||||||||||||||||
Qinghua Wu
|
7,917 | * | 7,917 | 0 | * | ||||||||||||||||||
Yan Jin
|
8,110 | * | 8,110 | 0 | * | ||||||||||||||||||
Jingzhi Sun
|
8,137 | * | 8,137 | 0 | * | ||||||||||||||||||
Fenglan Gao
|
8,295 | * | 8,295 | 0 | * | ||||||||||||||||||
Kunjun Xu
|
8,295 | * | 8,295 | 0 | * | ||||||||||||||||||
Wanyou Li
|
8,295 | * | 8,295 | 0 | * | ||||||||||||||||||
Wenming Guo
|
8,295 | * | 8,295 | 0 | * | ||||||||||||||||||
Xiaojie Wang
|
8,295 | * | 8,295 | 0 | * | ||||||||||||||||||
Tonghua Li
|
8,496 | * | 8,496 | 0 | * | ||||||||||||||||||
Shu Fen Lu
|
8,532 | * | 8,532 | 0 | * | ||||||||||||||||||
Su Zhen Wang
|
8,532 | * | 8,532 | 0 | * | ||||||||||||||||||
Xueqin Wang
|
8,532 | * | 8,532 | 0 | * | ||||||||||||||||||
Guan Wang
|
8,688 | * | 8,688 | 0 | * | ||||||||||||||||||
Bai Gang He
|
8,690 | * | 8,690 | 0 | * | ||||||||||||||||||
Bao Xiang Yu
|
8,690 | * | 8,690 | 0 | * | ||||||||||||||||||
Baoli Wang
|
8,690 | * | 8,690 | 0 | * | ||||||||||||||||||
Chang Jiang
Xia |
8,690 | * | 8,690 | 0 | * | ||||||||||||||||||
Changhai Guo
|
8,690 | * | 8,690 | 0 | * | ||||||||||||||||||
Cheng Lin Sun
|
8,690 | * | 8,690 | 0 | * | ||||||||||||||||||
Gui Zhi Sang
|
8,690 | * | 8,690 | 0 | * | ||||||||||||||||||
Hongju Liu
|
8,690 | * | 8,690 | 0 | * | ||||||||||||||||||
Hongyin Wu
|
8,690 | * | 8,690 | 0 | * | ||||||||||||||||||
Hui Tang
|
8,690 | * | 8,690 | 0 | * | ||||||||||||||||||
Hui Zhang
|
8,690 | * | 8,690 | 0 | * | ||||||||||||||||||
Jing Shen
|
8,690 | * | 8,690 | 0 | * | ||||||||||||||||||
Jinwen Fan
|
8,690 | * | 8,690 | 0 | * | ||||||||||||||||||
Jinxi Zheng
|
8,690 | * | 8,690 | 0 | * | ||||||||||||||||||
Jun Li
|
8,690 | * | 8,690 | 0 | * | ||||||||||||||||||
Lan Hu
|
8,690 | * | 8,690 | 0 | * | ||||||||||||||||||
Lijun Meng
|
8,690 | * | 8,690 | 0 | * | ||||||||||||||||||
Ling Wang
|
8,690 | * | 8,690 | 0 | * | ||||||||||||||||||
Luxia Ma
|
8,690 | * | 8,690 | 0 | * | ||||||||||||||||||
Mingdong
Zhang |
8,690 | * | 8,690 | 0 | * | ||||||||||||||||||
Nong Hua Tang
|
8,690 | * | 8,690 | 0 | * | ||||||||||||||||||
Qi Sun
|
8,690 | * | 8,690 | 0 | * | ||||||||||||||||||
Shou Zhi Wei
|
8,690 | * | 8,690 | 0 | * | ||||||||||||||||||
Shu You Gou
|
8,690 | * | 8,690 | 0 | * | ||||||||||||||||||
Shuyuan Li
|
8,690 | * | 8,690 | 0 | * | ||||||||||||||||||
Songzhi Ding
|
8,690 | * | 8,690 | 0 | * | ||||||||||||||||||
Tong Tong
|
8,690 | * | 8,690 | 0 | * | ||||||||||||||||||
91
| Shares Beneficially Owned Prior to the Offering (1) |
Shares Being Offered |
Shares Beneficially Owned After the Offering (1) |
|||||||||||||||||||||
|---|---|---|---|---|---|---|---|---|---|---|---|---|---|---|---|---|---|---|---|---|---|---|---|
| Name of Beneficial Owner |
Number |
Percentage (2) |
Number |
Percentage (2) | |||||||||||||||||||
Wei Ze Sun
|
8,690 | * | 8,690 | 0 | * | ||||||||||||||||||
Weiqi Wang
|
8,690 | * | 8,690 | 0 | * | ||||||||||||||||||
Wenying Liu
|
8,690 | * | 8,690 | 0 | * | ||||||||||||||||||
Xia Jiang
|
8,690 | * | 8,690 | 0 | * | ||||||||||||||||||
Xiu Ping Du
|
8,690 | * | 8,690 | 0 | * | ||||||||||||||||||
Xiu Yan Li
|
8,690 | * | 8,690 | 0 | * | ||||||||||||||||||
Xiufeng Shao
|
8,690 | * | 8,690 | 0 | * | ||||||||||||||||||
Xiuhua Li
|
8,690 | * | 8,690 | 0 | * | ||||||||||||||||||
Xiuhua Zhu
|
8,690 | * | 8,690 | 0 | * | ||||||||||||||||||
Xiuying Liu
|
8,690 | * | 8,690 | 0 | * | ||||||||||||||||||
Xuehai Li
|
8,690 | * | 8,690 | 0 | * | ||||||||||||||||||
Yan Feng Ji
|
8,690 | * | 8,690 | 0 | * | ||||||||||||||||||
Yan Qing Su
|
8,690 | * | 8,690 | 0 | * | ||||||||||||||||||
Yanlai Zhang
|
8,690 | * | 8,690 | 0 | * | ||||||||||||||||||
Yao Gang Zhou
|
8,690 | * | 8,690 | 0 | * | ||||||||||||||||||
Yaru Shang
|
8,690 | * | 8,690 | 0 | * | ||||||||||||||||||
Youcheng Yan
|
8,690 | * | 8,690 | 0 | * | ||||||||||||||||||
Yu Hua Mei
|
8,690 | * | 8,690 | 0 | * | ||||||||||||||||||
Yu Yan Zhao
|
8,690 | * | 8,690 | 0 | * | ||||||||||||||||||
Yun Lan Feng
|
8,690 | * | 8,690 | 0 | * | ||||||||||||||||||
Zhancai Gao
|
8,690 | * | 8,690 | 0 | * | ||||||||||||||||||
Zhao Yuan Liu
|
8,690 | * | 8,690 | 0 | * | ||||||||||||||||||
Zhao’an
Wan |
8,690 | * | 8,690 | 0 | * | ||||||||||||||||||
Hang Xu
|
8,703 | * | 8,703 | 0 | * | ||||||||||||||||||
Dexiang Yin
|
8,883 | * | 8,883 | 0 | * | ||||||||||||||||||
Lijun Sun
|
8,895 | * | 8,895 | 0 | * | ||||||||||||||||||
Shumei Di
|
8,927 | * | 8,927 | 0 | * | ||||||||||||||||||
Qing Zhong
Zhang |
9,069 | * | 9,069 | 0 | * | ||||||||||||||||||
Yong Lai Liu
|
9,211 | * | 9,211 | 0 | * | ||||||||||||||||||
Yongtian Liu
|
9,211 | * | 9,211 | 0 | * | ||||||||||||||||||
Qiu Ling Dong
|
9,322 | * | 9,322 | 0 | * | ||||||||||||||||||
Hong Li
|
9,654 | * | 9,654 | 0 | * | ||||||||||||||||||
Chang Li Dong
|
9,655 | * | 9,655 | 0 | * | ||||||||||||||||||
Changchun Li
|
9,655 | * | 9,655 | 0 | * | ||||||||||||||||||
Chun Yan Bai
|
9,655 | * | 9,655 | 0 | * | ||||||||||||||||||
Cui Ping Wang
|
9,655 | * | 9,655 | 0 | * | ||||||||||||||||||
Dong Ming Ge
|
9,655 | * | 9,655 | 0 | * | ||||||||||||||||||
Fei Yu
|
9,655 | * | 9,655 | 0 | * | ||||||||||||||||||
Feng Juan Liu
|
9,655 | * | 9,655 | 0 | * | ||||||||||||||||||
Feng Lan Sun
|
9,655 | * | 9,655 | 0 | * | ||||||||||||||||||
Feng Yun
Zhang |
9,655 | * | 9,655 | 0 | * | ||||||||||||||||||
Fuzhen Liu
|
9,655 | * | 9,655 | 0 | * | ||||||||||||||||||
Guangbo Jiang
|
9,655 | * | 9,655 | 0 | * | ||||||||||||||||||
Guo Yu Li
|
9,655 | * | 9,655 | 0 | * | ||||||||||||||||||
Hai Quan Cao
|
9,655 | * | 9,655 | 0 | * | ||||||||||||||||||
Hong Yan Gong
|
9,655 | * | 9,655 | 0 | * | ||||||||||||||||||
Lei Yu
|
9,655 | * | 9,655 | 0 | * | ||||||||||||||||||
Lei Zhang
|
9,655 | * | 9,655 | 0 | * | ||||||||||||||||||
Ming Xun Han
|
9,655 | * | 9,655 | 0 | * | ||||||||||||||||||
92
| Shares Beneficially Owned Prior to the Offering (1) |
Shares Being Offered |
Shares Beneficially Owned After the Offering (1) |
|||||||||||||||||||||
|---|---|---|---|---|---|---|---|---|---|---|---|---|---|---|---|---|---|---|---|---|---|---|---|
| Name of Beneficial Owner |
Number |
Percentage (2) |
Number |
Percentage (2) | |||||||||||||||||||
Rong Hua Yan
|
9,655 | * | 9,655 | 0 | * | ||||||||||||||||||
Shuang Yan
Liu |
9,655 | * | 9,655 | 0 | * | ||||||||||||||||||
Shumei Shan
|
9,655 | * | 9,655 | 0 | * | ||||||||||||||||||
Wei Dong
|
9,655 | * | 9,655 | 0 | * | ||||||||||||||||||
Wei Xue Shan
|
9,655 | * | 9,655 | 0 | * | ||||||||||||||||||
Xiu Qin Zhang
|
9,655 | * | 9,655 | 0 | * | ||||||||||||||||||
Xiu Ying Yu
|
9,655 | * | 9,655 | 0 | * | ||||||||||||||||||
Yan Ju Liu
|
9,655 | * | 9,655 | 0 | * | ||||||||||||||||||
Yan Jun Gao
|
9,655 | * | 9,655 | 0 | * | ||||||||||||||||||
Ye Tian
|
9,655 | * | 9,655 | 0 | * | ||||||||||||||||||
Yun Xia Jiang
|
9,655 | * | 9,655 | 0 | * | ||||||||||||||||||
Yuqin Shang
|
9,655 | * | 9,655 | 0 | * | ||||||||||||||||||
Zhen Hua Yuan
|
9,655 | * | 9,655 | 0 | * | ||||||||||||||||||
Lijuan Qi
|
9,656 | * | 9,656 | 0 | * | ||||||||||||||||||
Yuhua Liu
|
9,717 | * | 9,717 | 0 | * | ||||||||||||||||||
Ting Shan Yan
|
9,948 | * | 9,948 | 0 | * | ||||||||||||||||||
Gui Yan Yin
|
9,954 | * | 9,954 | 0 | * | ||||||||||||||||||
Hong Zeng Sun
|
9,954 | * | 9,954 | 0 | * | ||||||||||||||||||
Airong Wang
|
10,000 | * | 10,000 | 0 | * | ||||||||||||||||||
Bainian Li
|
10,000 | * | 10,000 | 0 | * | ||||||||||||||||||
Baoguo Cui
|
10,000 | * | 10,000 | 0 | * | ||||||||||||||||||
Fei Su
|
10,000 | * | 10,000 | 0 | * | ||||||||||||||||||
Guangzhong Li
|
10,000 | * | 10,000 | 0 | * | ||||||||||||||||||
Jianguo Tan
|
10,000 | * | 10,000 | 0 | * | ||||||||||||||||||
Jixu Wen
|
10,000 | * | 10,000 | 0 | * | ||||||||||||||||||
Lianfa Sun
|
10,000 | * | 10,000 | 0 | * | ||||||||||||||||||
Senjian Gao
|
10,000 | * | 10,000 | 0 | * | ||||||||||||||||||
Shibo Zhang
|
10,000 | * | 10,000 | 0 | * | ||||||||||||||||||
Shufang Men
|
10,000 | * | 10,000 | 0 | * | ||||||||||||||||||
Tiejun Zou
|
10,000 | * | 10,000 | 0 | * | ||||||||||||||||||
Weili Wang
|
10,000 | * | 10,000 | 0 | * | ||||||||||||||||||
Xiaojun Shen
|
10,000 | * | 10,000 | 0 | * | ||||||||||||||||||
Xiaozhong Liu
|
10,000 | * | 10,000 | 0 | * | ||||||||||||||||||
Xiuying Ma
|
10,000 | * | 10,000 | 0 | * | ||||||||||||||||||
Youpeng Wang
|
10,000 | * | 10,000 | 0 | * | ||||||||||||||||||
Yulan Zhang
|
10,000 | * | 10,000 | 0 | * | ||||||||||||||||||
Zhiming Zhang
|
10,000 | * | 10,000 | 0 | * | ||||||||||||||||||
Zhiwei Liu
|
10,000 | * | 10,000 | 0 | * | ||||||||||||||||||
Yanjun Liu
|
10,042 | * | 10,042 | 0 | * | ||||||||||||||||||
Yaxiang Wang
|
10,153 | * | 10,153 | 0 | * | ||||||||||||||||||
Yan Cai Zhang
|
10,390 | * | 10,390 | 0 | * | ||||||||||||||||||
Hui Wang
|
10,428 | * | 10,428 | 0 | * | ||||||||||||||||||
Ben Ming Zang
|
10,524 | * | 10,524 | 0 | * | ||||||||||||||||||
Limin Zhang
|
10,949 | * | 10,949 | 0 | * | ||||||||||||||||||
Chang Hui Ma
|
10,972 | * | 10,972 | 0 | * | ||||||||||||||||||
Jinhui Chen
|
11,115 | * | 11,115 | 0 | * | ||||||||||||||||||
Shu Jun Cui
|
11,142 | * | 11,142 | 0 | * | ||||||||||||||||||
Hongtao Zhang
|
11,447 | * | 11,447 | 0 | * | ||||||||||||||||||
Qing Chun
Wang |
11,566 | * | 11,566 | 0 | * | ||||||||||||||||||
93
| Shares Beneficially Owned Prior to the Offering (1) |
Shares Being Offered |
Shares Beneficially Owned After the Offering (1) |
|||||||||||||||||||||
|---|---|---|---|---|---|---|---|---|---|---|---|---|---|---|---|---|---|---|---|---|---|---|---|
| Name of Beneficial Owner |
Number |
Percentage (2) |
Number |
Percentage (2) | |||||||||||||||||||
Ping Lin
|
11,586 | * | 11,586 | 0 | * | ||||||||||||||||||
Shu Fen Wan
|
11,586 | * | 11,586 | 0 | * | ||||||||||||||||||
Wei Liu
|
11,586 | * | 11,586 | 0 | * | ||||||||||||||||||
Ze Chu
|
11,586 | * | 11,586 | 0 | * | ||||||||||||||||||
Bin Qin
|
11,850 | * | 11,850 | 0 | * | ||||||||||||||||||
Junying Zhu
|
11,850 | * | 11,850 | 0 | * | ||||||||||||||||||
Liping Zhang
|
11,850 | * | 11,850 | 0 | * | ||||||||||||||||||
Minghai Zhang
|
11,850 | * | 11,850 | 0 | * | ||||||||||||||||||
Xue Feng Bai
|
11,850 | * | 11,850 | 0 | * | ||||||||||||||||||
Liping Xu
|
12,166 | * | 12,166 | 0 | * | ||||||||||||||||||
Shu Yu Li
|
12,166 | * | 12,166 | 0 | * | ||||||||||||||||||
Yu Xiang Li
|
12,166 | * | 12,166 | 0 | * | ||||||||||||||||||
Yaqin Fan
|
12,288 | * | 12,288 | 0 | * | ||||||||||||||||||
Yuanchang Liu
|
12,340 | * | 12,340 | 0 | * | ||||||||||||||||||
Jinping Xia
|
12,443 | * | 12,443 | 0 | * | ||||||||||||||||||
Lei Wang
|
12,443 | * | 12,443 | 0 | * | ||||||||||||||||||
Qing Zhi Hu
|
12,443 | * | 12,443 | 0 | * | ||||||||||||||||||
Xiling Yu
|
12,443 | * | 12,443 | 0 | * | ||||||||||||||||||
Zhi Ping Li
|
12,443 | * | 12,443 | 0 | * | ||||||||||||||||||
Kebin Ma
|
12,552 | * | 12,552 | 0 | * | ||||||||||||||||||
Bao Shan Li
|
13,035 | * | 13,035 | 0 | * | ||||||||||||||||||
Haijie Zhou
|
13,035 | * | 13,035 | 0 | * | ||||||||||||||||||
Lian Min Tan
|
13,035 | * | 13,035 | 0 | * | ||||||||||||||||||
Minghui Jiang
|
13,051 | * | 13,051 | 0 | * | ||||||||||||||||||
Xiu Qin Wan
|
13,114 | * | 13,114 | 0 | * | ||||||||||||||||||
Huijian Xue
|
13,193 | * | 13,193 | 0 | * | ||||||||||||||||||
Yuqin Chen
|
13,272 | * | 13,272 | 0 | * | ||||||||||||||||||
Yan Qiu Yu
|
13,383 | * | 13,383 | 0 | * | ||||||||||||||||||
Jian Sheng
Yan |
13,518 | * | 13,518 | 0 | * | ||||||||||||||||||
Ying Xue
|
13,518 | * | 13,518 | 0 | * | ||||||||||||||||||
Chun Yu Zhou
|
13,667 | * | 13,667 | 0 | * | ||||||||||||||||||
Rui Shan
Zhang |
13,890 | * | 13,890 | 0 | * | ||||||||||||||||||
Hua Chen Wang
|
13,904 | * | 13,904 | 0 | * | ||||||||||||||||||
Qiu Yan Zhu
|
14,482 | * | 14,482 | 0 | * | ||||||||||||||||||
Duowen Wang
|
14,483 | * | 14,483 | 0 | * | ||||||||||||||||||
Gui Fen Qiu
|
14,483 | * | 14,483 | 0 | * | ||||||||||||||||||
Guoshun Jiang
|
14,483 | * | 14,483 | 0 | * | ||||||||||||||||||
Hong Da Xu
|
14,483 | * | 14,483 | 0 | * | ||||||||||||||||||
Hongzhu Qi
|
14,483 | * | 14,483 | 0 | * | ||||||||||||||||||
Li Luan
|
14,483 | * | 14,483 | 0 | * | ||||||||||||||||||
Tong Bin Xie
|
14,483 | * | 14,483 | 0 | * | ||||||||||||||||||
Xiao Li Xu
|
14,483 | * | 14,483 | 0 | * | ||||||||||||||||||
Xiaofei Hou
|
14,483 | * | 14,483 | 0 | * | ||||||||||||||||||
Xue Zhi Liang
|
14,483 | * | 14,483 | 0 | * | ||||||||||||||||||
Yu Fen Zhang
|
14,483 | * | 14,483 | 0 | * | ||||||||||||||||||
Yu Ren Bai
|
14,483 | * | 14,483 | 0 | * | ||||||||||||||||||
Zhaoguang Xu
|
14,483 | * | 14,483 | 0 | * | ||||||||||||||||||
Youren Zhu
|
14,869 | * | 14,869 | 0 | * | ||||||||||||||||||
Changyou Li
|
15,000 | * | 15,000 | 0 | * | ||||||||||||||||||
94
| Shares Beneficially Owned Prior to the Offering (1) |
Shares Being Offered |
Shares Beneficially Owned After the Offering (1) |
|||||||||||||||||||||
|---|---|---|---|---|---|---|---|---|---|---|---|---|---|---|---|---|---|---|---|---|---|---|---|
| Name of Beneficial Owner |
Number |
Percentage (2) |
Number |
Percentage (2) | |||||||||||||||||||
Zhijie Lei
|
15,000 | * | 15,000 | 0 | * | ||||||||||||||||||
You Min Lv
|
15,096 | * | 15,096 | 0 | * | ||||||||||||||||||
Xiang Xun Han
|
15,448 | * | 15,448 | 0 | * | ||||||||||||||||||
Bin Wang
|
15,800 | * | 15,800 | 0 | * | ||||||||||||||||||
Bolun Li
|
15,800 | * | 15,800 | 0 | * | ||||||||||||||||||
Changdi Niu
|
15,800 | * | 15,800 | 0 | * | ||||||||||||||||||
Changmin Zhao
|
15,800 | * | 15,800 | 0 | * | ||||||||||||||||||
Fengping Dong
|
15,800 | * | 15,800 | 0 | * | ||||||||||||||||||
Fulun Huang
|
15,800 | * | 15,800 | 0 | * | ||||||||||||||||||
Haisong Wang
|
15,800 | * | 15,800 | 0 | * | ||||||||||||||||||
Huaiyu Xu
|
15,800 | * | 15,800 | 0 | * | ||||||||||||||||||
Hui Gao
|
15,800 | * | 15,800 | 0 | * | ||||||||||||||||||
Huijun Zhang
|
15,800 | * | 15,800 | 0 | * | ||||||||||||||||||
Jinguo Wang
|
15,800 | * | 15,800 | 0 | * | ||||||||||||||||||
Kemin Cao
|
15,800 | * | 15,800 | 0 | * | ||||||||||||||||||
Meng Yang
|
15,800 | * | 15,800 | 0 | * | ||||||||||||||||||
Qingyi Meng
|
15,800 | * | 15,800 | 0 | * | ||||||||||||||||||
Qiong Wu
|
15,800 | * | 15,800 | 0 | * | ||||||||||||||||||
Ruihong Fan
|
15,800 | * | 15,800 | 0 | * | ||||||||||||||||||
Shihua You
|
15,800 | * | 15,800 | 0 | * | ||||||||||||||||||
Shuling Li
|
15,800 | * | 15,800 | 0 | * | ||||||||||||||||||
Shuwen Liu
|
15,800 | * | 15,800 | 0 | * | ||||||||||||||||||
Wei Liu
|
15,800 | * | 15,800 | 0 | * | ||||||||||||||||||
Xiufang Yang
|
15,800 | * | 15,800 | 0 | * | ||||||||||||||||||
Yan Jiang
Zhang |
15,800 | * | 15,800 | 0 | * | ||||||||||||||||||
Yanjie Jiang
|
15,800 | * | 15,800 | 0 | * | ||||||||||||||||||
Yanyan Li
|
15,800 | * | 15,800 | 0 | * | ||||||||||||||||||
Yao Cheng
Chen |
15,800 | * | 15,800 | 0 | * | ||||||||||||||||||
Ying Wang
|
15,800 | * | 15,800 | 0 | * | ||||||||||||||||||
Yongchang
Chen |
15,800 | * | 15,800 | 0 | * | ||||||||||||||||||
Yunyi Liu
|
15,800 | * | 15,800 | 0 | * | ||||||||||||||||||
Zhenxin Gu
|
15,800 | * | 15,800 | 0 | * | ||||||||||||||||||
Zhimin Wang
|
15,800 | * | 15,800 | 0 | * | ||||||||||||||||||
Guoxiang Bai
|
16,195 | * | 16,195 | 0 | * | ||||||||||||||||||
Yansong Wang
|
16,413 | * | 16,413 | 0 | * | ||||||||||||||||||
Xiuli Wang
|
16,414 | * | 16,414 | 0 | * | ||||||||||||||||||
Cai Ying
Zhang |
16,432 | * | 16,432 | 0 | * | ||||||||||||||||||
Yao Wen Sun
|
16,511 | * | 16,511 | 0 | * | ||||||||||||||||||
Bing Liu
|
16,590 | * | 16,590 | 0 | * | ||||||||||||||||||
Cuiyun Liu
|
16,590 | * | 16,590 | 0 | * | ||||||||||||||||||
Shu Qin Meng
|
16,590 | * | 16,590 | 0 | * | ||||||||||||||||||
Liping Liu
|
16,666 | * | 16,666 | 0 | * | ||||||||||||||||||
Guihua Xu
|
16,985 | * | 16,985 | 0 | * | ||||||||||||||||||
Ou Xu
|
16,994 | * | 16,994 | 0 | * | ||||||||||||||||||
Longfang Xia
|
17,121 | * | 17,121 | 0 | * | ||||||||||||||||||
Yingyu Cui
|
17,379 | * | 17,379 | 0 | * | ||||||||||||||||||
Chong Ming Li
|
17,380 | * | 17,380 | 0 | * | ||||||||||||||||||
Cuiyin Wei
|
17,380 | * | 17,380 | 0 | * | ||||||||||||||||||
Guang Fen
Yang |
17,380 | * | 17,380 | 0 | * | ||||||||||||||||||
95
| Shares Beneficially Owned Prior to the Offering (1) |
Shares Being Offered |
Shares Beneficially Owned After the Offering (1) |
|||||||||||||||||||||
|---|---|---|---|---|---|---|---|---|---|---|---|---|---|---|---|---|---|---|---|---|---|---|---|
| Name of Beneficial Owner |
Number |
Percentage (2) |
Number |
Percentage (2) | |||||||||||||||||||
Guijie Liu
|
17,380 | * | 17,380 | 0 | * | ||||||||||||||||||
Hai Tao Jiang
|
17,380 | * | 17,380 | 0 | * | ||||||||||||||||||
Hua Chen
|
17,380 | * | 17,380 | 0 | * | ||||||||||||||||||
Ji Gui Chu
|
17,380 | * | 17,380 | 0 | * | ||||||||||||||||||
Ke Min Wang
|
17,380 | * | 17,380 | 0 | * | ||||||||||||||||||
Li Yan Sun
|
17,380 | * | 17,380 | 0 | * | ||||||||||||||||||
Lianke Han
|
17,380 | * | 17,380 | 0 | * | ||||||||||||||||||
Qingtao Zhang
|
17,380 | * | 17,380 | 0 | * | ||||||||||||||||||
Qingyuan
Zhang |
17,380 | * | 17,380 | 0 | * | ||||||||||||||||||
Rong Chang
Tang |
17,380 | * | 17,380 | 0 | * | ||||||||||||||||||
Shi Long Bai
|
17,380 | * | 17,380 | 0 | * | ||||||||||||||||||
Tai Zhao Li
|
17,380 | * | 17,380 | 0 | * | ||||||||||||||||||
Xiangmin Shi
|
17,380 | * | 17,380 | 0 | * | ||||||||||||||||||
Xin Pu
|
17,380 | * | 17,380 | 0 | * | ||||||||||||||||||
Xin Wang
|
17,380 | * | 17,380 | 0 | * | ||||||||||||||||||
Yankui Song
|
17,380 | * | 17,380 | 0 | * | ||||||||||||||||||
Yanwu Wang
|
17,380 | * | 17,380 | 0 | * | ||||||||||||||||||
Yulin Liu
|
17,380 | * | 17,380 | 0 | * | ||||||||||||||||||
Yun Lou Li
|
17,380 | * | 17,380 | 0 | * | ||||||||||||||||||
Zhenhe Jian
|
17,380 | * | 17,380 | 0 | * | ||||||||||||||||||
Qinggang Wu
|
18,345 | * | 18,345 | 0 | * | ||||||||||||||||||
Yan Xia Wang
|
18,345 | * | 18,345 | 0 | * | ||||||||||||||||||
Jian Hua Peng
|
18,574 | * | 18,574 | 0 | * | ||||||||||||||||||
Hong Yun Liu
|
19,311 | * | 19,311 | 0 | * | ||||||||||||||||||
Lida Wu
|
19,311 | * | 19,311 | 0 | * | ||||||||||||||||||
Qiuyan Chen
|
19,311 | * | 19,311 | 0 | * | ||||||||||||||||||
Yu Xi Zhang
|
19,311 | * | 19,311 | 0 | * | ||||||||||||||||||
Min Li Wang
|
19,500 | * | 19,500 | 0 | * | ||||||||||||||||||
Changfei Yu
|
19,750 | * | 19,750 | 0 | * | ||||||||||||||||||
Feng Shu Dong
|
19,863 | * | 19,863 | 0 | * | ||||||||||||||||||
Zhenlai Li
|
19,908 | * | 19,908 | 0 | * | ||||||||||||||||||
Chaoyang Liu
|
20,000 | * | 20,000 | 0 | * | ||||||||||||||||||
Chengming Cui
|
20,000 | * | 20,000 | 0 | * | ||||||||||||||||||
Chunyan Sun
|
20,000 | * | 20,000 | 0 | * | ||||||||||||||||||
Daming Feng
|
20,000 | * | 20,000 | 0 | * | ||||||||||||||||||
Dan Wang
|
20,000 | * | 20,000 | 0 | * | ||||||||||||||||||
Dewen Liu
|
20,000 | * | 20,000 | 0 | * | ||||||||||||||||||
Fuying Wang
|
20,000 | * | 20,000 | 0 | * | ||||||||||||||||||
Guizhu Wang
|
20,000 | * | 20,000 | 0 | * | ||||||||||||||||||
Jin’nian
Liu |
20,000 | * | 20,000 | 0 | * | ||||||||||||||||||
Jiyu Wang
|
20,000 | * | 20,000 | 0 | * | ||||||||||||||||||
Lijun Sun
|
20,000 | * | 20,000 | 0 | * | ||||||||||||||||||
Lixin Liu
|
20,000 | * | 20,000 | 0 | * | ||||||||||||||||||
Ming Yan
|
20,000 | * | 20,000 | 0 | * | ||||||||||||||||||
Ping Wang
|
20,000 | * | 20,000 | 0 | * | ||||||||||||||||||
Ruidong Guan
|
20,000 | * | 20,000 | 0 | * | ||||||||||||||||||
Tinghui Wang
|
20,000 | * | 20,000 | 0 | * | ||||||||||||||||||
Xin’gang
Sun |
20,000 | * | 20,000 | 0 | * | ||||||||||||||||||
Xuan Li
|
20,000 | * | 20,000 | 0 | * | ||||||||||||||||||
96
| Shares Beneficially Owned Prior to the Offering (1) |
Shares Being Offered |
Shares Beneficially Owned After the Offering (1) |
|||||||||||||||||||||
|---|---|---|---|---|---|---|---|---|---|---|---|---|---|---|---|---|---|---|---|---|---|---|---|
| Name of Beneficial Owner |
Number |
Percentage (2) |
Number |
Percentage (2) | |||||||||||||||||||
Xuexian Wang
|
20,000 | * | 20,000 | 0 | * | ||||||||||||||||||
Yanru Dong
|
20,000 | * | 20,000 | 0 | * | ||||||||||||||||||
Zhongwei Luo
|
20,000 | * | 20,000 | 0 | * | ||||||||||||||||||
Yan Long Ren
|
20,856 | * | 6,952 | 13,904 | * | ||||||||||||||||||
Qing Li
|
21,014 | * | 7,005 | 14,009 | * | ||||||||||||||||||
Fu Lin Bian
|
21,242 | * | 7,081 | 14,161 | * | ||||||||||||||||||
Yuanhui Dong
|
21,242 | * | 7,081 | 14,161 | * | ||||||||||||||||||
Guifang Zhang
|
21,396 | * | 7,132 | 14,264 | * | ||||||||||||||||||
Shuhua Zhao
|
21,567 | * | 7,189 | 14,378 | * | ||||||||||||||||||
Guo Chao Duan
|
22,120 | * | 7,373 | 14,747 | * | ||||||||||||||||||
Gui Fang Tan
|
22,208 | * | 7,403 | 14,805 | * | ||||||||||||||||||
Jindao Zhang
|
22,208 | * | 7,403 | 14,805 | * | ||||||||||||||||||
Jing Li
|
23,068 | * | 7,689 | 15,379 | * | ||||||||||||||||||
Xingcun Zhao
|
23,068 | * | 7,689 | 15,379 | * | ||||||||||||||||||
Yanping Cao
|
23,147 | * | 7,716 | 15,431 | * | ||||||||||||||||||
Zhi Ping Hao
|
23,173 | * | 7,724 | 15,449 | * | ||||||||||||||||||
Hui Cao
|
23,226 | * | 7,742 | 15,484 | * | ||||||||||||||||||
Chuanhong Fan
|
23,700 | * | 7,900 | 15,800 | * | ||||||||||||||||||
Chunyan Liu
|
23,700 | * | 7,900 | 15,800 | * | ||||||||||||||||||
Da Mao Yang
|
23,700 | * | 7,900 | 15,800 | * | ||||||||||||||||||
Fumin Jiang
|
23,700 | * | 7,900 | 15,800 | * | ||||||||||||||||||
Jialin Yu
|
23,700 | * | 7,900 | 15,800 | * | ||||||||||||||||||
Jin Zhong
Wang |
23,700 | * | 7,900 | 15,800 | * | ||||||||||||||||||
Jinghua Guo
|
23,700 | * | 7,900 | 15,800 | * | ||||||||||||||||||
Juan Wang
|
23,700 | * | 7,900 | 15,800 | * | ||||||||||||||||||
Li Hua Wang
|
23,700 | * | 7,900 | 15,800 | * | ||||||||||||||||||
Li Qui Zhang
|
23,700 | * | 7,900 | 15,800 | * | ||||||||||||||||||
Li Xin Fan
|
23,700 | * | 7,900 | 15,800 | * | ||||||||||||||||||
Long Zhou
|
23,700 | * | 7,900 | 15,800 | * | ||||||||||||||||||
Minjun Ren
|
23,700 | * | 7,900 | 15,800 | * | ||||||||||||||||||
Shu Min Cao
|
23,700 | * | 7,900 | 15,800 | * | ||||||||||||||||||
Wan Hua Li
|
23,700 | * | 7,900 | 15,800 | * | ||||||||||||||||||
Xiao Chun
Jing |
23,700 | * | 7,900 | 15,800 | * | ||||||||||||||||||
Xinghua Song
|
23,700 | * | 7,900 | 15,800 | * | ||||||||||||||||||
Yanhui Liu
|
23,700 | * | 7,900 | 15,800 | * | ||||||||||||||||||
Yanyan Zhang
|
23,700 | * | 7,900 | 15,800 | * | ||||||||||||||||||
Zhong Li
|
23,700 | * | 7,900 | 15,800 | * | ||||||||||||||||||
Zhuo Zhang
|
23,700 | * | 7,900 | 15,800 | * | ||||||||||||||||||
Dechun Zhang
|
24,138 | * | 8,046 | 16,092 | * | ||||||||||||||||||
Lihua Yang
|
24,138 | * | 8,046 | 16,092 | * | ||||||||||||||||||
Shengmao Liu
|
24,138 | * | 8,046 | 16,092 | * | ||||||||||||||||||
Yu Mei Bai
|
24,138 | * | 8,046 | 16,092 | * | ||||||||||||||||||
Guo Wen Li
|
24,525 | * | 8,175 | 16,350 | * | ||||||||||||||||||
Jing Hua Guan
|
24,885 | * | 8,295 | 16,590 | * | ||||||||||||||||||
Li Hua Yu
|
24,885 | * | 8,295 | 16,590 | * | ||||||||||||||||||
Shu Yan
|
24,885 | * | 8,295 | 16,590 | * | ||||||||||||||||||
Hui Leng
|
25,000 | * | 8,333 | 16,667 | * | ||||||||||||||||||
Weihong Zhang
|
25,000 | * | 8,333 | 16,667 | * | ||||||||||||||||||
Zhen Jiang
Lian |
25,122 | * | 8,374 | 16,748 | * | ||||||||||||||||||
97
| Shares Beneficially Owned Prior to the Offering (1) |
Shares Being Offered |
Shares Beneficially Owned After the Offering (1) |
|||||||||||||||||||||
|---|---|---|---|---|---|---|---|---|---|---|---|---|---|---|---|---|---|---|---|---|---|---|---|
| Name of Beneficial Owner |
Number |
Percentage (2) |
Number |
Percentage (2) | |||||||||||||||||||
Congwei Chen
|
25,280 | * | 8,427 | 16,853 | * | ||||||||||||||||||
Ying Liu
|
25,455 | * | 8,485 | 16,970 | * | ||||||||||||||||||
Xi Bin Liu
|
25,722 | * | 8,574 | 17,148 | * | ||||||||||||||||||
Fengxia Liu
|
26,070 | * | 8,690 | 17,380 | * | ||||||||||||||||||
Guo Xu
|
26,070 | * | 8,690 | 17,380 | * | ||||||||||||||||||
Shi Gang Lin
|
26,070 | * | 8,690 | 17,380 | * | ||||||||||||||||||
Wei Tian
|
26,070 | * | 8,690 | 17,380 | * | ||||||||||||||||||
Xiangjiu Li
|
26,070 | * | 8,690 | 17,380 | * | ||||||||||||||||||
Xiaoli Wen
|
26,070 | * | 8,690 | 17,380 | * | ||||||||||||||||||
Xiumin Zhang
|
26,070 | * | 8,690 | 17,380 | * | ||||||||||||||||||
Bailing Yin
|
27,966 | * | 9,322 | 18,644 | * | ||||||||||||||||||
Hui Lan Chi
|
28,001 | * | 9,334 | 18,667 | * | ||||||||||||||||||
Hong Peng
|
28,966 | * | 9,655 | 19,311 | * | ||||||||||||||||||
Meichun Wang
|
28,966 | * | 9,655 | 19,311 | * | ||||||||||||||||||
Tai Yang Wang
|
28,966 | * | 9,655 | 19,311 | * | ||||||||||||||||||
Yanhua Chen
|
28,966 | * | 9,655 | 19,311 | * | ||||||||||||||||||
Yin Qi Cui
|
29,033 | * | 9,678 | 19,355 | * | ||||||||||||||||||
Bin Hu
|
30,000 | * | 10,000 | 20,000 | * | ||||||||||||||||||
Chuanbao Gu
|
30,000 | * | 10,000 | 20,000 | * | ||||||||||||||||||
Deming Li
|
30,000 | * | 10,000 | 20,000 | * | ||||||||||||||||||
Guoliang Wu
|
30,000 | * | 10,000 | 20,000 | * | ||||||||||||||||||
Lili Wen
|
30,000 | * | 10,000 | 20,000 | * | ||||||||||||||||||
Wenjia Yuan
|
30,000 | * | 10,000 | 20,000 | * | ||||||||||||||||||
Yi Zhang
|
30,000 | * | 10,000 | 20,000 | * | ||||||||||||||||||
Yonggang Sun
|
30,000 | * | 10,000 | 20,000 | * | ||||||||||||||||||
Yonglin Gao
|
30,000 | * | 10,000 | 20,000 | * | ||||||||||||||||||
Yuan Guang
|
30,000 | * | 10,000 | 20,000 | * | ||||||||||||||||||
Shanling Wang
|
30,415 | * | 10,138 | 20,277 | * | ||||||||||||||||||
Hua Guo
|
30,856 | * | 10,285 | 20,571 | * | ||||||||||||||||||
Qingzhen Yuan
|
31,521 | * | 10,507 | 21,014 | * | ||||||||||||||||||
Chunping
Zhang |
31,600 | * | 10,533 | 21,067 | * | ||||||||||||||||||
Dong Yan Guan
|
31,600 | * | 10,533 | 21,067 | * | ||||||||||||||||||
Gong Shen
|
31,600 | * | 10,533 | 21,067 | * | ||||||||||||||||||
Guang Xia
Wang |
31,600 | * | 10,533 | 21,067 | * | ||||||||||||||||||
Jing Liu
|
31,600 | * | 10,533 | 21,067 | * | ||||||||||||||||||
Qingshu Zhao
|
31,600 | * | 10,533 | 21,067 | * | ||||||||||||||||||
Wei Guo
|
31,600 | * | 10,533 | 21,067 | * | ||||||||||||||||||
Xingwei Xu
|
31,600 | * | 10,533 | 21,067 | * | ||||||||||||||||||
Rui Zhi Dong
|
32,225 | * | 10,742 | 21,483 | * | ||||||||||||||||||
Yanping Xu
|
33,180 | * | 11,060 | 22,120 | * | ||||||||||||||||||
Zhi Fan Jiao
|
33,197 | * | 11,066 | 22,131 | * | ||||||||||||||||||
Jie Yu
|
33,601 | * | 11,200 | 22,401 | * | ||||||||||||||||||
Chunfang Wang
|
33,749 | * | 11,250 | 22,499 | * | ||||||||||||||||||
Zhao Ping
Meng |
34,491 | * | 11,497 | 22,994 | * | ||||||||||||||||||
Guilian Zhang
|
34,523 | * | 11,508 | 23,015 | * | ||||||||||||||||||
Fengling Shan
|
34,760 | * | 11,587 | 23,173 | * | ||||||||||||||||||
Fujin Zhang
|
34,760 | * | 11,587 | 23,173 | * | ||||||||||||||||||
Hengdong
Zhang |
34,760 | * | 11,587 | 23,173 | * | ||||||||||||||||||
Min Wang
|
34,760 | * | 11,587 | 23,173 | * | ||||||||||||||||||
98
| Shares Beneficially Owned Prior to the Offering (1) |
Shares Being Offered |
Shares Beneficially Owned After the Offering (1) |
|||||||||||||||||||||
|---|---|---|---|---|---|---|---|---|---|---|---|---|---|---|---|---|---|---|---|---|---|---|---|
| Name of Beneficial Owner |
Number |
Percentage (2) |
Number |
Percentage (2) | |||||||||||||||||||
Tie Li
|
35,343 | * | 11,781 | 23,562 | * | ||||||||||||||||||
Yanrong Wei
|
35,550 | * | 11,850 | 23,700 | * | ||||||||||||||||||
Gui Zhu
|
35,725 | * | 11,908 | 23,817 | * | ||||||||||||||||||
Xiu Chen
|
36,498 | * | 12,166 | 24,332 | * | ||||||||||||||||||
Yu Bin Yan
|
36,508 | * | 12,169 | 24,339 | * | ||||||||||||||||||
Zhi Gang Li
|
36,581 | * | 12,194 | 24,387 | * | ||||||||||||||||||
Yongqiang Yan
|
37,328 | * | 12,443 | 24,885 | * | ||||||||||||||||||
Fei Liu
|
38,236 | * | 12,745 | 25,491 | * | ||||||||||||||||||
Mu Zhang
|
38,622 | * | 12,874 | 25,748 | * | ||||||||||||||||||
Bao Xin Shen
|
39,500 | * | 13,167 | 26,333 | * | ||||||||||||||||||
Bo Yu
|
39,500 | * | 13,167 | 26,333 | * | ||||||||||||||||||
Chongqin Dong
|
39,500 | * | 13,167 | 26,333 | * | ||||||||||||||||||
Dian Bao Lu
|
39,500 | * | 13,167 | 26,333 | * | ||||||||||||||||||
Hong Ting Ji
|
39,500 | * | 13,167 | 26,333 | * | ||||||||||||||||||
Hongbo Pan
|
39,500 | * | 13,167 | 26,333 | * | ||||||||||||||||||
Jicai Lang
|
39,500 | * | 13,167 | 26,333 | * | ||||||||||||||||||
Jilian Yuan
|
39,500 | * | 13,167 | 26,333 | * | ||||||||||||||||||
Jing Zhi Zhu
|
39,500 | * | 13,167 | 26,333 | * | ||||||||||||||||||
Jun Wang
|
39,500 | * | 13,167 | 26,333 | * | ||||||||||||||||||
Laogangyu
|
39,500 | * | 13,167 | 26,333 | * | ||||||||||||||||||
Lili Liu
|
39,500 | * | 13,167 | 26,333 | * | ||||||||||||||||||
Lu Bo Zhang
|
39,500 | * | 13,167 | 26,333 | * | ||||||||||||||||||
Mingqian Liu
|
39,500 | * | 13,167 | 26,333 | * | ||||||||||||||||||
Nanbin Liu
|
39,500 | * | 13,167 | 26,333 | * | ||||||||||||||||||
Qingguo Li
|
39,500 | * | 13,167 | 26,333 | * | ||||||||||||||||||
Rui Hou
|
39,500 | * | 13,167 | 26,333 | * | ||||||||||||||||||
Ruizhe Zhang
|
39,500 | * | 13,167 | 26,333 | * | ||||||||||||||||||
Shu Lan Gao
|
39,500 | * | 13,167 | 26,333 | * | ||||||||||||||||||
Shu Xia Ding
|
39,500 | * | 13,167 | 26,333 | * | ||||||||||||||||||
Shu Xian Pan
|
39,500 | * | 13,167 | 26,333 | * | ||||||||||||||||||
Shukui Wang
|
39,500 | * | 13,167 | 26,333 | * | ||||||||||||||||||
Wen Sheng Luo
|
39,500 | * | 13,167 | 26,333 | * | ||||||||||||||||||
Xian Zhi Sun
|
39,500 | * | 13,167 | 26,333 | * | ||||||||||||||||||
Xin Yu Zhao
|
39,500 | * | 13,167 | 26,333 | * | ||||||||||||||||||
Yi Fan Zhang
|
39,500 | * | 13,167 | 26,333 | * | ||||||||||||||||||
Yingjun Jiang
|
39,500 | * | 13,167 | 26,333 | * | ||||||||||||||||||
Yong Jia Lv
|
39,500 | * | 13,167 | 26,333 | * | ||||||||||||||||||
Zhao Hui Han
|
39,500 | * | 13,167 | 26,333 | * | ||||||||||||||||||
Zhigang Wang
|
39,500 | * | 13,167 | 26,333 | * | ||||||||||||||||||
Zhuang Nan Li
|
39,500 | * | 13,167 | 26,333 | * | ||||||||||||||||||
Liang Wen
Song |
39,588 | * | 13,196 | 26,392 | * | ||||||||||||||||||
Zi Feng Zhou
|
39,588 | * | 13,196 | 26,392 | * | ||||||||||||||||||
Song Lin Yi
|
39,974 | * | 13,325 | 26,649 | * | ||||||||||||||||||
Xin Ge
|
40,000 | * | 13,333 | 26,667 | * | ||||||||||||||||||
Xiuzhen Hu
|
40,000 | * | 13,333 | 26,667 | * | ||||||||||||||||||
Cheng Jun
Zhang |
40,843 | * | 13,614 | 27,229 | * | ||||||||||||||||||
Miao Yu
|
41,475 | * | 13,825 | 27,650 | * | ||||||||||||||||||
Xingchen Liu
|
43,449 | * | 14,483 | 28,966 | * | ||||||||||||||||||
Chun Bo Sun
|
43,450 | * | 14,483 | 28,967 | * | ||||||||||||||||||
99
| Shares Beneficially Owned Prior to the Offering (1) |
Shares Being Offered |
Shares Beneficially Owned After the Offering (1) |
|||||||||||||||||||||
|---|---|---|---|---|---|---|---|---|---|---|---|---|---|---|---|---|---|---|---|---|---|---|---|
| Name of Beneficial Owner |
Number |
Percentage (2) |
Number |
Percentage (2) | |||||||||||||||||||
Feng Wen Li
|
43,450 | * | 14,483 | 28,967 | * | ||||||||||||||||||
Shu Hua Wang
|
43,450 | * | 14,483 | 28,967 | * | ||||||||||||||||||
Tian Lei Wang
|
43,450 | * | 14,483 | 28,967 | * | ||||||||||||||||||
Wen Zhi Zhang
|
43,450 | * | 14,483 | 28,967 | * | ||||||||||||||||||
Xiao Hui Deng
|
43,450 | * | 14,483 | 28,967 | * | ||||||||||||||||||
Yanping Cui
|
43,450 | * | 14,483 | 28,967 | * | ||||||||||||||||||
Zhong Hai
Zhang |
43,450 | * | 14,483 | 28,967 | * | ||||||||||||||||||
Jia An Lv
|
44,103 | * | 14,701 | 29,402 | * | ||||||||||||||||||
Jing Zhang
|
44,148 | * | 14,716 | 29,432 | * | ||||||||||||||||||
Wenzhong Guo
|
45,000 | * | 15,000 | 30,000 | * | ||||||||||||||||||
Hongyan Liu
|
45,188 | * | 15,063 | 30,125 | * | ||||||||||||||||||
Xiao Ying Ma
|
47,400 | * | 15,800 | 31,600 | * | ||||||||||||||||||
Hongying Wang
|
47,795 | * | 15,932 | 31,863 | * | ||||||||||||||||||
Chun Feng Li
|
48,278 | * | 16,093 | 32,185 | * | ||||||||||||||||||
Yong Li Wang
|
48,278 | * | 16,093 | 32,185 | * | ||||||||||||||||||
Zhi Hai Jiang
|
48,644 | * | 16,215 | 32,429 | * | ||||||||||||||||||
Shu Zhen
Zhang |
49,217 | * | 16,406 | 32,811 | * | ||||||||||||||||||
Chengqing
Yang |
50,000 | * | 16,667 | 33,333 | * | ||||||||||||||||||
Donghui Zhao
|
50,000 | * | 16,667 | 33,333 | * | ||||||||||||||||||
Guijin Hou
|
50,000 | * | 16,667 | 33,333 | * | ||||||||||||||||||
Jianjun Zhao
|
50,000 | * | 16,667 | 33,333 | * | ||||||||||||||||||
Liyanyan
|
50,000 | * | 16,667 | 33,333 | * | ||||||||||||||||||
Min Zhou
|
50,000 | * | 16,667 | 33,333 | * | ||||||||||||||||||
Qiuli Liu
|
50,000 | * | 16,667 | 33,333 | * | ||||||||||||||||||
Rong Han
|
50,000 | * | 16,667 | 33,333 | * | ||||||||||||||||||
Tongchun Bi
|
50,000 | * | 16,667 | 33,333 | * | ||||||||||||||||||
Xiulan Cao
|
50,000 | * | 16,667 | 33,333 | * | ||||||||||||||||||
Yanling Li
|
50,000 | * | 16,667 | 33,333 | * | ||||||||||||||||||
Yanming Li
|
50,000 | * | 16,667 | 33,333 | * | ||||||||||||||||||
Yongping Wang
|
50,000 | * | 16,667 | 33,333 | * | ||||||||||||||||||
Yujie Dong
|
50,000 | * | 16,667 | 33,333 | * | ||||||||||||||||||
Jun Ying Bai
|
52,028 | * | 17,343 | 34,685 | * | ||||||||||||||||||
Li Wang
|
52,140 | * | 17,380 | 34,760 | * | ||||||||||||||||||
Li Juan Feng
|
52,266 | * | 17,422 | 34,844 | * | ||||||||||||||||||
Shi Yun Zheng
|
53,960 | * | 17,987 | 35,973 | * | ||||||||||||||||||
Jiu Hua Zhang
|
54,313 | * | 18,104 | 36,209 | * | ||||||||||||||||||
Yonghua Zhang
|
54,747 | * | 18,249 | 36,498 | * | ||||||||||||||||||
Feng Gang Qiu
|
55,300 | * | 18,433 | 36,867 | * | ||||||||||||||||||
Hongchang Liu
|
56,485 | * | 18,828 | 37,657 | * | ||||||||||||||||||
Yuangui Zhao
|
57,933 | * | 19,311 | 38,622 | * | ||||||||||||||||||
Fulin Wang
|
60,830 | * | 20,277 | 40,553 | * | ||||||||||||||||||
Zhenwen Zhou
|
61,535 | * | 20,512 | 41,023 | * | ||||||||||||||||||
Changhai Ning
|
62,213 | * | 20,738 | 41,475 | * | ||||||||||||||||||
Gui Fen Geng
|
62,252 | * | 20,751 | 41,501 | * | ||||||||||||||||||
Qi Li
|
62,568 | * | 20,856 | 41,712 | * | ||||||||||||||||||
Xinxue Zhong
|
63,200 | * | 21,067 | 42,133 | * | ||||||||||||||||||
Su Ping Wang
|
65,385 | * | 21,795 | 43,590 | * | ||||||||||||||||||
Jie Dong
|
68,730 | * | 22,910 | 45,820 | * | ||||||||||||||||||
Xingli Han
|
75,300 | * | 25,100 | 50,200 | * | ||||||||||||||||||
100
| Shares Beneficially Owned Prior to the Offering (1) |
Shares Being Offered |
Shares Beneficially Owned After the Offering (1) |
|||||||||||||||||||||
|---|---|---|---|---|---|---|---|---|---|---|---|---|---|---|---|---|---|---|---|---|---|---|---|
| Name of Beneficial Owner |
Number |
Percentage (2) |
Number |
Percentage (2) | |||||||||||||||||||
En Jiang He
|
77,824 | * | 25,941 | 51,883 | * | ||||||||||||||||||
Chun Liu Du
|
78,210 | * | 26,070 | 52,140 | * | ||||||||||||||||||
Kuo Lei
|
78,210 | * | 26,070 | 52,140 | * | ||||||||||||||||||
Daihong Gao
|
79,000 | * | 26,333 | 52,667 | * | ||||||||||||||||||
Hong Zao Zou
|
79,000 | * | 26,333 | 52,667 | * | ||||||||||||||||||
Hongmin Li
|
79,000 | * | 26,333 | 52,667 | * | ||||||||||||||||||
Jie Teng
|
79,000 | * | 26,333 | 52,667 | * | ||||||||||||||||||
Lijie Zhai
|
79,000 | * | 26,333 | 52,667 | * | ||||||||||||||||||
Xiaochun Yin
|
79,000 | * | 26,333 | 52,667 | * | ||||||||||||||||||
Zhi Ying Han
|
79,000 | * | 26,333 | 52,667 | * | ||||||||||||||||||
Zhimin Du
|
79,000 | * | 26,333 | 52,667 | * | ||||||||||||||||||
Liru Ma
|
82,950 | * | 27,650 | 55,300 | * | ||||||||||||||||||
Wenting Chen
|
83,333 | * | 27,778 | 55,555 | * | ||||||||||||||||||
Wenwei Qu
|
83,333 | * | 27,778 | 55,555 | * | ||||||||||||||||||
Li Mei Zhang
|
84,511 | * | 28,170 | 56,341 | * | ||||||||||||||||||
Huan Yang
|
85,162 | * | 28,387 | 56,775 | * | ||||||||||||||||||
Ping Hu
|
86,900 | * | 28,967 | 57,933 | * | ||||||||||||||||||
Shufan Yu
|
86,900 | * | 28,967 | 57,933 | * | ||||||||||||||||||
Gui Rong Song
|
88,397 | * | 29,466 | 58,931 | * | ||||||||||||||||||
Weifu Hao
|
90,000 | * | 30,000 | 60,000 | * | ||||||||||||||||||
Ming Zhu Bi
|
93,308 | * | 31,103 | 62,205 | * | ||||||||||||||||||
Shumin Ning
|
94,563 | * | 31,521 | 63,042 | * | ||||||||||||||||||
Liwei Xue
|
94,800 | * | 31,600 | 63,200 | * | ||||||||||||||||||
Cong Lin Yang
|
98,402 | * | 32,801 | 65,601 | * | ||||||||||||||||||
Guidong Tan
|
100,000 | * | 33,333 | 66,667 | * | ||||||||||||||||||
Jie Fu
|
100,000 | * | 33,333 | 66,667 | * | ||||||||||||||||||
Lance Jon
Kimmel |
100,000 | * | 33,333 | 66,667 | * | ||||||||||||||||||
Shuang Han
|
100,000 | * | 33,333 | 66,667 | * | ||||||||||||||||||
Ting Su
|
100,000 | * | 33,333 | 66,667 | * | ||||||||||||||||||
Xiaoqun Zhang
|
100,000 | * | 33,333 | 66,667 | * | ||||||||||||||||||
Yongzhong Liu
|
100,000 | * | 33,333 | 66,667 | * | ||||||||||||||||||
Zhong Xiao
Yang |
100,000 | * | 33,333 | 66,667 | * | ||||||||||||||||||
Wan Shan Sun
|
101,088 | * | 33,696 | 67,392 | * | ||||||||||||||||||
Liang Wang
|
102,700 | * | 34,233 | 68,467 | * | ||||||||||||||||||
Ziying Tong
|
102,700 | * | 34,233 | 68,467 | * | ||||||||||||||||||
Li Bin Zhai
|
105,320 | * | 35,107 | 70,213 | * | ||||||||||||||||||
Ju Wang
|
114,322 | * | 38,107 | 76,215 | * | ||||||||||||||||||
Han Ying Gao
|
114,893 | * | 38,298 | 76,595 | * | ||||||||||||||||||
Yan Xin Dong
|
115,255 | * | 38,418 | 76,837 | * | ||||||||||||||||||
Li Chen Liu
|
125,522 | * | 41,841 | 83,681 | * | ||||||||||||||||||
Deng Quan Li
|
130,350 | * | 43,450 | 86,900 | * | ||||||||||||||||||
Xianli Qu
|
135,248 | * | 45,083 | 90,165 | * | ||||||||||||||||||
Lan Wang
|
141,015 | * | 47,005 | 94,010 | * | ||||||||||||||||||
Yan Jiang
Zhang |
146,150 | * | 48,717 | 97,433 | * | ||||||||||||||||||
Yuanxin Liu
|
150,000 | * | 50,000 | 100,000 | * | ||||||||||||||||||
Yu Fan Lu
|
171,430 | * | 57,143 | 114,287 | * | ||||||||||||||||||
Jiyou Jiang
|
183,333 | * | 61,111 | 122,222 | * | ||||||||||||||||||
Xi Lin Li
|
183,455 | * | 61,152 | 122,303 | * | ||||||||||||||||||
Yonghai Yan
|
190,000 | * | 63,333 | 126,667 | * | ||||||||||||||||||
101
| Shares Beneficially Owned Prior to the Offering (1) |
Shares Being Offered |
Shares Beneficially Owned After the Offering (1) |
|||||||||||||||||||||
|---|---|---|---|---|---|---|---|---|---|---|---|---|---|---|---|---|---|---|---|---|---|---|---|
| Name of Beneficial Owner |
Number |
Percentage (2) |
Number |
Percentage (2) | |||||||||||||||||||
Jingfen Guo
|
197,500 | * | 65,833 | 131,667 | * | ||||||||||||||||||
Wei Jun Shan
|
198,421 | * | 66,140 | 132,281 | * | ||||||||||||||||||
Shu Min Liu
|
219,336 | * | 73,112 | 146,224 | * | ||||||||||||||||||
Guangwu Yue
|
222,543 | * | 74,181 | 148,362 | * | ||||||||||||||||||
Zhixiang Cao
|
237,000 | * | 79,000 | 158,000 | * | ||||||||||||||||||
Long Jin
|
252,800 | * | 84,267 | 168,533 | * | ||||||||||||||||||
Lianxue Han
|
270,385 | * | 90,128 | 180,257 | * | ||||||||||||||||||
Yu Lan Liu
|
328,930 | * | 109,643 | 219,287 | * | ||||||||||||||||||
Wei Shan
|
339,700 | * | 113,233 | 226,467 | * | ||||||||||||||||||
Gui Ling Yuan
|
395,000 | * | 131,667 | 263,333 | * | ||||||||||||||||||
Xing Ming
Han(3) |
426,600 | * | 71,100 | 355,500 | * | ||||||||||||||||||
Gui Ying Tong
|
470,000 | * | 156,667 | 313,333 | * | ||||||||||||||||||
Bai Ying
Zhang |
482,776 | * | 160,925 | 321,851 | * | ||||||||||||||||||
Wing Nin Lo
|
500,000 | 1.0 | % | 166,667 | 333,333 | * | |||||||||||||||||
Hanjia Zhao
|
608,300 | 1.2 | % | 202,767 | 405,533 | * | |||||||||||||||||
Bo Li
|
1,000,000 | 2.0 | % | 333,333 | 666,667 | 1.3 | % | ||||||||||||||||
Renchun Wang
|
1,000,000 | 2.0 | % | 333,333 | 666,667 | 1.3 | % | ||||||||||||||||
Yuan Li
|
1,000,000 | 2.0 | % | 333,333 | 666,667 | 1.3 | % | ||||||||||||||||
Yi Cheng Wang
|
1,966,137 | 3.9 | % | 655,379 | 1,310,758 | 2.6 | % | ||||||||||||||||
Guifang
Qi (4) |
4,977,474 | 9.5 | % | 829,579 | 4,147,895 | 7.9 | % | ||||||||||||||||
Zhi Guo
Wang (5) |
40,206,950 | 57.6 | % | 2,967,861 | 37,239,089 | 53.1 | % | ||||||||||||||||
TOTAL
|
72,805,512 | 100.0 | % | 16,500,000 | 56,305,512 | 77.3 | % | ||||||||||||||||
* |
Less than 1%. |
(1) |
Under applicable SEC rules, a person is deemed to beneficially own securities which the person has the right to acquire within 60 days through the exercise of any option or warrant or through the conversion of a convertible security. Also under applicable SEC rules, a person is deemed to be the “beneficial owner” of a security with regard to which the person directly or indirectly, has or shares (a) voting power, which includes the power to vote or direct the voting of the security, or (b) investment power, which includes the power to dispose, or direct the disposition, of the security, in each case, irrespective of the person’s economic interest in the security. Each listed selling security holder has the sole investment and voting power with respect to all shares shown as beneficially owned by such selling security holder, except as otherwise indicated in the footnotes to the table. |
(2) |
As of January 15, 2013, there were 72,805,512 shares of YBP common deemed outstanding, assuming exercise of all outstanding Founders’ Options, all of which are exercisable within 60 days. |
(3) |
Consists of (i) 213,300 shares of YBP stock held by Mr. Han; and (ii) 213,300 shares of YBP common stock which may be issued upon exercise of the Founder’s Option issued to Mr. Han, which option is exercisable within 60 days. |
(4) |
Consists of (i) 2,488,737 shares of YBP common stock held by Madame Qi; and (ii) 2,488,737 shares of YBP common stock which may be issued upon exercise of the Founder’s Option issued to Madame Qi, which option is exercisable within 60 days. |
(5) |
Consists of (i) 20,103,475 shares of YBP common stock held by Mr. Wang; and (ii) 20,103,475 shares of YBP common stock which may be issued upon exercise of the Founder’s Option issued to Mr. Wang, which option is exercisable within 60 days. |
102
Our common stock is not listed on a
public exchange. We plan to apply for a quotation of our common stock on the OTC Bulletin Board concurrently with the filing of this prospectus. In
order to be quoted on the OTC Bulletin Board, a market maker must file an application on our behalf in order to make a market for our common stock.
There can be no assurance that a market maker will agree to file the necessary documents with FINRA, which operates the OTC Bulletin Board, nor can
there be any assurance that such an application for quotation will be approved.
Prior to being quoted on the OTC
Bulletin Board, shareholders may sell their shares in private transactions to other individuals. The selling security holders will sell some or all of
their shares at a fixed price of $0.25 per share until our shares are quoted on the OTC Bulletin Board and thereafter at prevailing market prices or
privately negotiated prices. The offering price of $0.25 per share for the shares of common stock was determined based on the price of our common stock
of $0.10 during our most recently completed private offering. We arbitrarily added an additional $0.15 over the offering price of our common stock
during our most recently completed private offering to account for the potential increased value of our stock as a result of such shares having
increased liquidity and being registered with the SEC and unrestricted. Such increase in value is purely speculative and not based upon any rigorous
analysis. The offering price bears no relationship to the book value, assets or earnings of our company or any other recognized criteria of
value.
Once our common stock is quoted on OTC
Bulletin Board and a market has developed for our common stock, the shares may be sold or distributed from time to time by the selling stockholders,
who may be deemed to be underwriters, directly to one or more purchasers or through brokers or dealers who act solely as agents, at market prices
prevailing at the time of sale, at prices related to such prevailing market prices, at negotiated prices or at fixed prices, which may be changed. The
distribution of the shares may be effected in one or more of the following methods:
• |
ordinary brokers transactions, which may include long or short sales, |
• |
transactions involving cross or block trades on any securities or market where our common stock is trading, market where our common stock is trading, |
• |
through direct sales to purchasers or sales effected through agents, |
• |
through transactions in options, swaps or other derivatives (whether exchange listed of otherwise), or exchange listed or otherwise), or |
• |
any combination of the foregoing. |
In addition, the selling stockholders
may enter into hedging transactions with broker-dealers who may engage in short sales, if short sales were permitted, of shares in the course of
hedging the positions they assume with the selling stockholders. The selling stockholders may also enter into option or other transactions with
broker-dealers that require the delivery by such broker-dealers of the shares, which shares may be resold thereafter pursuant to this prospectus. To
our best knowledge, none of the selling security holders is a broker-dealer or the affiliate of a broker dealer.
We will advise the selling security
holders that the anti-manipulation rules of Regulation M under the Exchange Act may apply to sales of shares in the market and to the activities of the
selling security holders and their affiliates. In addition, we will make copies of this prospectus (as it may be supplemented or amended from time to
time) available to the selling security holders for the purpose of satisfying the prospectus delivery requirements of the Securities Act. The selling
security holders may indemnify any broker-dealer that participates in transactions involving the sale of the shares against certain liabilities,
including liabilities arising under the Securities Act.
Brokers, dealers, or agents
participating in the distribution of the shares may receive compensation in the form of discounts, concessions or commissions from the selling
stockholders and/or the purchasers of shares for whom such broker-dealers may act as agent or to whom they may sell as principal, or both (which
compensation as to a particular broker-dealer may be in excess of customary commissions). Neither the selling stockholders nor we can presently
estimate the amount of such compensation. We know of no existing
103
arrangements between the selling stockholders and any other stockholder, broker, dealer or agent relating to the sale or distribution of the shares. We will not receive any proceeds from the sale of the shares of the selling security holders pursuant to this prospectus. We have agreed to bear the expenses of the registration of the shares, including legal, accounting and transfer agent fees, and such expenses are estimated to be approximately $53,263 in the aggregate.
Notwithstanding anything set forth
herein, no FINRA member will charge commissions that exceed 8% of the total proceeds of the offering.
Zhiguo Wang and Guifang Qi may be
deemed to be statutory underwriters within the meaning of Section 2(a)(11) of the Securities Act. Mr. Wang is the Chief Executive Officer, President
and Chairman of the Board of Directors of the Company and Madame Qi is the Treasurer and a director of the Company. Mr. Wang and Madame Qi are husband
and wife. Neither Mr. Wang nor Madame Qi is a broker-dealer or the affiliate of a broker-dealer. Neither Mr. Wang nor Madame Qi has any obligation to
purchase any of the securities being registered on behalf of the selling shareholders named herein, nor will either of them receive any commission or
compensation in connection with the sale of the securities being registered on behalf of the selling shareholders named herein.
The validity of the common stock
offered by this prospectus will be passed upon for us by SEC Law Firm, Los Angeles, California. The principal of SEC Law Firm owns 100,000 shares of
YBP common stock, 33,333 shares of which are being registered and are covered by this prospectus.
The consolidated financial statements
of our company included in this prospectus and in the registration statement have been audited by Albert Wong & Co., independent registered public
accounting firm, to the extent and for the periods set forth in their report appearing elsewhere herein and in the registration statement, and are
included in reliance on such report, given the authority of said firm as an expert in auditing and accounting.
We filed with the SEC a registration
statement under the Securities Act for the securities in this offering. This prospectus does not contain all of the information in the registration
statement and the exhibits and schedule that were filed with the registration statement. For further information with respect to us and our securities,
we refer you to the registration statement and the exhibits and schedule that were filed with the registration statement. Statements contained in this
prospectus about the contents of any contract or any other document that is filed as an exhibit to the registration statement are not necessarily
complete, and we refer you to the full text of the contract or other document filed as an exhibit to the registration statement. A copy of the
registration statement and the exhibits and schedules that were filed with the registration statement may be inspected without charge at the Public
Reference Room maintained by the Securities and Exchange Commission at 100 F Street, N.E. Washington, DC 20549, and copies of all or any part of the
registration statement may be obtained from the Securities and Exchange Commission upon payment of the prescribed fee. Information regarding the
operation of the Public Reference Room may be obtained by calling the Securities and Exchange Commission at 1-800-SEC-0330. The Securities and Exchange
Commission maintains a website that contains reports, proxy and information statements, and other information regarding registrants that file
electronically with the SEC. The address of the website is www.sec.gov.
We file periodic reports under the
Exchange Act, including annual, quarterly and special reports, and other information with the Securities and Exchange Commission. These periodic
reports and other information are available for inspection and copying at the regional offices, public reference facilities and website of the
Securities and Exchange Commission referred to above.
104
For the Years Ended December 31, 2011 and 2010
CONTENTS
Audited
Consolidated Financial Statements for the Years Ended December 31, 2011 and 2010 |
||||||
| F-2 | ||||||
| F-3 | ||||||
| F-4 | ||||||
| F-5 | ||||||
| F-6 | ||||||
| F-7 to F-31 | ||||||
Unaudited
Consolidated Financial Statements For the Nine Months Ended September 30, 2012 and 2011 |
||||||
| F-32 | ||||||
| F-33 | ||||||
| F-34 | ||||||
| F-35 to F-53 |
F-1
ALBERT WONG & CO.
CERTIFIED PUBLIC ACCOUNTANTS
7th Floor, Nan Dao Commercial Building
359-361 Queen’s Road Central
Hong Kong
Tel : 2851 7954
Fax: 2545 4086
CERTIFIED PUBLIC ACCOUNTANTS
7th Floor, Nan Dao Commercial Building
359-361 Queen’s Road Central
Hong Kong
Tel : 2851 7954
Fax: 2545 4086
ALBERT WONG
B. Soc., Sc., ACA., LL.B., C.P.A.(Practicing)
B. Soc., Sc., ACA., LL.B., C.P.A.(Practicing)
Report of Independent Registered Public Accounting
Firm
The Board of Directors and Stockholders of
Yew Bio-Pharm Group, Inc.
Yew Bio-Pharm Group, Inc.
We have audited the accompanying consolidated balance sheets of
Yew Bio-Pharm Group, Inc. and Subsidiaries as of December 31, 2011 and 2010 and the related consolidated statements of income and comprehensive income,
stockholders’ equity and cash flows for the years then ended. These consolidated financial statements are the responsibility of the Company’s
management. Our responsibility is to express an opinion on these consolidated financial statements based on our audits.
We conducted our audits in accordance with the standards of the
Public Company Accounting Oversight Board (United States). Those standards require that we plan and perform the audit to obtain reasonable assurance
about whether the financial statements are free of material misstatement. The Company is not required to have, nor were we engaged to perform, an audit
of its internal control over financial reporting. Our audit included consideration of internal control over financial reporting as a basis for
designing audit procedures that are appropriate in the circumstances, but not for the purposes of expressing an opinion on the effectiveness of the
Company’s internal control over financial reporting. Accordingly, we express no such opinion. An audit includes examining on a test basis,
evidence supporting the amount and disclosures in the combined financial statements. An audit also includes assessing the accounting principles used
and significant estimates made by management, as well as evaluating the overall financial statement presentation. We believe that our audits provide a
reasonable basis for our opinion.
In our opinion, the consolidated financial statements referred to
above present fairly, in all material respects, the consolidated financial position of Yew Bio-Pharm Group, Inc. and Subsidiaries as of December 31,
2011 and 2010 and the results of their operations and their cash flows for the years then ended in conformity with accounting principles generally
accepted in the United States of America.
/s/
Albert Wong & Co. |
||||||
Hong Kong,
China |
Albert Wong & Co. |
|||||
April 16, 2012,
except for Notes 2, 3 and 16 which are dated September 10, 2012 |
Certified Public Accountants |
|||||
F-2
YEW BIO-PHARM GROUP, INC. AND
SUBSIDIARIES
CONSOLIDATED BALANCE SHEETS
AS OF DECEMBER 31, 2011 AND 2010
CONSOLIDATED BALANCE SHEETS
AS OF DECEMBER 31, 2011 AND 2010
| December 31, |
|||||||||||
|---|---|---|---|---|---|---|---|---|---|---|---|
| 2011 |
2010 |
||||||||||
| (As Restated) | (As Restated) | ||||||||||
ASSETS |
|||||||||||
CURRENT
ASSETS: |
|||||||||||
Cash
|
$ | 732,371 | $ | 1,850,488 | |||||||
Due from
related parties |
— | 57,131 | |||||||||
Inventories
|
710,844 | 972,048 | |||||||||
Prepaid
expenses and other assets |
433 | 2,250 | |||||||||
Total Current
Assets |
1,443,648 | 2,881,917 | |||||||||
LONG-TERM
ASSETS: |
|||||||||||
Inventories,
net of current portion |
7,508,030 | 7,533,189 | |||||||||
Property and
Equipment, net |
784,222 | 771,237 | |||||||||
Land use
rights and yew forest assets, net |
15,166,197 | 9,485,786 | |||||||||
Total
Long-term Assets |
23,458,449 | 17,790,212 | |||||||||
Total Assets
|
$ | 24,902,097 | $ | 20,672,129 | |||||||
LIABILITIES
AND SHAREHOLDERS’ EQUITY |
|||||||||||
CURRENT
LIABILITIES: |
|||||||||||
Accounts
payable |
$ | 1,360,611 | $ | 1,810,092 | |||||||
Advances from
customers |
— | 322,151 | |||||||||
Accrued
expenses and other payables |
119,901 | 55,604 | |||||||||
Taxes payable
|
500 | 7,112 | |||||||||
Refundable
common stock subscription |
950,000 | 950,000 | |||||||||
Due to
related parties |
266,488 | 141,276 | |||||||||
Total Current
Liabilities |
2,697,500 | 3,286,235 | |||||||||
Total
Liabilities |
2,697,500 | 3,286,235 | |||||||||
COMMITMENTS
AND CONTINGENCIES |
|||||||||||
SHAREHOLDERS’ EQUITY: |
|||||||||||
Common Stock
($0.001 par value; 50,000,000 shares authorized; 40,500,000 shares issued and outstanding at December 31, 2011 and 2010, respectively)
|
40,500 | 40,500 | |||||||||
Additional
paid-in capital |
7,208,970 | 7,208,970 | |||||||||
Retained
earnings |
11,469,172 | 7,849,160 | |||||||||
Statutory
reserves |
1,686,087 | 1,265,788 | |||||||||
Accumulated
other comprehensive income — foreign currency translation adjustment |
1,799,868 | 1,021,476 | |||||||||
Total
Shareholders’ Equity |
22,204,597 | 17,385,894 | |||||||||
Total
Liabilities and Shareholders’ Equity |
$ | 24,902,097 | $ | 20,672,129 | |||||||
See notes to consolidated financial
statements
F-3
YEW BIO-PHARM GROUP, INC. AND
SUBSIDIARIES
CONSOLIDATED STATEMENTS OF INCOME AND COMPREHENSIVE INCOME
CONSOLIDATED STATEMENTS OF INCOME AND COMPREHENSIVE INCOME
| For the Years Ended December 31, |
|||||||||||
|---|---|---|---|---|---|---|---|---|---|---|---|
| 2011 |
2010 |
||||||||||
REVENUES: |
|||||||||||
Revenues
|
$ | 4,564,426 | $ | 3,789,181 | |||||||
Revenue
— related party |
1,396,613 | 1,338,871 | |||||||||
Total
Revenues |
5,961,039 | 5,128,052 | |||||||||
COST OF
REVENUES |
|||||||||||
Cost of
revenues |
741,508 | 1,178,382 | |||||||||
Cost of
revenues — related party |
384,457 | 459,681 | |||||||||
Total Cost of
Revenues |
1,125,965 | 1,638,063 | |||||||||
GROSS PROFIT
|
4,835,074 | 3,489,989 | |||||||||
OPERATING
EXPENSES: |
|||||||||||
Selling
|
54,593 | 30,417 | |||||||||
General and
administrative |
733,815 | 878,879 | |||||||||
Total
Operating Expenses |
788,408 | 909,296 | |||||||||
INCOME FROM
OPERATIONS |
4,046,666 | 2,580,693 | |||||||||
OTHER INCOME
(EXPENSES): |
|||||||||||
Interest
income |
2,643 | 3,588 | |||||||||
Interest
expense |
— | (921 | ) | ||||||||
Other income
(expense) |
(8,998 | ) | 2,600 | ||||||||
Total Other
Income (Expenses) |
(6,355 | ) | 5,267 | ||||||||
NET INCOME
|
$ | 4,040,311 | $ | 2,585,960 | |||||||
COMPREHENSIVE
INCOME: |
|||||||||||
OTHER
COMPREHENSIVE INCOME: |
|||||||||||
Unrealized
foreign currency translation gain |
778,392 | 463,826 | |||||||||
COMPREHENSIVE
INCOME |
$ | 4,818,703 | $ | 3,049,786 | |||||||
NET INCOME
PER COMMON SHARE: |
|||||||||||
Basic
|
$ | 0.10 | $ | 0.06 | |||||||
Diluted
|
$ | 0.08 | $ | 0.05 | |||||||
WEIGHTED
AVERAGE COMMON SHARES OUTSTANDING: |
|||||||||||
Basic
|
40,500,000 | 40,083,562 | |||||||||
Diluted
|
50,000,000 | 49,583,562 | |||||||||
See notes to consolidated financial
statements
F-4
YEW BIO-PHARM GROUP, INC. AND
SUBSIDIARIES
CONSOLIDATED STATEMENTS OF SHAREHOLDERS’ EQUITY
For the Years Ended December 31, 2011 and 2010
CONSOLIDATED STATEMENTS OF SHAREHOLDERS’ EQUITY
For the Years Ended December 31, 2011 and 2010
| Common Stock, Par Value $0.001 |
||||||||||||||||||||||||||||||
|---|---|---|---|---|---|---|---|---|---|---|---|---|---|---|---|---|---|---|---|---|---|---|---|---|---|---|---|---|---|---|
| Number of Shares |
Amount |
Additional paid-in Capital |
Retained Earnings |
Statutory Reserve |
Accumulated Other Comprehensive Income |
Total Shareholders’ Equity |
||||||||||||||||||||||||
Balance,
December 31, 2009 |
40,000,000 | $ | 40,000 | $ | 7,159,470 | $ | 5,547,838 | $ | 981,150 | $ | 557,650 | $ | 14,286,108 | |||||||||||||||||
Shares issue for
compensation at $0.10 per share |
500,000 | 500 | 49,500 | — | — | — | 50,000 | |||||||||||||||||||||||
Adjustment to
statutory reserve |
— | — | — | (284,638 | ) | 284,638 | — | — | ||||||||||||||||||||||
Net income for
the year |
— | — | — | 2,585,960 | — | — | 2,585,960 | |||||||||||||||||||||||
Foreign currency
translation adjustment |
— | — | — | — | — | 463,826 | 463,826 | |||||||||||||||||||||||
Balance,
December 31, 2010 |
40,500,000 | 40,500 | 7,208,970 | 7,849,160 | 1,265,788 | 1,021,476 | 17,385,894 | |||||||||||||||||||||||
Adjustment to
statutory reserve |
— | — | — | (420,299 | ) | 420,299 | — | — | ||||||||||||||||||||||
Net income for
the year |
— | — | — | 4,040,311 | — | — | 4,040,311 | |||||||||||||||||||||||
Foreign currency
translation adjustment |
— | — | — | — | — | 778,392 | 778,392 | |||||||||||||||||||||||
Balance,
December 31, 2011 |
40,500,000 | $ | 40,500 | $ | 7,208,970 | $ | 11,469,172 | $ | 1,686,087 | $ | 1,799,868 | $ | 22,204,597 | |||||||||||||||||
See notes to consolidated financial
statements
F-5
| For the Years Ended December 31, |
|||||||||||
|---|---|---|---|---|---|---|---|---|---|---|---|
| 2011 |
2010 |
||||||||||
CASH FLOWS
FROM OPERATING ACTIVITIES: |
|||||||||||
Net income
|
$ | 4,040,311 | $ | 2,585,960 | |||||||
Adjustments
to reconcile net income to net cash provided by operating activities: |
|||||||||||
Depreciation
|
178,178 | 157,790 | |||||||||
Amortization
of land use rights and yew forest assets |
292,739 | 47,772 | |||||||||
Loss on
disposal of fixed assets |
9,975 | 7,849 | |||||||||
Common stock
issued for compensation |
— | 50,000 | |||||||||
Changes in
operating assets and liabilities: |
|||||||||||
Accounts
receivable |
— | 2,353,974 | |||||||||
Accounts
receivable — related party |
— | 59,746 | |||||||||
Prepaid taxes
|
— | 13,398 | |||||||||
Inventories
|
606,202 | (222,171 | ) | ||||||||
Prepaid and
other current assets |
1,867 | 4,390 | |||||||||
Advances to
suppliers |
— | 633,435 | |||||||||
Accounts
payable |
(511,018 | ) | 1,736,923 | ||||||||
Accrued
expenses and other payable |
62,115 | 27,798 | |||||||||
Due to
related parties |
25,867 | — | |||||||||
Taxes payable
|
(6,781 | ) | 6,833 | ||||||||
Advances from
customers |
(329,033 | ) | 313,627 | ||||||||
NET CASH
PROVIDED BY OPERATING ACTIVITIES |
4,370,422 | 7,777,324 | |||||||||
CASH FLOWS
FROM INVESTING ACTIVITIES: |
|||||||||||
Proceeds from
disposal of property and equipment |
19,695 | 26,554 | |||||||||
Purchase of
property and equipment |
(191,821 | ) | (169,086 | ) | |||||||
Purchase of
land use rights and yew forest assets |
(5,515,590 | ) | (9,021,506 | ) | |||||||
NET CASH USED
IN INVESTING ACTIVITIES |
(5,687,716 | ) | (9,164,038 | ) | |||||||
CASH FLOWS
FROM FINANCING ACTIVITIES: |
|||||||||||
Proceeds from
refundable common stock subscription |
— | 950,000 | |||||||||
Proceeds from
related party advances |
88,119 | 434,112 | |||||||||
Payments of
directors advances |
— | (57,488 | ) | ||||||||
NET CASH
PROVIDED BY FINANCING ACTIVITIES |
88,119 | 1,326,624 | |||||||||
EFFECT OF
EXCHANGE RATE ON CASH |
111,058 | 27,489 | |||||||||
NET DECREASE
IN CASH |
(1,118,117 | ) | (32,601 | ) | |||||||
CASH —
beginning of year |
1,850,488 | 1,883,089 | |||||||||
CASH —
end of year |
$ | 732,371 | $ | 1,850,488 | |||||||
SUPPLEMENTAL
DISCLOSURE OF CASH FLOW INFORMATION: |
|||||||||||
Cash paid
for: |
|||||||||||
Interest
|
$ | — | $ | 921 | |||||||
Income taxes
|
$ | — | $ | — | |||||||
Non-cash
investing and financing activities |
|||||||||||
Property and
equipment reclassified to inventory |
$ | — | $ | 83,272 | |||||||
See notes to consolidated financial
statements
F-6
YEW BIO-PHARM GROUP, INC. AND SUBSIDIARIES
NOTES TO CONSOLIDATED FINANCIAL STATEMENTS
FOR THE YEARS ENDED DECEMBER 31, 2011 AND 2010
(Stated in US Dollars)
NOTES TO CONSOLIDATED FINANCIAL STATEMENTS
FOR THE YEARS ENDED DECEMBER 31, 2011 AND 2010
(Stated in US Dollars)
NOTE 1 — ORGANIZATION AND PRINCIPAL
ACTIVITIES
Yew Bio-Pharm Group, Inc. (individually “YBP” and
collectively, with its subsidiaries and affiliates, the “Company”), was incorporated under the law of the State of Nevada on November 13,
2007. At the time of its incorporation, YBP had no operations and no substantial assets.
On October 29, 2009, YBP established a wholly-owned subsidiary,
Heilongjiang Jinshangjing Bio-Technology Development Co., Limited (“JSJ”), a wholly-owned foreign enterprise (“WOFE”), incorporated
in the People’s Republic of China (“PRC”), as part of a restructure of the Company (the “First Restructure”).
Harbin Yew Science and Technology Development Co., Ltd.
(“HDS”), a limited liability company incorporated under the laws of the PRC on August 22, 1996. Until February 23, 2010, HDS was owned by
Zhiguo Wang (“Mr. Wang”) (62.81%), his wife Guifang Qi (“Ms. Qi”)(18.53%), Xingming Han (Mr. Han) (4.82%), a PRC individual named
Yingjun Jiang (“Mr. Jiang”) (3.22%) and Heilongjiang Hongdoushan Ecology Forest Co., Ltd, (“HEFS”) (10.62%) (Mr. Wang, Madame Qi,
Mr. Han, Mr. Jiang and HEFS are collectively referred to as the “Original Shareholders”). Mr. Wang is the President and a director of the
Company. Madame Qi is the wife of Mr. Wang and an officer and director of the Company. Mr. Han is an officer and director of the Company. HEFS is owned
primarily by Mr. Wang and Madame Qi.
Pursuant to the First Restructure, on February 23, 2010, the
Company, through JSJ, entered into an Equity Transfer Agreement (collectively, the “First Transfer Agreements”) with each of the Original
Shareholders. Pursuant to the First Transfer Agreements, the terms of which are substantially identical to each other, the Original Shareholders
transferred all of their respective ownership in HDS to JSJ for an aggregate RMB 45,000,000, which amount represents the amount of the then registered
capital of HDS. As a result of this transaction, HDS became a wholly-owned subsidiary of JSJ. At February 23, 2010, the Company did not have working
capital to pay the Original Shareholders this amount and, accordingly, the Company recorded this amount as a liability owed to the Original
Shareholders. JSJ and the Original Shareholders also entered into a Supplemental Agreement dated February 26, 2010 (the “First Supplemental
Agreement”) , pursuant to which JSJ had the right to put the shares of HDS back to the Original Shareholders for the original purchase price of an
aggregate RMB 45,000,000, in the event that the transaction did not close or PRC governmental approval was not received, within six months following
the execution of the First Transfer Agreements.
As of February 23, 2010, Mr. Wang, Madame Qi and Mr. Han
(collectively, the “HDS Shareholders”) owned approximately 41.5% of YBP’s common stock (the “Common Stock”) and no other
individual shareholder owned more than 2.5% of YBP’s Common Stock. Before, during and after the First Restructure, the HDS Shareholders served as
the sole directors and principal executive officers of the Company and are responsible for all decisions and operations of the Company and HDS and
control the assets of the Company and HDS.
On May 10, 2010, JSJ, Mr. Wang, Mr. Jiang and HEFS entered into a
Debtor’s and Creditors’ Rights Agreement (the “Creditors’ Agreement”), pursuant to which Mr. Jiang and HEFS assigned their
rights, including the right to be paid for the HDS shares transferred by them to JSJ, under their respective First Transfer Agreements, to Mr. Wang,
and Mr. Wang assumed the obligations of Mr. Jiang and HEFS under their respective First Transfer Agreements. Before, during and after the First
Restructure, the HDS Shareholders served as the sole directors and principal executive officers of the Company.
In October 2010, the Company determined, in consultation with its
professional advisors, that the First Restructure did not meet certain technical PRC legal requirements and that the Company would need to be further
reorganized (the “Second Restructure”). Accordingly, on October 28, 2010, JSJ and each of the HDS Shareholders entered into new Equity
Transfer Agreement (collectively, the “Second Transfer Agreements”), the terms of which are substantially identical to each other, pursuant
to which 100% of the common stock of HDS was transferred by JSJ back to the HDS Shareholders for aggregate consideration of RMB 45,000,000. Since the
consideration of RMB 45,000,000 due to the HDS Shareholders in the First Restructure had not yet
F-7
YEW BIO-PHARM GROUP, INC. AND SUBSIDIARIES
NOTES TO CONSOLIDATED FINANCIAL STATEMENTS
FOR THE YEARS ENDED DECEMBER 31, 2011 AND 2010
(Stated in US Dollars)
NOTES TO CONSOLIDATED FINANCIAL STATEMENTS
FOR THE YEARS ENDED DECEMBER 31, 2011 AND 2010
(Stated in US Dollars)
been paid, pursuant to a Supplemental Agreement to the Second Equity Transfer Agreements dated February 16, 2011, the aggregate RMB 45,000,000 amount payable by the HDS Shareholders to JSJ for the return of their HDS common stock in respect of the Second Restructure, was offset against JSJ’s liability to the HDS Shareholders in the same aggregate amount in respect of the First Transfer Agreements, which amount had not yet been paid by JSJ.
As discussed above, Mr. Jiang and HEFS had assigned to Mr. Wang
their respective rights and obligations vis-a-vis JSJ resulting from the First Restructure, pursuant to the First Supplemental Agreement and the
Creditors’ Agreement, since as of such time Mr. Jiang and HEFS had not yet been paid for the transfer of their interests in HDS to JSJ in the
First Restructure in the amount of 3.22% and 10.62% of HDS’s equity interest, respectively. Therefore, in the Second Restructure, pursuant to the
Second Transfer Agreements, JSJ transferred to Mr. Wang not only his previous shareholdings in HDS before the First Restructure (representing 62.81% of
HDS’s total equity), but also an additional 13.84% of the equity in HDS as a result of Mr. Wang’s being assigned Mr. Jiang’s 3.22%
equity interest in HDS and HEFS’s 10.62% equity interest in HDS.
After the foregoing transactions were completed, the HDS
Shareholders then owned 100% of the shares of HDS in the following percentages:
Mr. Wang
|
76.65 | % | ||||
Madame Qi
|
18.53 | % | ||||
Mr. Han
|
4.82 | % |
Pursuant to a new restructuring plan intended to ensure
compliance with the PRC rules and regulations (the “Second Restructure”), on November 5, 2010, JSJ entered into a series of contractual
arrangements (the “Contractual Arrangements”) with HDS and/or the HDS Shareholders as described below:
• |
Exclusive Business Cooperation Agreement. Pursuant to the Exclusive Business Cooperation Agreement between JSJ and HDS (the “Business Cooperation Agreement”), JSJ has the exclusive right to provide to HDS general business operation services, including advice and strategic planning, as well as consulting services related to technology, research and development, human resources, marketing and other services deemed necessary (collectively, the “Services”). Under the Business Cooperation Agreement, JSJ has exclusive and proprietary rights and interests in all rights, ownership, interests and intellectual properties arising out of or created during the performance of the Business Cooperation Agreement, including but not limited to copyrights, patents, patent applications, software and trade secrets. HDS shall pay to JSJ a monthly consulting service fee (the “Service Fee”) in Renminbi that is equal to 100% of the monthly net income of HDS. Upon the prior written consent by JSJ, the rate of Service Fee may be adjusted pursuant to the operational needs of HDS. Within 30 days after the end of each month, HDS shall (a) deliver to JSJ the management accounts and operating statistics of HDS for such month, including the net income of HDS during such month (the “Monthly Net Income”), and (b) pay 80% of such Monthly Net Income to JSJ (each such payment, a “Monthly Payment”). Within ninety (90) days after the end of each fiscal year, HDS shall (a) deliver to JSJ financial statements of HDS for such fiscal year, which shall be audited and certified by an independent certified public accountant approved by JSJ, and (b) pay an amount to JSJ equal to the shortfall, if any, of the aggregate net income of HDS for such fiscal year, as shown in such audited financial statements, as compared to the aggregate amount of the Monthly Payments paid by HDS to JSJ in such fiscal year. HDS also granted an irrevocable and exclusive option to JSJ to purchase any and all of the assets of HDS, to the extent permitted under PRC law, at the lowest price permitted by PRC law. Unless earlier terminated in accordance with the provisions of the Business Cooperation Agreement or other agreements separately executed between JSJ and HDS, the Business Cooperation Agreement is for a term of ten years and expires on November 5, 2020; however, the term of the Business Cooperation Agreement may be extended if confirmed in writing by JSJ prior to the expiration of the term thereof. The period of the extended term shall be determined exclusively by JSJ and HDS |
F-8
YEW BIO-PHARM GROUP, INC. AND SUBSIDIARIES
NOTES TO CONSOLIDATED FINANCIAL STATEMENTS
FOR THE YEARS ENDED DECEMBER 31, 2011 AND 2010
(Stated in US Dollars)
NOTES TO CONSOLIDATED FINANCIAL STATEMENTS
FOR THE YEARS ENDED DECEMBER 31, 2011 AND 2010
(Stated in US Dollars)
| shall accept such extended term unconditionally. Unless JSJ commits gross negligence, or a fraudulent act, against HDS, HDS shall not terminate the Business Cooperation Agreement prior to the expiration of the term, including any extended term. Notwithstanding the foregoing, JSJ shall have the right to terminate the Business Cooperation Agreement at any time upon giving 30 days’ prior written notice to HDS. |
• |
Exclusive Option Agreement. Under an Exclusive Option Agreement among JSJ, HDS and each HDS Shareholder (individually, an “Option Agreement”), the terms of which are substantively identical to each other, each HDS Shareholder has granted JSJ or its designee the irrevocable and exclusive right to purchase, to the extent permitted under PRC law, all or any part of the HDS Shareholder’s equity interests in HDS (the “Equity Interest Purchase Option”) for RMB 10. If an appraisal is required by PRC laws at the time when and if JSJ exercises the Equity Interest Purchase Option, the parties shall negotiate in good faith and, based upon the appraisal, make a necessary adjustment to the purchase price so that it complies with any and all then applicable PRC laws. Without the consent of JSJ, the HDS Shareholders shall not sell, transfer, mortgage or dispose of their respective shares of HDS stock. Additionally, without the prior consent of JSJ, the HDS Shareholders shall not in any manner supplement, change or amend the articles of association and bylaws of HDS, increase or decrease its registered capital, change the structure of its registered capital in any other manner, or engage in any transactions that could materially affect HDS’ assets, liabilities, rights or operations, including, without limitation, the incurrence or assumption of any indebtedness except incurred in the ordinary course of business, execute any major contract over RMB 500,000, sell or purchase any assets or rights, incur of any encumbrance on any of its assets or intellectual property rights in favor of a third party or transfer of any agreements relating to its business operation to any third party. The term of each Option Agreement is ten years commencing on November 5, 2020 and may be extended at the sole election of JSJ. |
• |
Equity Interest Pledge Agreement. In order to guarantee HDS’s performance of its obligations under the Business Cooperation Agreement, each HDS Shareholder, JSJ and HDS entered into an Equity Interest Pledge Agreement (individually, a “Pledge Agreement”), the terms of which are substantially similar to each other. Pursuant to the Pledge Agreement, each HDS Shareholder pledged all of his or her equity interest in HDS to JSJ. If HDS or the HDS Shareholders breach their respective contractual obligations and such breach is not remedied to the satisfaction of JSJ within 20 days after the giving of notice of breach, JSJ, as pledgee, will be entitled to exercise certain rights, including the right to foreclose upon and sell the pledged equity interests. During the term of the Pledge Agreement, the HDS Shareholder shall not transfer his or her equity interest in HDS or place or otherwise permit any other security interest of other encumbrance to be placed on such equity interest. Upon the full payment of the Service Fee under the Business Cooperation Agreement and upon the termination of HDS’s obligations thereunder, the Pledge Agreement shall be terminated. |
• |
Power of Attorney. Under the Power of Attorney executed by each HDS Shareholder (each, a “Power of Attorney”), the terms of which are substantially similar to each other, JSJ has been granted an exclusive, irrevocable power of attorney to take actions in the place and stead of the HDS Shareholders, to act on behalf of the HDS Shareholder as his or her exclusive agent and attorney with respect to all matters concerning the HDS Shareholder’s equity interests in HDS, including without limitation, the right to: 1) attend shareholders’ meetings of HDS; 2) exercise all the HDS Shareholders’ rights, including voting rights under PRC laws and HDS’s Articles of Association, including but not limited to the sale or transfer or pledge or disposition of the HDS Shareholder’s equity interests in HDS in whole or in part; and 3) designate and appoint on behalf of the HDS Shareholders the legal representative, executive director, supervisor, manager and other senior management of HDS. |
F-9
YEW BIO-PHARM GROUP, INC. AND SUBSIDIARIES
NOTES TO CONSOLIDATED FINANCIAL STATEMENTS
FOR THE YEARS ENDED DECEMBER 31, 2011 AND 2010
(Stated in US Dollars)
NOTES TO CONSOLIDATED FINANCIAL STATEMENTS
FOR THE YEARS ENDED DECEMBER 31, 2011 AND 2010
(Stated in US Dollars)
To the extent that the Contractual Arrangements are enforceable
under PRC law, as from time to time interpreted by relevant state agencies, they constitute the valid and binding obligations of each of the parties to
each such agreement.
On November 29, 2010, YBP established a wholly-owned subsidiary,
Yew Bio-Pharm Holdings Limited (“Yew Bio-Pharm (HK)”), a limited liability company incorporated under the laws of Hong Kong and on January
26, 2011, YBP transferred its ownership in JSJ to Yew Bio-Pharm (HK).
As a result of the Second Restructure and the Contractual
Arrangements described above, the Company believes that HDS is considered a Variable Interest Entity (“VIE”) under ASC 810
“Consolidation”, because the equity investors in HDS no longer have the characteristics of a controlling financial interest, and the Company,
through JSJ, is the primary beneficiary of HDS and controls HDS’s operations. Accordingly, HDS has been consolidated as a deemed subsidiary into
YBP as a reporting company under ASC 810. A detailed analysis is discussed below.
As required by ASC 810-10, the Company performs a qualitative
assessment to determine whether the Company is the primary beneficiary of HDS which is identified as a VIE of the Company. A quality assessment begins
with an understanding of the nature of the risks in the entity as well as the nature of the entity’s activities including terms of the contracts
entered into by the entity, ownership interests issued by the entity and the parties involved in the design of the entity. The Company’s
assessment on the involvement with HDS reveals that the Company has the absolute power to direct the most significant activities that impact the
economic performance of HDS. JSJ is obligated to absorb a majority of the risk of loss from HDS activities and entitles JSJ to receive a majority of
HDS’s expected residual returns. In addition, HDS’s shareholders have pledged their equity interest in HDS to JSJ, irrevocably granted JSJ an
exclusive option to purchase, to the extent permitted under PRC law, all or part of the equity interests in HDS and agreed to entrust all the rights to
exercise their voting power to the person(s) appointed by JSJ. Under the accounting guidance, the Company is deemed to be the primary beneficiary of
HDS and the results of HDS are consolidated in the Company’s consolidated financial statements for financial reporting purposes. Accordingly, as a
VIE, HDS’s sales are included in the Company’s total sales, its income from operations is consolidated with the Company’s and the
Company’s net income includes all of HDS’s net income. The Company does not have any non-controlling interest and, accordingly, did not
subtract any net income in calculating the net income attributable to the Company. Because of the Contractual Arrangements, YBP has a pecuniary
interest in HDS that requires consolidation of HDS’s financial statements with those of the Company.
Additionally, pursuant to ASC 805, as YBP and HDS are under the
common control of the HDS Shareholders, the Second Restructure was accounted for in a manner similar to a pooling of interests. As a result, the
Company’s historical amounts in the accompanying consolidated financial statements give retrospective effect to the Second Restructure, whereby
the assets and liabilities of the Company are reflected at the historical carrying values and their operations are presented as if they were
consolidated for all periods presented, with the results of the Company being consolidated from the date of the Second Transfer Agreement. The accounts
of HDS are consolidated in the accompanying financial statements.
As of December 31, 2011, the Company agreed to waive all
management fees to be payable by HDS and the Company expects to waive such management fees in the near future due to a need of working capital in HDS
to expand HDS’s operations.
The Company is principally engaged in 1) processing and selling
yew tree branches and leaves used in the manufacture of TCM; 2) growing and selling yew tree seedlings and mature trees, including potted miniature yew
trees; and 3) manufacturing and selling furniture and handicrafts made of yew tree timber. The Company is located in Harbin, Heilongjiang Province,
China.
F-10
YEW BIO-PHARM GROUP, INC. AND SUBSIDIARIES
NOTES TO CONSOLIDATED FINANCIAL STATEMENTS
FOR THE YEARS ENDED DECEMBER 31, 2011 AND 2010
(Stated in US Dollars)
NOTES TO CONSOLIDATED FINANCIAL STATEMENTS
FOR THE YEARS ENDED DECEMBER 31, 2011 AND 2010
(Stated in US Dollars)
YBP has no direct or indirect legal or equity ownership interest
in HDS. However, through the Contractual Arrangements, the shareholders of HDS have assigned all their rights as shareholders, including voting rights
and disposition rights of their equity interests in HDS to JSJ, our indirect, wholly-owned subsidiary. YBP is deemed to be the primary beneficiary of
HDS and the financial statements of HDS are consolidated in the Company’s consolidated financial statements. At December 31, 2011 and 2010, the
carrying amount and classification of the assets and liabilities in the Company’s balance sheets that relate to the Company’s variable
interest in the VIE is as follows:
| December 31, 2011 |
December 31, 2010 |
|||||||||
|---|---|---|---|---|---|---|---|---|---|---|
Assets |
||||||||||
Cash
|
$ | 479,494 | $ | 543,063 | ||||||
Inventories
|
8,218,874 | 8,505,237 | ||||||||
Prepaid
expenses and other assets |
283 | 2,100 | ||||||||
Property and
equipment, net |
750,779 | 752,334 | ||||||||
Land use
rights and yew forest assets, net |
15,166,197 | 9,485,786 | ||||||||
Total assets
of VIE |
$ | 24,615,627 | $ | 19,288,520 | ||||||
Accounts
payable |
$ | 1,360,611 | $ | 1,810,092 | ||||||
Advances from
customers |
— | 322,151 | ||||||||
Accrued
expenses and other payables |
73,727 | 44,134 | ||||||||
Taxes payable
|
1,049 | 7,112 | ||||||||
Due to VIE
holding companies |
2,164,107 | 1,075,225 | ||||||||
Due to
related parties |
240,159 | 145,360 | ||||||||
Total
liabilities of VIE |
$ | 3,839,653 | $ | 3,404,074 | ||||||
The assets and liabilities in the table above are held in HDS.
The creditors of HDS have legal recourse only to the assets of HDS and do not have such recourse to the Company. In addition, HDS’ assets are
generally restricted only to pay such liabilities. Thus, the Company’s maximum legal exposure to loss related to VIE is significantly less than
the carrying value of the HDS assets due to outstanding intercompany liabilities. Restricted net assets of the VIE shall mean that amount of our
proportionate share of net assets of HDS (after intercompany eliminations which as of end of the most recent fiscal year may not be transferred to the
parent company by the VIE in the form of loans, advances or cash dividends without the consent of a third party (e.g. lender, regulatory agency,
foreign government, etc.).
NOTE 2 — SUMMARY OF SIGNIFICANT ACCOUNTING
POLICIES
Principles of consolidation
The consolidated financial statements include the accounts of the
Company and its wholly-owned subsidiaries and variable interest entities. All significant inter-company accounts and transactions have been eliminated
in consolidation.
F-11
YEW BIO-PHARM GROUP, INC. AND SUBSIDIARIES
NOTES TO CONSOLIDATED FINANCIAL STATEMENTS
FOR THE YEARS ENDED DECEMBER 31, 2011 AND 2010
(Stated in US Dollars)
NOTES TO CONSOLIDATED FINANCIAL STATEMENTS
FOR THE YEARS ENDED DECEMBER 31, 2011 AND 2010
(Stated in US Dollars)
Details of the Company’s subsidiaries and variable interest
entities are as follows:
| Name |
Domicile and date of incorporation |
Registered capital |
Effective ownership |
Principal activities |
||||||||||||||
|---|---|---|---|---|---|---|---|---|---|---|---|---|---|---|---|---|---|---|
JSJ |
PRC October 29, 2009 |
USD
$100,000 |
100% |
Holding company |
||||||||||||||
Yew Bio-Pharm
(HK) |
Hong
Kong November 29, 2010 |
HK
$10,000 |
100% |
Holding company of JSJ |
||||||||||||||
HDS |
PRC August 22, 1996 |
RMB
45,000,000 |
Contractual arrangements |
Sales
of Yew tree components for use in pharmaceutical industry, sale of Yew tree seedlings and potted yew trees; and the manufacture of Yew tree wood
handicrafts |
||||||||||||||
Method of accounting
The Company maintains its general ledger and journals with the
accrual method accounting for financial reporting purposes. The consolidated financial statements and notes are representations of management.
Accounting policies adopted by the Company conform to generally accepted accounting principles in the United States of America and have been
consistently applied in the presentation of consolidated financial statements.
Use of estimates
The preparation of the financial statements in conformity with
generally accepted accounting principles in the United States of America requires management to make estimates and assumptions that affect the reported
amounts of assets and liabilities and disclosure of contingent assets and liabilities at the date of the financial statements and the reported amounts
of revenues and expenses during the reporting periods. Actual results could differ from these estimates. Significant estimates include the allowance
for obsolete inventory, the useful life of property and equipment and intangible assets, and assumptions used in assessing impairment of long-term
assets.
Fair value of financial instruments
The Company adopted the guidance of Accounting Standards
Codification (“ASC”) 820 for fair value measurements which clarifies the definition of fair value, prescribes methods for measuring fair
value, and establishes a fair value hierarchy to classify the inputs used in measuring fair value as follows:
• |
Level 1 — Inputs are unadjusted quoted prices in active markets for identical assets or liabilities available at the measurement date. |
• |
Level 2 — Inputs are unadjusted quoted prices for similar assets and liabilities in active markets, quoted prices for identical or similar assets and liabilities in markets that are not active, inputs other then quoted prices that are observable, and inputs derived from or corroborated by observable market data. |
• |
Level 3 — Inputs are unobservable inputs which reflect the reporting entity’s own assumptions on what assumptions the market participants would use in pricing the asset or liability based on the best available information. |
F-12
YEW BIO-PHARM GROUP, INC. AND SUBSIDIARIES
NOTES TO CONSOLIDATED FINANCIAL STATEMENTS
FOR THE YEARS ENDED DECEMBER 31, 2011 AND 2010
(Stated in US Dollars)
NOTES TO CONSOLIDATED FINANCIAL STATEMENTS
FOR THE YEARS ENDED DECEMBER 31, 2011 AND 2010
(Stated in US Dollars)
The carrying amounts reported in the balance sheets for cash, due
from related parties, inventories, prepaid expenses and other assets, accounts payable, advances from customers, accrued expenses and other payables,
taxes payable, refundable common stock subscription and due to related parties approximate their fair market value based on the short-term maturity of
these instruments. The Company did not have any non-financial assets or liabilities that are measured at fair value on a recurring basis as of December
31, 2011 and 2010.
ASC 825-10 “Financial Instruments”, allows
entities to voluntarily choose to measure certain financial assets and liabilities at fair value (fair value option). The fair value option may be
elected on an instrument-by-instrument basis and is irrevocable, unless a new election date occurs. If the fair value option is elected for an
instrument, unrealized gains and losses for that instrument should be reported in earnings at each subsequent reporting date. The Company did not elect
to apply the fair value option to any outstanding instruments.
Concentrations of credit risk
The Company’s operations are conducted in the PRC.
Accordingly, the Company’s business, financial condition and results of operations may be influenced by the political, economic and legal
environment in the PRC, and by the general state of the PRC economy. The Company’s operations in the PRC are subject to special considerations and
significant risks not typically associated with companies in North America and Western Europe. These include risks associated with, among others, the
political, economic and legal environment and foreign currency exchange. The Company’s results may be adversely affected by changes in the
political and social conditions in the PRC, and by changes in governmental policies with respect to laws and regulations, anti-inflationary measures,
currency conversion, remittances abroad, and rates and methods of taxation, among other things.
Financial instruments which potentially subject the Company to
concentrations of credit risk consist principally of cash. Substantially all of the Company’s cash is maintained with state-owned banks within the
PRC, and no deposits are covered by insurance. The Company has not experienced any losses in such accounts and believes it is not exposed to any risks
on its cash in bank accounts.
Cash
For purposes of the consolidated statements of cash flows, the
Company considers all highly liquid instruments purchased with a maturity of three months or less and money market accounts to be cash
equivalents.
Inventories
Inventories, consisting of raw materials, work in process, Yew
seedlings and finished goods related to the Company’s Yew products are stated at the lower of cost or market value utilizing the weighted average
method. Raw materials primarily include Yew wood used in the production of Yew products such as furniture, ornaments, and other products containing Yew
wood. Finished goods, consisting of Yew products include direct materials, direct labor and an appropriate proportion of overhead.
The Company estimates the amount of the excess inventories by
comparing inventory on hand with the estimated sales that can be sold within its normal operating cycle of one year. Any inventory in excess of the
Company’s current requirements based on historical and anticipated levels of sales is classified as long-term on its consolidated balance sheets.
The Company’s classification of long-term inventory requires it to estimate the portion of inventory that can be realized over the next 12
months.
To estimate the amount of slow-moving or obsolete inventories,
the Company analyzes movement of its products, monitor competing products and technologies and evaluate acceptance of its products. Periodically, the
Company will identify inventories that cannot be sold at all or can only be sold at deeply discounted
F-13
YEW BIO-PHARM GROUP, INC. AND SUBSIDIARIES
NOTES TO CONSOLIDATED FINANCIAL STATEMENTS
FOR THE YEARS ENDED DECEMBER 31, 2011 AND 2010
(Stated in US Dollars)
NOTES TO CONSOLIDATED FINANCIAL STATEMENTS
FOR THE YEARS ENDED DECEMBER 31, 2011 AND 2010
(Stated in US Dollars)
prices. An allowance will be established if estimated management determines that certain inventories may not be saleable. If inventory costs exceed expected market value due to obsolescence or quantities in excess of expected demand, the Company will record reserves for the difference between the carrying cost and the market value.
At December 31, 2011 and 2010, the Company did not provide any
inventory allowance and reserve.
In accordance with Accounting Standards Codification
(“ASC”) 905, “Agriculture”, our costs of growing Yew seedlings are accumulated until the time of harvest and are reported at the
lower of cost or market.
Property and equipment
Property and equipment are carried at cost and are depreciated on
a straight-line basis (after taking into account their respective estimated residual value) over the estimated useful lives of the assets. The cost of
repairs and maintenance is expensed as incurred; major replacements and improvements are capitalized. When assets are retired or disposed of, the cost
and accumulated depreciation are removed from the accounts, and any resulting gains or losses are included in income in the year of disposition. The
Company examines the possibility of decreases in the value of fixed assets when events or changes in circumstances reflect the fact that their recorded
value may not be recoverable.
The estimated useful lives are as follows:
Building
|
15 | years | ||||
Machinery and
equipment |
10 | years | ||||
Office equipment
|
3 | years | ||||
Leasehold
improvement |
5 | years | ||||
Motor vehicles
|
4 | years |
Land and yew forest use rights
All land in the PRC is owned by the PRC government and cannot be
sold to any individual or company. The Company has recorded the amounts paid to the PRC government to acquire long-term interests to utilize land and
yew forests as land and yew forest use rights. This type of arrangement is common for the use of land in the PRC. Yew trees on land containing yew tree
forests will be used to supply raw materials such as branches, leaves and fruit to the Company that will be used to manufacture the Company’s
products. The Company amortizes these land and yew forest use rights over the term of the respective land and yew forest use right, which ranges from
45 to 50 years. The lease agreements do not have any renewal option and the Company has no further obligations to the lessor. The Company records the
amortization of these land and forest use rights as part of its cost of revenues.
Impairment of long-lived assets
In accordance with ASC Topic 360, the Company reviews long-lived
assets for impairment whenever events or changes in circumstances indicate that the carrying amount of the assets may not be fully recoverable, or at
least annually. The Company recognizes an impairment loss when the sum of expected undiscounted future cash flows is less than the carrying amount of
the asset. The amount of impairment is measured as the difference between the asset’s estimated fair value and its book value. The Company did not
record any impairment charges for the years ended December 31, 2011 and 2010.
F-14
YEW BIO-PHARM GROUP, INC. AND SUBSIDIARIES
NOTES TO CONSOLIDATED FINANCIAL STATEMENTS
FOR THE YEARS ENDED DECEMBER 31, 2011 AND 2010
(Stated in US Dollars)
NOTES TO CONSOLIDATED FINANCIAL STATEMENTS
FOR THE YEARS ENDED DECEMBER 31, 2011 AND 2010
(Stated in US Dollars)
Revenue recognition
The Company generates its revenue from sales of yew seedling
products, sales of yew raw materials for medical application, and sales of yew craft products. Pursuant to the guidance of ASC Topic 605 and ASC Topic
360, the Company recognizes revenue when persuasive evidence of an arrangement exists, delivery has occurred or services have been rendered, the
purchase price is fixed or determinable and collectability is reasonably assured, and no significant obligations remain.
Advertising
Advertising is expensed as incurred and is included in selling
expenses on the accompanying consolidated statements of income. Advertising expenses amounted to $8,604 and $2,571 for the years ended December 31,
2011 and 2010, respectively.
Shipping costs
Shipping costs are included in selling expenses and amount to
$13,916 and $11,316 for the years ended December 31, 2011 and 2010, respectively.
Research and development
Research and development costs are expensed as incurred. The
costs primarily consist of salaries paid for the development and improvement of the Company’s products. Research and development costs of the
years ended December 31, 2011 and 2010 were $16,048 and $24,404, respectively, and are included in general and administrative
expenses.
Employee benefits
The Company’s operations and employees are all located in
the PRC. The Company makes mandatory contributions to the PRC government’s health, retirement benefit and unemployment funds in accordance with
the relevant Chinese social security laws. The costs of these payments are charged to income in the same period as the related salary costs and are not
material.
Income taxes
The Company is governed by the Income Tax Law of the
People’s Republic of China, Hong Kong and the United States. The Company accounts for income tax using the liability method prescribed by ASC 740,
“Income Taxes”. Under this method, deferred tax assets and liabilities are determined based on the difference between the financial
reporting and tax bases of assets and liabilities using enacted tax rates that will be in effect in the year in which the differences are expected to
reverse. The Company records a valuation allowance to offset deferred tax assets if based on the weight of available evidence, it is
more-likely-than-not that some portion, or all, of the deferred tax assets will not be realized. The effect on deferred taxes of a change in tax rates
is recognized as income or loss in the period that includes the enactment date.
The Company applied the provisions of ASC 740-10-50,
“Accounting for Uncertainty in Income Taxes”, which provides clarification related to the process associated with accounting for uncertain
tax positions recognized in our financial statements. Audit periods remain open for review until the statute of limitations has passed. The completion
of review or the expiration of the statute of limitations for a given audit period could result in an adjustment to the Company’s liability for
income taxes. Any such adjustment could be material to the Company’s results of operations for any given quarterly or annual period based, in
part, upon the results of operations for the given period. As of December 31, 2011 and 2010, the Company had no uncertain tax positions, and will
continue to evaluate for uncertain positions in the future.
F-15
YEW BIO-PHARM GROUP, INC. AND SUBSIDIARIES
NOTES TO CONSOLIDATED FINANCIAL STATEMENTS
FOR THE YEARS ENDED DECEMBER 31, 2011 AND 2010
(Stated in US Dollars)
NOTES TO CONSOLIDATED FINANCIAL STATEMENTS
FOR THE YEARS ENDED DECEMBER 31, 2011 AND 2010
(Stated in US Dollars)
Value added tax
The Company is subject to value added tax (“VAT”). The
applicable VAT rate is 13% for agricultural products and 17% for handicraft products sold in the PRC. The amount of VAT liability is determined by
applying the applicable tax rate to the amount of goods sold (output VAT) less VAT accrued on purchases made with the relevant supporting invoices
(input VAT). Sales and purchases are recorded net of VAT (the amount of VAT is excluded from revenues and costs) collected and paid as the Company acts
as an agent for the government.
Foreign currency translation
The accompanying consolidated financial statements are presented
in U.S. dollars (“USD”). The reporting currency of the Company is the USD. The functional currency of Yew Bio-Pharm (HK) is the Hong Kong
dollar, the functional currency of the Company’s VIEs and subsidiaries located in the PRC is the RMB. For the subsidiaries whose functional
currencies are the Hong Kong dollar or RMB, results of operations and cash flows are translated at average exchange rates during the period, assets and
liabilities are translated at the unified exchange rate at the end of the period, and equity is translated at historical exchange rates. As a result,
amounts relating to assets and liabilities reported on the statements of cash flows may not necessarily agree with the changes in the corresponding
balances on the balance sheets. Translation adjustments resulting from the process of translating the local currency financial statements into U.S.
dollars are included in determining comprehensive income. The foreign currency translation adjustment included in comprehensive income for the years
ended December 31, 2011 and 2010 amounted to $778,392 and $463,826, respectively.
All of the Company’s revenue transactions are transacted in
the functional currency. The Company does not enter any material transaction in foreign currencies and, accordingly, transaction gains or losses have
not had, and are not expected to have, a material effect on the results of operations of the Company.
The PRC government imposes significant exchange restrictions on
fund transfers out of the PRC that are not related to business operations. These restrictions have not had a material impact on the Company because it
has not engaged in any significant transactions that are subject to the restrictions.
The exchange rates used to translate amounts in RMB into USD for
the purposes of preparing the consolidated financial statements were as follows:
| 2011 |
2010 |
|||||||||
|---|---|---|---|---|---|---|---|---|---|---|
Exchange rate on
balance sheet dates |
||||||||||
USD : RMB
exchange rate |
6.3647 | 6.6118 | ||||||||
Average exchange
rate for the year |
||||||||||
USD : RMB
exchange rate |
6.47351 | 6.77875 | ||||||||
The RMB is not freely convertible into foreign currency and all
foreign exchange transactions must take place through authorized institutions. No representation is made that the RMB amounts could have been, or could
be, converted into USD at the rates used in translation. In addition, the current foreign exchange control policies applicable in PRC also restrict the
transfer of assets or dividends outside the PRC.
Net income per share of common stock
ASC 260 “Earnings per Share,” requires dual
presentation of basic and diluted earnings per share (“EPS”) with a reconciliation of the numerator and denominator of the basic EPS
computation to the numerator and denominator of the diluted EPS computation. Basic EPS excludes dilution. Diluted EPS reflects the potential dilution
that could occur if securities or other contracts to issue common stock were exercised or converted into common stock or resulted in the issuance of
common stock that then shared in the earnings of the entity.
F-16
YEW BIO-PHARM GROUP, INC. AND SUBSIDIARIES
NOTES TO CONSOLIDATED FINANCIAL STATEMENTS
FOR THE YEARS ENDED DECEMBER 31, 2011 AND 2010
(Stated in US Dollars)
NOTES TO CONSOLIDATED FINANCIAL STATEMENTS
FOR THE YEARS ENDED DECEMBER 31, 2011 AND 2010
(Stated in US Dollars)
Basic net income per share is computed by dividing net income
available to common shareholders by the weighted average number of shares of common stock outstanding during the period. Diluted income per share is
computed by dividing net income by the weighted average number of shares of common stock, common stock equivalents and potentially dilutive securities
outstanding during each period.
The following table presents a reconciliation of basic and
diluted net income per share:
| Years Ended December 31, |
|||||||||||
|---|---|---|---|---|---|---|---|---|---|---|---|
| 2011 |
2010 |
||||||||||
Net income
available to common stockholders for basic and diluted net income per share of common stock |
$ | 4,040,311 | $ | 2,585,960 | |||||||
Weighted average
common stock outstanding — basic |
40,500,000 | 40,083,562 | |||||||||
Effect of
dilutive securities: |
|||||||||||
Subscribed
common shares issuable and subject to recession |
9,500,000 | 9,500,000 | |||||||||
Weighted average
common stock outstanding — diluted |
50,000,000 | 49,583,562 | |||||||||
Net income per
common share — basic |
$ | 0.10 | $ | 0.06 | |||||||
Net income per
common share — diluted |
$ | 0.08 | $ | 0.05 | |||||||
Accumulated other comprehensive income
Comprehensive income is comprised of net income and all changes
to the statements of stockholders’ equity, except those due to investments by stockholders, changes in paid-in capital and distributions to
stockholders. For the Company, comprehensive income for the years ended December 31, 2011 and 2010 included net income and unrealized gains from
foreign currency translation adjustments.
Segment reporting
ASC Topic 280 requires use of the “management approach”
model for segment reporting. The management approach model is based on the way a company’s management organizes segments within the company for
making operating decisions and assessing performance. Reportable segments are based on products and services, geography, legal structure, management
structure, or any other manner in which management disaggregates a company. During the years ended December 31, 2011 and 2010, the Company operated in
three reportable business segments: (1) the yew tree segment- the cultivation and sale of yew seedlings, yew trees and potted yew trees, (2) the
traditional Chinese medicine (“TCM raw materials”) segment- the production and sale of raw materials used for medicinal application in the
pharmaceutical industry, and (3) the handicrafts segment — the manufacture and sale of furniture and handicrafts made of yew timber (See Note
12).
Related party transactions
A related party is generally defined as (i) any person that holds
10% or more of the Company’s securities including such person’s immediate families, (ii) the Company’s management, (iii) someone that
directly or indirectly controls, is controlled by or is under common control with the Company, or (iv) anyone who can significantly influence the
financial and operating decisions of the Company. A transaction is considered to be a related party transaction when there is a transfer of resources
or obligations between related parties.
F-17
YEW BIO-PHARM GROUP, INC. AND SUBSIDIARIES
NOTES TO CONSOLIDATED FINANCIAL STATEMENTS
FOR THE YEARS ENDED DECEMBER 31, 2011 AND 2010
(Stated in US Dollars)
NOTES TO CONSOLIDATED FINANCIAL STATEMENTS
FOR THE YEARS ENDED DECEMBER 31, 2011 AND 2010
(Stated in US Dollars)
Collaborative arrangement
On March 21, 2004, HDS entered into a Joint Venture Planting
Agreement with Wuchang City Forestry Bureau, (see Note 14), which is considered a collaborative arrangement under general accepted accounting
principles in the United States (“U.S. GAAP”). The purpose of this arrangement is to share some of the risks and rewards associated with this
Joint Venture Planting Agreement. The Company’s current share of profits is 80%. The Company accounts for this collaborative arrangement under ASC
808, “Collaborative Arrangements” and related topics and will record revenue gross as the prime contractor. ASC Topic 808-10-15
defines collaborative arrangements and requires collaborators to present the result of activities for which they act as the principal on a gross basis
and report any payments received from (made to) the other collaborators based on other applicable authoritative accounting literature, and in the
absence of other applicable authoritative literature, on a reasonable, rational and consistent accounting policy is to be elected. The Company adopted
the provisions of ASC 808-10-15. The adoption of this statement did not have an impact on the Company’s consolidated financial position, results
of operations or cash flows. For the years ended December 31, 2011 and 2010, the Company has not generated any revenues or activity from this
collaborative agreement.
Recent accounting pronouncements
In May 2011, the FASB issued ASU No. 2011-04, “Amendments to
Achieve Common Fair Value Measurement and Disclosure Requirements in U.S. GAAP and IFRSs”, which is not expected to have a material impact on the
consolidated financial statements upon adoption.
In September 2011, the FASB issued Accounting Standards Update
(“ASU”) No. 2011-08, Intangibles — Goodwill and Other (Topic 350). This Accounting Standards Update amends FASB ASC Topic 350. This
amendment specifies the change in method for determining the potential impairment of goodwill. It includes examples of circumstances and events that
the entity should consider in evaluating whether it is more likely than not that the fair value of a reporting unit is less than its carrying amount.
The amendments are effective for annual and interim goodwill impairment tests performed for fiscal years beginning after December 15, 2011. The
adoption does not have any material impact on the Company’s consolidated financial position and results of operations.
In December 2011, FASB issued Accounting Standard Update No.
2011-12, Deferral of the Effective Date for Amendments to the Presentation of Reclassifications of Items Out of Accumulated Other Comprehensive
Income (ASU 2011-12), which indefinitely defers certain provisions of ASU 2011-05 issued earlier in June 2011and will be further deliberated by the
FASB at a future date. The new ASU affects entities that report items of comprehensive income in any period presented. During the deferral period,
entities will still need to comply with the existing requirements in U.S. GAAP for the presentation of reclassification adjustments. Specifically, ASC
220 gives entities the option of (1) presenting reclassification adjustments out of accumulated other comprehensive income on the face of the statement
in which comprehensive income is presented or (2) disclosing reclassification adjustments in the footnotes to the financial statements. ASU 2011-12 and
ASU 2011-05 share the same effective date. This guidance is effective for our interim and annual periods beginning after December 15, 2011. Management
believes the adoption of this new guidance will not have a material impact on the Company’s consolidated financial statements, as it only requires
a change in the format of presentation.
Other accounting standards that have been issued or proposed by
FASB that do not require adoption until a future date are not expected to have a material impact on the consolidated financial statements upon
adoption.
F-18
YEW BIO-PHARM GROUP, INC. AND SUBSIDIARIES
NOTES TO CONSOLIDATED FINANCIAL STATEMENTS
FOR THE YEARS ENDED DECEMBER 31, 2011 AND 2010
(Stated in US Dollars)
NOTES TO CONSOLIDATED FINANCIAL STATEMENTS
FOR THE YEARS ENDED DECEMBER 31, 2011 AND 2010
(Stated in US Dollars)
NOTE 3 — INVENTORIES
Inventories consisted of the following as of December 31, 2011
and 2010:
| December 31, 2011 |
December 31, 2010 |
||||||||||||||||||||||||||
|---|---|---|---|---|---|---|---|---|---|---|---|---|---|---|---|---|---|---|---|---|---|---|---|---|---|---|---|
| Current portion |
Long-term portion |
Total |
Current portion |
Long-term portion |
Total |
||||||||||||||||||||||
Raw Materials
|
$ | 29,401 | $ | 2,817,980 | $ | 2,847,381 | $ | 9,160 | $ | 2,712,665 | $ | 2,721,825 | |||||||||||||||
Work in
process |
18,642 | — | 18,642 | 177,854 | — | 177,854 | |||||||||||||||||||||
Finished
goods — handicrafts |
236,854 | 687,258 | 924,112 | 207,207 | 735,980 | 943,187 | |||||||||||||||||||||
Yew seedlings
|
425,947 | 4,002,792 | 4,428,739 | 577,827 | 4,084,544 | 4,662,371 | |||||||||||||||||||||
| $ | 710,844 | $ | 7,508,030 | $ | 8,218,874 | $ | 972,048 | $ | 7,533,189 | $ | 8,505,237 | ||||||||||||||||
NOTE 4 — PROPERTY AND
EQUIPMENT
Property and equipment consisted of the following as of December
31, 2011 and 2010:
| December 31, |
|||||||||||
|---|---|---|---|---|---|---|---|---|---|---|---|
| 2011 |
2010 |
||||||||||
Buildings and
building improvements |
$ | 267,015 | $ | 200,806 | |||||||
Machinery and
equipment |
520,416 | 500,845 | |||||||||
Office equipment
|
44,841 | 15,433 | |||||||||
Leasehold
improvement |
52,763 | 50,791 | |||||||||
Motor vehicles
|
513,280 | 425,975 | |||||||||
| 1,398,315 | 1,193,850 | ||||||||||
Less:
accumulated depreciation |
(614,093 | ) | (422,613 | ) | |||||||
| $ | 784,222 | $ | 771,237 | ||||||||
For the years ended December 31, 2011 and 2010, depreciation
expenses amounted to $178,178 and $157,790, respectively.
NOTE 5 — LAND AND YEW FOREST USE
RIGHTS
There is no private ownership of land in PRC. Land is owned by
the government and the government grants land use rights for specified terms. The following summarizes land use rights acquired by the
Company.
Yew trees on land containing yew tree forests will be used to
supply raw materials such as branches, leaves and fruit to the Company that will be used to for production of the Company’s products. The Company
amortizes these land and yew forest use rights over the term of the respective land use right. The lease agreements do not have any renewal option and
the Company has no further obligations to the lessor. The Company records the amortization of these land and yew forest use rights as part of its cost
of goods sold. For the years ended December 31, 2011 and 2010, amortization expense amounted to $292,739 and $47,772, respectively. As of December 31,
2011, the Company had approximately $1,300,000 unpaid amount related to the Land Use Right and Seedling Transfer Agreement and the amount was recorded
in the Company’s accounts payable on the accompanying balance sheet at December 31, 2011. As of December 31, 2011, land and yew forest use rights
consisted of the following:
F-19
YEW BIO-PHARM GROUP, INC. AND SUBSIDIARIES
NOTES TO CONSOLIDATED FINANCIAL STATEMENTS
FOR THE YEARS ENDED DECEMBER 31, 2011 AND 2010
(Stated in US Dollars)
NOTES TO CONSOLIDATED FINANCIAL STATEMENTS
FOR THE YEARS ENDED DECEMBER 31, 2011 AND 2010
(Stated in US Dollars)
| Description |
Useful life |
Acquisition date |
Expiration date |
Metric Acres (“Mu”) |
||||||||||||||||||
|---|---|---|---|---|---|---|---|---|---|---|---|---|---|---|---|---|---|---|---|---|---|---|
Parcel
A |
Undeveloped forest land |
50 |
3/2004 |
3/2054 |
125 |
|||||||||||||||||
Parcel
B |
Undeveloped forest land |
50 |
4/2004 |
4/2054 |
400 |
|||||||||||||||||
Parcel
C |
Yew
tree forests and underlying land |
50 |
1/2008 |
1/2058 |
290 |
|||||||||||||||||
Parcel
D |
Yew
tree forests and underlying land |
45 |
3/2010 |
3/2055 |
15,865 |
|||||||||||||||||
At December 31, 2011 and 2010, land and yew forest use rights
consisted of the following:
| Useful Life |
December 31, 2011 |
December 31, 2010 |
||||||||||||
|---|---|---|---|---|---|---|---|---|---|---|---|---|---|---|
Land
and yew forest use rights |
45–50 years | $ | 15,546,414 | $ | 9,565,177 | |||||||||
Less:
accumulated amortization |
(380,217 | ) | (79,391 | ) | ||||||||||
Total
|
$ | 15,166,197 | $ | 9,485,786 | ||||||||||
Amortization of land and yew forest use rights attributable to
future periods is as follows:
| Amount |
||||||
|---|---|---|---|---|---|---|
Years
ending December 31: |
||||||
2012
|
$ | 342,484 | ||||
2013
|
342,484 | |||||
2014
|
342,484 | |||||
2015
|
342,484 | |||||
2016
|
342,484 | |||||
2017
and thereafter |
13,453,777 | |||||
Total
|
$ | 15,166,197 | ||||
NOTE 6 — ACCRUED EXPENSES AND OTHER
PAYABLES
At December 31, 2011 and 2010, accrued expenses and other
payables consisted of the following:
| December 31, |
|||||||||||
|---|---|---|---|---|---|---|---|---|---|---|---|
| 2011 |
2010 |
||||||||||
Accrued wage
|
$ | 16,844 | $ | 30,462 | |||||||
Accrued
professional fees |
75,029 | — | |||||||||
Other
|
28,028 | 25,142 | |||||||||
Total
|
$ | 119,901 | $ | 55,604 | |||||||
NOTE 7 — TAXES
(a) Federal Income Tax and Enterprise Income Taxes
(“EIT”)
The Company is registered in the State of Nevada and is subject
to the United States federal income tax at a tax rate of 34%. No provision for income taxes in the U.S. has been made as the Company had no U.S.
taxable income as of December 31, 2011 and 2010.
The Company’s subsidiary and VIE, JSJ and HDS, respectively,
being incorporated in the PRC, are subject to PRC’s Enterprise Income Tax. Pursuant to the PRC Income Tax Laws, Enterprise Income Taxes
(“EIT”) is generally imposed at 25%. However, JSJ and HDS has been named as a leading enterprise in the agricultural area and awarded with a
tax exemption for the years up to December 31, 2058.
F-20
YEW BIO-PHARM GROUP, INC. AND SUBSIDIARIES
NOTES TO CONSOLIDATED FINANCIAL STATEMENTS
FOR THE YEARS ENDED DECEMBER 31, 2011 AND 2010
(Stated in US Dollars)
NOTES TO CONSOLIDATED FINANCIAL STATEMENTS
FOR THE YEARS ENDED DECEMBER 31, 2011 AND 2010
(Stated in US Dollars)
The table below summarizes the difference between the U.S.
Statutory federal tax rate and the Group’s effective tax rate for the years ended December 31, 2011 and 2010:
| Years ended December 31, |
|||||||||||
|---|---|---|---|---|---|---|---|---|---|---|---|
| 2011 |
2010 |
||||||||||
U.S. federal
income tax rate |
34 | % | 34 | % | |||||||
Foreign income
not recognized in the U.S. |
(34 | %) | (34 | %) | |||||||
PRC Enterprise
Income Tax |
25 | % | 25 | % | |||||||
Tax exemption
|
(25 | %) | (25 | %) | |||||||
Total provision
for income tax |
— | — | |||||||||
Income before income tax expenses of $4,193,516 and $2,787,319
for the years ended December 31, 2011 and 2010, respectively, was attributed to subsidiaries with operations in China. No income tax expense related to
China income incurred for the years ended December 31, 2011 and 2010.
The combined effects of the income tax expense exemptions and tax
reductions available to the Company for the years ended December 31, 2011 and 2010 are as follows:
| Years ended December 31, |
|||||||||||
|---|---|---|---|---|---|---|---|---|---|---|---|
| 2011 |
2010 |
||||||||||
Tax exemption
effect |
$ | 1,050,746 | $ | 711,593 | |||||||
Basic net income
per share effect |
$ | (0.03 | ) | $ | (0.02 | ) | |||||
Diluted net
income per share effect |
$ | (0.02 | ) | $ | (0.01 | ) | |||||
The Company has incurred United States net operating loss for
income tax purposes for the years ended December 31, 2011 and 2010. The net operating loss carry forwards for United States income tax purposes
amounted to $564,438 and $410,282 at December 31, 2011 and 2010, respectively, which may be available to reduce future years’ taxable income.
These carry forwards will expire, if not utilized, through 2031. Management believes that the realization of the benefits arising from this loss appear
to be uncertain due to Company’s limited operating history and continuing losses for United States income tax purposes. Accordingly, the Company
has provided a 100% valuation allowance at December 31, 2011 and 2010. For the years ended December 31, 2011 and 2010, the valuation allowance amounted
to $191,909 and $139,496, respectively, and management will review this valuation allowance periodically and make adjustments as
warranted.
For U.S. tax purposes, the Company has cumulative undistributed
earnings of foreign subsidiary and VIE of approximately $12.0 million and $8.3 million as of December 31, 2011 and 2010, respectively, which are
included in consolidated retained earnings and will continue to be indefinitely reinvested in international operations. Accordingly, no provision has
been made for U.S. deferred taxes related to future repatriation of these earnings, nor is it practicable to estimate the amount of income taxes that
would have to be provided if we concluded that such earnings will be remitted to the U.S. in the future.
There will be no deferred income tax assets or liabilities
calculation in the Federal Income Tax because the US corporation taxable loss and deferred taxable loss was the same and the use of any net operating
loss carry forwards appears to be uncertain, There will be no deferred income tax assets or liabilities calculation in the Enterprise Income Tax
because the Company awarded EIT exempted status under agricultural area.
The Company did not have any interest and penalty provided or
recognized in the income statements for the years ended December 31, 2011 and 2010 or balance sheet as of December 31, 2011 and 2010. The Company did
not have uncertainty tax positions or events leading to uncertainty tax position within the next 12 months. The Company’s 2009, 2010 and 2011 U.S.
Corporation Income Tax Return are subject to U.S. Internal
F-21
YEW BIO-PHARM GROUP, INC. AND SUBSIDIARIES
NOTES TO CONSOLIDATED FINANCIAL STATEMENTS
FOR THE YEARS ENDED DECEMBER 31, 2011 AND 2010
(Stated in US Dollars)
NOTES TO CONSOLIDATED FINANCIAL STATEMENTS
FOR THE YEARS ENDED DECEMBER 31, 2011 AND 2010
(Stated in US Dollars)
Revenue Service examination. The Company’s 2008, 2009, 2010 and 2011 China corporate income tax returns are subject to China State Administration of Taxation examination.
(b) Value Added Taxes
The applicable VAT tax rate is 13% for agricultural products and
17% for handicrafts sold in the PRC. In accordance with VAT regulations in the PRC, the Company is exempt from paying VAT on its yew seedling and trees
sales as an agricultural corps cultivating company up to December 31, 2016. VAT payable in the PRC is charged on an aggregated basis at the applicable
rate on the full price collected for the goods sold or taxable services provided and less any deductible VAT already paid by the taxpayer on purchases
of goods in the same financial year.
NOTE 8 — STOCKHOLDERS’
EQUITY
At December 31, 2011 and 2010, the Company reflected a $950,000
refundable common stock subscription liability related to 9,500,000 of the shares in the Summer 2009 Offering on the accompanying balance sheet. The
9,500,000 shares of YBP Common Stock were the subject of a rescission offering (the “Rescission Offering”) to the 62 subscribers in the
Summer 2009 Offering, all of whom are residents of the PRC. In the Rescission Offering, subscribers in the 2009 Summer Offering could either 1) confirm
their subscriptions of shares of YBP Common Stock or 2) elect to rescind their subscriptions of shares of YBP Common Stock and receive a refund of
their respective subscription amounts, together with interest. Pursuant to the Rescission Offering, which was conducted in March 2012, all the
subscribers in the 2009 Summer Offering confirmed their subscriptions for an aggregate 9,500,000 shares of YBP Common Stock.
Pursuant to an agreement dated November 1, 2010 between YBP and
the consultant, a resident of the U.S., YBP agreed to pay $20,000 cash and 500,000 Shares to the consultant as compensation for consulting services
rendered by him to the Company. The shares were valued at $0.10 per share or $50,000 in total and the Company recorded $50,000 of compensation expense
related to those Shares for the year ended December 31, 2010. The shares were recorded as outstanding as of December 31, 2011 and 2010 but not issued
until April 2012. In April 2012, the Company issued the 500,000 shares to the consultant.
NOTE 9 — CONCENTRATIONS OF CREDIT RISK AND MAJOR
CUSTOMERS
Customers
For the years ended December 31, 2011 and 2010, customers
accounting for 10% or more of the Company’s revenue were as follows:
| Years ended December 31, |
|||||||||||
|---|---|---|---|---|---|---|---|---|---|---|---|
| Customer |
2011 |
2010 |
|||||||||
A |
5 | % | 19 | % | |||||||
B |
23 | % | 26 | % | |||||||
C |
* | 13 | % | ||||||||
D |
10 | % | 10 | % | |||||||
E |
29 | % | * | ||||||||
F |
13 | % | * | ||||||||
* |
Below 1% |
We did not have any
accounts receivable amount at December 31, 2011 and 2010.
F-22
YEW BIO-PHARM GROUP, INC. AND SUBSIDIARIES
NOTES TO CONSOLIDATED FINANCIAL STATEMENTS
FOR THE YEARS ENDED DECEMBER 31, 2011 AND 2010
(Stated in US Dollars)
NOTES TO CONSOLIDATED FINANCIAL STATEMENTS
FOR THE YEARS ENDED DECEMBER 31, 2011 AND 2010
(Stated in US Dollars)
Suppliers
For the year ended December 31, 2011, a third party supplier
accounted 97% of its purchase and the Company had $1,313,982 accounts payable related to the supplier at December 31, 2011. For the year ended December
31, 2010, other than a related party supplier a related party company Heilongjiang Zishan Technology Co., Ltd. (see Note 10), the Company did not have
any suppliers accounted for more than 10% of its purchases.
NOTE 10 — RELATED PARTY
TRANSACTIONS
In addition to several of the Company’s officers and
directors, the Company conducted transactions with the following related parties:
| Company |
Ownership |
|||||
|---|---|---|---|---|---|---|
Heilongjiang
Zishan Technology Stock Co., Ltd. (“ZTC”) |
18%
owned by Heilongjiang Hongdoushan Ecology Forest Stock Co., Ltd., 39% owned by Zhiguo Wang, Chairman and Chief Executive Officer, 31% owned by Guifang
Qi, the wife of Mr. Wang and Director of the Company, and 12% owned by third parties |
|||||
Heilongjiang Yew
Pharmaceuticals, Co., Ltd. (“Yew Pharmaceutical”) |
95%
owned by Heilongjiang Hongdoushan Ecology Forest Stock Co., Ltd., and 5% owned by Madame Qi |
|||||
Shanghai Kairun
Bio-Pharmaceutical Co., Ltd. (“Kairun”) |
60%
owned by Heilongjiang Zishan Technology Co., Ltd., 20% owned by Heilongjiang Hongdoushan Ecology Forest Stock Co., Ltd., and 20% owned by Mr.
Wang |
|||||
Heilongjiang
Hongdoushan Ecology Forest Stock Co., Ltd. (“HEFS”) |
63%
owned by Mr. Wang, 34% owned by Madame Qi, and 3% owned by third parties |
|||||
Revenue from Related Parties
Pursuant to the Cooperation and Development Agreement discussed
below, the Company generated sales from its related party company, Yew Pharmaceutical. For the years ended December 31, 2011 and 2010, the Company
recorded revenues to this related party as follows:
| Name of Related Party |
Revenues |
||||||||||
|---|---|---|---|---|---|---|---|---|---|---|---|
| 2011 |
2010 |
||||||||||
Yew
Pharmaceutical |
$ | 1,396,613 | $ | 1,338,871 | |||||||
Total
|
$ | 1,396,613 | $ | 1,338,871 | |||||||
At December 31, 2011 and 2010, the Company did not have any
accounts receivable from Yew Pharmaceutical.
Cooperation and Development Agreement
On January 9, 2010, the Company entered into a Cooperation and
Development Agreement (the “Development Agreement”) with Yew Pharmaceutical. Pursuant to the Development Agreement, for a period of ten years
expiring on January 9, 2020, the Company shall supply cultivated yew raw materials to Yew Pharmaceutical that will be used by Yew Pharmaceutical to
make TCM and other pharmaceutical products, at price of RMB
F-23
YEW BIO-PHARM GROUP, INC. AND SUBSIDIARIES
NOTES TO CONSOLIDATED FINANCIAL STATEMENTS
FOR THE YEARS ENDED DECEMBER 31, 2011 AND 2010
(Stated in US Dollars)
NOTES TO CONSOLIDATED FINANCIAL STATEMENTS
FOR THE YEARS ENDED DECEMBER 31, 2011 AND 2010
(Stated in US Dollars)
1,000,000 (approximately $156,000) per metric ton. For the years ended December 31, 2011 and 2010, sales to Yew Pharmaceutical amounted to $1,396,613 and $1,338,871, respectively. At December 31, 2011 and 2010, the Company did not have any accounts receivable from Yew Pharmaceutical.
Purchases
For the years ended December 31, 2011 and 2010, the Company made
purchases in the amount of $3,398 and $1,792,035, respectively, of yew seedlings from ZTC. At December 31, 2011 and 2010, there was no accounts payable
amount due to ZTC related to the purchases.
Operating leases
On March 25, 2005, the Company entered into an Agreement for the
Lease of Seedling Land with ZTC (the “ZTC Lease”). Pursuant to the ZTC Lease, the Company leased 361 mu of land from ZTC for a period of 30
years, expiring on March 24, 2035. Annual payments under the ZTC Lease are RMB 162,450 (approximately $25,400). The payment for the first five years of
the ZTC Lease was due prior to December 31, 2010 and beginning in 2011, the Company is required to make full payment for the land use rights in advance
for each subsequent five-year period. For the years ended December 31, 2011 and 2010, rent expense related to the ZTC Lease amounted to $25,095 and
$23,965, respectively. At December 31, 2011 and 2010, amounts due under the ZTC lease amounted to $172,284 and $141,276, respectively, and are included
in due to related parties on the accompanying balance sheets.
On December 3, 2008, the Company entered into a lease for retail
space in Harbin with Madame Qi (the “Store Lease”). Pursuant to the Store Lease, no payment was due for the first year and an annual payment
of RMB 12,000 (approximately $1,875) is due for each of the second and third years thereof. The term of the Store Lease is three years and expired on
December 3, 2011. On November 15, 2011, the Company renewed the Store Lease. Pursuant to the renewed Store Lease, the annual rent is RMB 15,600
(approximately $2,359) and the annual payment is due by May 30 of each year. The term of the renewed Store Lease is 3 years and expires on December 1,
2014. For the years ended December 31, 2011 and 2010, rent expense related to the Store Lease amounted to $1,854 and $1,770,
respectively.
On January 1, 2010, the Company entered into a lease for office
space with Mr. Wang (the “Office Lease”). Pursuant to the Office Lease, annual payments of RMB 15,000 (approximately $2,400) are due for each
of the term. The term of the Office Lease is 15 years and expires on December 31, 2025. For the years ended December 31, 2011 and 2010, rent expense
related to the Office Lease amounted $2,317 and $2,213, respectively.
Future minimum rental payments required under the related party
operating leases are as follows:
| Years Ending December 31: |
||||||
|---|---|---|---|---|---|---|
2012
|
$ | 30,331 | ||||
2013
|
30,331 | |||||
2014
|
30,331 | |||||
2015
|
27,880 | |||||
2016
|
27,880 | |||||
Thereafter
|
487,018 | |||||
Total
|
$ | 633,771 |
F-24
YEW BIO-PHARM GROUP, INC. AND SUBSIDIARIES
NOTES TO CONSOLIDATED FINANCIAL STATEMENTS
FOR THE YEARS ENDED DECEMBER 31, 2011 AND 2010
(Stated in US Dollars)
NOTES TO CONSOLIDATED FINANCIAL STATEMENTS
FOR THE YEARS ENDED DECEMBER 31, 2011 AND 2010
(Stated in US Dollars)
Due to/due from related parties
The Company also received from and provided advances to its
officers and directors and related parties. These advances are unsecured and payable on demand.
The due to/due from related parties amount at December 31, 2011
and 2010 is as follows:
| Name of Related Party |
Due from related parties |
Due to related parties |
|||||||||||||||||
|---|---|---|---|---|---|---|---|---|---|---|---|---|---|---|---|---|---|---|---|
| 2011 |
2010 |
2011 |
2010 |
||||||||||||||||
Zhiguo
Wang |
$ | — | $ | 57,131 | $ | 31,357 | $ | — | |||||||||||
Yew
Pharmaceutical |
— | — | 62,847 | — | |||||||||||||||
ZTC
|
— | — | 172,284 | 141,276 | |||||||||||||||
Total
|
$ | — | $ | 57,131 | $ | 266,488 | $ | 141,276 | |||||||||||
Research and Development Agreement
The Company entered into a Technology Development Service
Agreement dated January 1, 2010 (the “Technology Agreement”) with Kairun. The term of the Technology Agreement was two years. Under the
Technology Agreement, Kairun provides the Company with testing and technologies regarding utilization of yew trees to extract taxol and develop higher
concentration of taxol in the yew trees the Company grow and cultivate. For these services, the Company agreed to pay Kairun RMB 200,000 after the
technologies developed by Kairun are tested and approved by the Company. The Company will retain all intellectual property rights in connection with
the technologies developed by Kairun. Kairun may not provide similar services to any other party without the Company’s prior written consent. As
of December 31, 2011, Kairun did not complete the service and no payment was made to Kairun. Accordingly, in February 2012, the Company entered into a
supplemental agreement with Kairun, extending the term of the Technology Agreement indefinitely until project results specified in the original
Technology Agreement have been achieved. Kairun is owned directly and indirectly primarily by Mr. Wang and Madame Qi.
NOTE 11 — STATUTORY RESERVES
The Company is required to make appropriations to reserve funds,
comprising the statutory surplus reserve and discretionary surplus reserve, based on after-tax net income determined in accordance with generally
accepted accounting principles of the PRC (“PRC GAAP”). Appropriation to the statutory surplus reserve is required to be at least 10% of the
after tax net income determined in accordance with PRC GAAP until the reserve is equal to 50% of the entities’ registered capital. Appropriations
to the discretionary surplus reserve are made at the discretion of the Board of Directors.
The statutory surplus reserve fund is non-distributable other
than during liquidation and can be used to fund previous years’ losses, if any, and may be utilized for business expansion or converted into share
capital by issuing new shares to existing shareholders in proportion to their shareholding or by increasing the par value of the shares currently held
by them, provided that the remaining reserve balance after such issue is not less than 25% of the registered capital. For the years ended December 31,
2011 and 2010, the Company appropriated to the statutory surplus reserve in the amount of $420,299 and $284,638, respectively. The accumulated balance
of the statutory reserve of the Company as of December 31, 2011 and 2010 was $1,686,087 and $1,265,788, respectively.
F-25
YEW BIO-PHARM GROUP, INC. AND SUBSIDIARIES
NOTES TO CONSOLIDATED FINANCIAL STATEMENTS
FOR THE YEARS ENDED DECEMBER 31, 2011 AND 2010
(Stated in US Dollars)
NOTES TO CONSOLIDATED FINANCIAL STATEMENTS
FOR THE YEARS ENDED DECEMBER 31, 2011 AND 2010
(Stated in US Dollars)
NOTE 12 — SEGMENT INFORMATION
For the years ended December 31, 2011 and 2010, the Company
operated in three reportable business segments — (1) the yew tree segment, (2) the TCM raw materials segment and (3) the handicrafts segment. The
Company’s reportable segments are strategic business units that offer different products. They are managed separately based on the fundamental
differences in their operations. All of the Company’s operations are conducted in the PRC.
Information with respect to these reportable business segments
for the years ended December 31, 2011 and 2010 is as follows:
| For the Year Ended December 31, |
|||||||||||
|---|---|---|---|---|---|---|---|---|---|---|---|
| 2011 |
2010 |
||||||||||
Revenues: |
|||||||||||
TCM raw
materials |
$ | 3,458,093 | $ | 2,845,067 | |||||||
Yew trees
|
2,400,245 | 2,131,445 | |||||||||
Handicrafts
|
102,701 | 151,540 | |||||||||
| 5,961,039 | 5,128,052 | ||||||||||
Cost of
revenues: |
|||||||||||
TCM raw
materials |
897,154 | 924,547 | |||||||||
Yew trees
|
172,460 | 633,027 | |||||||||
Handicrafts
|
56,351 | 80,489 | |||||||||
| 1,125,965 | 1,638,063 | ||||||||||
Depreciation and
amortization: |
|||||||||||
TCM raw
materials |
286,196 | 44,239 | |||||||||
Yew trees
|
30,185 | 48,648 | |||||||||
Handicrafts
|
31,852 | 32,013 | |||||||||
Other
|
122,684 | 80,662 | |||||||||
| 470,917 | 205,562 | ||||||||||
Net income
(loss): |
|||||||||||
TCM raw
materials |
2,560,939 | 1,920,520 | |||||||||
Yew trees
|
2,227,785 | 1,498,418 | |||||||||
Handicrafts
|
46,350 | 71,051 | |||||||||
Other
|
(794,763 | ) | (904,029 | ) | |||||||
| $ | 4,040,311 | $ | 2,585,960 | ||||||||
| December 31, 2010 |
|||||||||||||||||||||||
|---|---|---|---|---|---|---|---|---|---|---|---|---|---|---|---|---|---|---|---|---|---|---|---|
| TCM raw materials |
Yew trees |
Handicrafts |
Other |
Total |
|||||||||||||||||||
Identifiable
long-lived assets, net |
$ | 8,892,246 | $ | 593,397 | $ | 182,694 | $ | 588,686 | $ | 10,257,023 | |||||||||||||
Expenditures for
segment assets |
9,021,506 | 7,745 | 5,353 | 155,988 | 9,190,592 | ||||||||||||||||||
| December 31, 2011 |
|||||||||||||||||||||||
|---|---|---|---|---|---|---|---|---|---|---|---|---|---|---|---|---|---|---|---|---|---|---|---|
| TCM raw materials |
Yew trees |
Handicrafts |
Other |
Total |
|||||||||||||||||||
Identifiable
long-lived assets, net |
$ | 14,880,192 | $ | 600,364 | $ | 153,686 | $ | 316,177 | $ | 15,950,419 | |||||||||||||
Expenditures for
segment assets |
5,515,590 | 61,436 | — | 130,385 | 5,707,411 | ||||||||||||||||||
F-26
YEW BIO-PHARM GROUP, INC. AND SUBSIDIARIES
NOTES TO CONSOLIDATED FINANCIAL STATEMENTS
FOR THE YEARS ENDED DECEMBER 31, 2011 AND 2010
(Stated in US Dollars)
NOTES TO CONSOLIDATED FINANCIAL STATEMENTS
FOR THE YEARS ENDED DECEMBER 31, 2011 AND 2010
(Stated in US Dollars)
The Company does not allocate any selling, general and
administrative expenses to its reportable segments because these activities are managed at a corporate level and not allocable to any segment.
Accordingly, depreciation, interest expense or net income by segment is not reported. The Company’s operations are located in the PRC. All
revenues are derived from customers in the PRC. All of the Company’s operating assets are located in the PRC.
NOTE 13 — COMMITMENTS AND
CONTINGENCIES
Operating lease
On March 20, 2002, the Company leased office space in the
A’cheng district in Harbin (the “A’cheng Lease”). The A’cheng Lease is for a term of 23 years and expires on March 19, 2025.
Pursuant to the A’cheng Lease, lease payment shall be made as follows:
| Year |
Annual Lease Amount |
Payment Due Date |
||||||||
|---|---|---|---|---|---|---|---|---|---|---|
March
2002 to February 2012 |
RMB 25,000 |
Before December 2012 |
||||||||
March
2012 to February 2017 |
RMB 25,000 |
Before December 2017 |
||||||||
March
2017 to March 2025 |
RMB 25,000 |
Before December 2025 |
||||||||
For the years ended December 31, 2011 and 2010, rent expense
related to the A’cheng Lease amounted $3,862 and $3,688, respectively.
Future minimum rental payments required under the A’cheng
Lease are as follows:
| Years Ending December 31: |
||||||
|---|---|---|---|---|---|---|
2012
|
$ | 3,928 | ||||
2013
|
3,928 | |||||
2014
|
3,928 | |||||
2015
|
3,928 | |||||
2016
|
3,928 | |||||
Thereafter
|
32,405 | |||||
Total
|
$ | 52,045 |
See Note 10 for related party operating lease
commitments.
Seedling Purchase and Sale Long-Term Cooperation
Agreement
On November 25, 2010, HDS entered into a Seedling Purchase and
Sale Long-Term Cooperation Agreement (the “Seedling Agreement”) with Wuchang City Xinlin Forestry Co., Ltd (“Xinlin”), pursuant to
which HDS will sell yew seedlings to Xinlin at a price equal to 90% of HDS’s publicly-published wholesale prices. Xinlin has agreed to purchase
from the Company 10,000 yew seedlings annually. In 2011 and 2010, the Company made sales of $312,721 and $0, respectively, under the Seedling
Agreement.
Land Use Rights and Yew Forest Purchase
On March 4, 2010, the Company entered into Land Use Right and
Seedling Transfer Agreement with Heilongjiang Pingshan Yew Comprehensive Development Co., Ltd., pursuant to which the Company acquired land use rights
with an area of 15,865 mu and all yew trees and seedlings situated on such land, for an aggregate cost of RMB 80,152,900 (approximately $12,500,000).
The purchase price was divided into three installments, each installment representing a parcel of land. As of December 31, 2011, the Company made
payments aggregated RMB 72,008,600 (approximately $11,100,000) and had a payable in the amount of RMB
F-27
YEW BIO-PHARM GROUP, INC. AND SUBSIDIARIES
NOTES TO CONSOLIDATED FINANCIAL STATEMENTS
FOR THE YEARS ENDED DECEMBER 31, 2011 AND 2010
(Stated in US Dollars)
NOTES TO CONSOLIDATED FINANCIAL STATEMENTS
FOR THE YEARS ENDED DECEMBER 31, 2011 AND 2010
(Stated in US Dollars)
8,144,300 (approximately $1,300,000) related to the purchase. The payable in the amount of approximately $1,300,000 related to the land use right and seedling purchase was recorded in the Company’s accounts payable on the accompanying balance sheet at December 31, 2011. Subsequent to December 31, 2011 and through the date of this report, the Company made payments aggregated RMB 2,005,000 (approximately $300,000) and had an RMB 6,139,300 (approximately $1,000,000) unpaid amount related to the Land Use Right and Seedling Transfer Agreement.
NOTE 14 — JOINT VENTURE AGREEMENT FOR PLANTING OF YEW
TREES
On March 21, 2004, HDS entered into a Joint Venture Planting
Agreement (the “Joint Venture Agreement”) with Wuchang City Forestry Bureau (the “Forest Bureau”), pursuant to which the Forest
Bureau has given HDS access to 1,000,000 mu of forest land located in Wuchang City to develop yew tree forests and produce yew seedlings. Pursuant to
the Joint Venture Agreement, the Company is required to plant yew trees on this land from 2004 to 2034. Any profits from the planting of yew trees and
other agriculture shall be distributed 80% to the Company and 20% to the Forest Bureau. For the years ended December 31, 2011 and 2010, the Company has
not generated any revenues or activity on this land.
NOTE 15 — SUBSEQUENT EVENTS
The Company has evaluated all other subsequent events through
April 16, 2012, the date these consolidated financial statements were issued, and determined that there were no other subsequent events or transactions
that require recognition or disclosures in the financial statements except the following:
Rescission Offering
As December 31, 2011, 9,500,000 shares of YBP Common Stock
related to the Summer 2009 Offering were subject to a Rescission Offering to the 62 subscribers, all of whom are residents of the PRC. In the
Rescission Offering, subscribers in the 2009 Summer Offering would either 1) confirm their subscriptions of shares of YBP Common Stock or 2) elect to
rescind their subscriptions of shares of YBP Common Stock and receive a refund of their respective subscription amounts, together with interest.
Pursuant to the Rescission Offering, in which was conducted in March 2012, all the subscribers in the 2009 Summer Offering confirmed their
subscriptions for an aggregate 9,500,000 shares of YBP Common Stock.
Options
Generally, the founders of a corporation in the United States
receive shares of stock in consideration of the tangible and intangible assets contributed by them to the enterprise. Since the consideration for those
shares is the transfer of assets, including intellectual property, and business know-how, sometimes referred to as “sweat equity”, no payment
for such shares occurs.
However, unfamiliar with the usual way that founders acquire
equity interests in corporations in the United States, the HDS Shareholders actually purchased their HDS Shareholders’ Stock between March 2008
and September 2009, for cash, in a series of four different offerings of YBP Common Stock during that period, at prices ranging between $0.02 and $0.10
per share, for an aggregate purchase price of $890,501.
As a result of the Contractual Arrangements of the Second
Restructure, in which all of the profits of HDS will be paid under the terms of the Business Cooperation Agreement to JSJ, which is an indirect
wholly-owned subsidiary of YBP, combined with the actual purchase by the HDS Shareholders of the HDS Shareholders’ Stock for cash, it could be
viewed that Mr. Wang, Madame Qi and Mr. Han have, in effect, paid for their HDS Shareholders’ Stock twice.
F-28
YEW BIO-PHARM GROUP, INC. AND SUBSIDIARIES
NOTES TO CONSOLIDATED FINANCIAL STATEMENTS
FOR THE YEARS ENDED DECEMBER 31, 2011 AND 2010
(Stated in US Dollars)
NOTES TO CONSOLIDATED FINANCIAL STATEMENTS
FOR THE YEARS ENDED DECEMBER 31, 2011 AND 2010
(Stated in US Dollars)
Accordingly, it is the intention of the Company to rectify this
situation by issuing a stock purchase option (individually a “Founder’s Option” and collectively the “Founders’ Options”)
to each of Mr. Wang, Madame Qi and Mr. Han in an amount equal to the number of shares of YBP Common Stock that each of them currently owns. The terms
of each Founder’s Option will be identical to each other except for the name of the optionee and the number of shares of YBP Common Stock subject
to each such Founder’s Option. Those terms include:
• |
The issuance of the Founder’s Option may be subject to pre-issuance approval or post-issuance ratification by our shareholders as described below; |
• |
Each Founder’s Option is fully vested upon issuance; |
• |
Each Founder’s Option may be exercised only upon the approval by the YBP shareholders of an amendment to YBP’s Articles of Incorporation increasing the number of shares of authorized Common Stock and the filing of an amendment of the Articles of Incorporation with the Secretary of State of Nevada; |
• |
Each Founder’s Option is exercisable for a period of five years; |
• |
Each Founder’s Option has an exercise price of $0.10 per share, which is the same price per share in the most recently completed offering of YBP’s Common Stock; and |
• |
Each Founder’s Option has a cashless exercise feature, pursuant to which, at the optionee’s election, he or she may choose not to pay the exercise price of the Founder’s Option and receive instead a reduced number of shares of YBP Common Stock reflecting the value of the number of shares of YBP Common Stock equal to the aggregate exercise price of the Founder’s Option. |
The number of shares of YBP Common Stock subject to each
Founder’s Option is as follows:
| Name of Optionee |
Number of Shares Subject to Option |
|||||
|---|---|---|---|---|---|---|
Zhiguo
Wang |
20,103,475 | |||||
Guifang Qi |
2,488,737 | |||||
Xingming Han |
213,300 | |||||
The terms of the Founders’ Options have not been determined
as a result of arm’s-length negotiations. The Board of Directors of YBP, which consists of the same persons who are the HDS Shareholders and the
grantees of the Founder’s Option, may seek shareholder approval or ratification of the issuance of the Founders’ Options.
To the extent that the Founders’ Options are exercised,
assuming they are granted as described above, the number of shares to YBP Common Stock then held by each HDS Shareholder could as much double, which
would be highly dilutive to the other existing YBP shareholders. The following chart shows the maximum effect of this dilution assuming full exercise
of each Founder’s Option for cash:
Assuming the options are issued, the options will be valued on
the date of grant using the Black-Scholes option pricing model, using the expected and implied volatility from its peer companies’ volatilities as
the Company itself does not have historical trading history, expected dividends yield of 0%, expected term of five years and risk-free interest rate on
the date of grant. The value of the options granted will be immediately recognized as the Company’s compensation expenses upon issuance of the
options.
F-29
YEW BIO-PHARM GROUP, INC. AND SUBSIDIARIES
NOTES TO CONSOLIDATED FINANCIAL STATEMENTS
FOR THE YEARS ENDED DECEMBER 31, 2011 AND 2010
(Stated in US Dollars)
NOTES TO CONSOLIDATED FINANCIAL STATEMENTS
FOR THE YEARS ENDED DECEMBER 31, 2011 AND 2010
(Stated in US Dollars)
| Shareholder |
Number Shares Presently Held |
Percentage of Issued Shares Presently Held |
Number Shares Held Assuming Exercise of Founder’s Options |
Percentage of Issued Shares Following Exercise of Founder’s Options |
||||||||||||||
|---|---|---|---|---|---|---|---|---|---|---|---|---|---|---|---|---|---|---|
Zhiguo Wang
|
20,103,475 | 40.21 | % | 40,206,950 | 55.23 | % | ||||||||||||
Guifang Qi
|
2,488,737 | 4.98 | % | 4,977,474 | 6.84 | % | ||||||||||||
Xingming Han
|
213,300 | 0.43 | % | 426,600 | 0.58 | % | ||||||||||||
All HDS
Shareholders as a group (3 persons) |
22,805,512 | 45.61 | % | 45,611,024 | 62.65 | % | ||||||||||||
All other
existing shareholders |
27,194,488 | 54.39 | % | 27,194,488 | 37.35 | % | ||||||||||||
Total
|
50,000,000 | 100.00 | % | 72,805,512 | 100.00 | % | ||||||||||||
Research and Development
On February 2, 2012, the Company signed a supplementary agreement
to the Technology Agreement with Kairun to extend the contract period indefinitely until the results specified in the Technology Agreement have been
achieved.
NOTE 16 — RESTATEMENTS
The Company’s consolidated financial statements have been
restated for the years ended December 31, 2011 and 2010 to reflect the proper accounting treatment for slow-moving inventory and potential reserves for
slow-moving inventory. Based on analysis of inventory, the Company determined that a reclassification of certain inventory should be made from current
assets to long-term assets. The Company originally recorded all inventory in current assets. However, based on analysis of inventory movement and
analysis of its operating cycle of one year, it was subsequently determined that any inventory in excess of our current operating cycle of one year,
based on historical and anticipated levels of sales, should be classified as long-term on its consolidated balance sheets. The classification of
long-term inventory requires the Company to estimate the portion of inventory that can be realized over the next 12 months.
Accordingly, the Company restated its consolidated balance sheets
as of December 31, 2011 and 2010. The Company did not restate its consolidated statements of income and comprehensive income or consolidated statement
of cash flows for the years ended December 31, 2011 and 2010. The respective restatement adjustments are non-cash in nature. These adjustments resulted
in a decrease in our total current assets of $7,508,030 and $7,533,189 and an increase in long-term assets of $7,508,030 and $7,533,189 as of December
31, 2011 and 2010, respectively and summarized as follows:
| December 31, 2011 (As Previously Reported) |
Adjustments to Restate |
December 31, 2011 (As Restated) |
||||||||||||
|---|---|---|---|---|---|---|---|---|---|---|---|---|---|---|
Consolidated Balance Sheet: |
||||||||||||||
Assets: |
||||||||||||||
Current Assets: |
||||||||||||||
Inventories |
$ | 8,218,874 | $ | (7,508,030 | ) | $ | 710,844 | |||||||
Total
Current Assets |
8,951,678 | (7,508,030 | ) | 1,443,648 | ||||||||||
Long-term Assets: |
||||||||||||||
Inventories, net of current portion |
— | 7,508,030 | 7,508,030 | |||||||||||
Total
Assets |
$ | 24,902,097 | $ | — | $ | 24,902,097 | ||||||||
F-30
YEW BIO-PHARM GROUP, INC. AND SUBSIDIARIES
NOTES TO CONSOLIDATED FINANCIAL STATEMENTS
FOR THE YEARS ENDED DECEMBER 31, 2011 AND 2010
(Stated in US Dollars)
NOTES TO CONSOLIDATED FINANCIAL STATEMENTS
FOR THE YEARS ENDED DECEMBER 31, 2011 AND 2010
(Stated in US Dollars)
| December 31, 2010 (As Previously Reported) |
Adjustments to Restate |
December 31, 2010 (As Restated) |
||||||||||||
|---|---|---|---|---|---|---|---|---|---|---|---|---|---|---|
Consolidated Balance Sheet: |
||||||||||||||
Assets: |
||||||||||||||
Current Assets: |
||||||||||||||
Inventories |
$ | 8,505,237 | $ | (7,533,189 | ) | $ | 972,048 | |||||||
Total
Current Assets |
10,415,106 | (7,533,189 | ) | 2,881,917 | ||||||||||
Long-term Assets: |
||||||||||||||
Inventories, net of current portion |
— | 7,533,189 | 7,533,189 | |||||||||||
Total
Assets |
$ | 20,672,129 | $ | — | $ | 20,672,129 | ||||||||
F-31
| September 30, 2012 |
December 31, 2011 |
|||||||||
|---|---|---|---|---|---|---|---|---|---|---|
| (Unaudited) | (As Restated) | |||||||||
ASSETS |
||||||||||
CURRENT
ASSETS: |
||||||||||
Cash
|
$ | 567,798 | $ | 732,371 | ||||||
Accounts
receivable |
530,471 | — | ||||||||
Inventories
|
899,783 | 710,844 | ||||||||
Prepaid rent
— related party |
67,292 | — | ||||||||
Prepaid
expenses and other assets |
14,245 | 433 | ||||||||
Total Current
Assets |
2,079,589 | 1,443,648 | ||||||||
LONG-TERM
ASSETS: |
||||||||||
Inventories,
net of current portion |
9,703,596 | 7,508,030 | ||||||||
Property and
equipment, net |
838,002 | 784,222 | ||||||||
Land use
rights and yew forest assets, net |
15,034,720 | 15,166,197 | ||||||||
Total
long-term assets |
25,576,318 | 23,458,449 | ||||||||
Total Assets
|
$ | 27,655,907 | $ | 24,902,097 | ||||||
LIABILITIES
AND SHAREHOLDERS’ EQUITY |
||||||||||
CURRENT
LIABILITIES: |
||||||||||
Accounts
payable |
$ | 915,792 | $ | 1,360,611 | ||||||
Accrued
expenses and other payables |
49,939 | 119,901 | ||||||||
Taxes payable
|
11,303 | 500 | ||||||||
Refundable
common stock subscription |
— | 950,000 | ||||||||
Due to
related parties |
56,098 | 266,488 | ||||||||
Total Current
Liabilities |
1,033,132 | 2,697,500 | ||||||||
Total
Liabilities |
1,033,132 | 2,697,500 | ||||||||
COMMITMENTS
AND CONTINGENCIES |
||||||||||
SHAREHOLDERS’ EQUITY: |
||||||||||
Common stock
($0.001 par value; 50,000,000 shares authorized; 50,000,000 and 40,500,000 shares issued and outstanding at September 30, 2012 and December 31, 2011,
respectively) |
50,000 | 40,500 | ||||||||
Additional
paid-in capital |
8,149,470 | 7,208,970 | ||||||||
Retained
earnings |
14,465,223 | 11,469,172 | ||||||||
Statutory
reserves |
2,049,906 | 1,686,087 | ||||||||
Accumulated
other comprehensive income — foreign currency translation adjustment |
1,908,176 | 1,799,868 | ||||||||
Total
Shareholders’ Equity |
26,622,775 | 22,204,597 | ||||||||
Total
Liabilities and Shareholders’ Equity |
$ | 27,655,907 | $ | 24,902,097 | ||||||
See notes to unaudited consolidated financial
statements
F-32
YEW BIO-PHARM GROUP, INC. AND
SUBSIDIARIES
CONSOLIDATED STATEMENTS OF INCOME AND COMPREHENSIVE INCOME
(UNAUDITED)
CONSOLIDATED STATEMENTS OF INCOME AND COMPREHENSIVE INCOME
(UNAUDITED)
| For the Three Months Ended September 30, |
For the Nine Months Ended September 30, |
||||||||||||||||||
|---|---|---|---|---|---|---|---|---|---|---|---|---|---|---|---|---|---|---|---|
| 2012 |
2011 |
2012 |
2011 |
||||||||||||||||
REVENUES: |
|||||||||||||||||||
Revenues
|
$ | 930,557 | $ | 954,122 | $ | 4,230,631 | $ | 3,246,602 | |||||||||||
Revenues
— related party |
442,467 | 251,876 | 602,159 | 1,169,688 | |||||||||||||||
Total
Revenues |
1,373,024 | 1,205,998 | 4,832,790 | 4,416,290 | |||||||||||||||
COST OF
REVENUES: |
|||||||||||||||||||
Cost of
revenues |
146,409 | 220,121 | 726,957 | 691,588 | |||||||||||||||
Cost of
revenues — related party |
84,528 | 41,009 | 109,752 | 297,004 | |||||||||||||||
Total Cost of
Revenues |
230,937 | 261,130 | 836,709 | 988,592 | |||||||||||||||
GROSS PROFIT
|
1,142,087 | 944,868 | 3,996,081 | 3,427,698 | |||||||||||||||
OPERATING
EXPENSES: |
|||||||||||||||||||
Selling
|
6,643 | 8,455 | 17,880 | 42,640 | |||||||||||||||
General and
administrative |
256,013 | 221,654 | 619,786 | 533,595 | |||||||||||||||
Total
Operating Expenses |
262,656 | 230,109 | 637,666 | 576,235 | |||||||||||||||
INCOME FROM
OPERATIONS |
879,431 | 714,759 | 3,358,415 | 2,851,463 | |||||||||||||||
OTHER INCOME
(EXPENSES): |
|||||||||||||||||||
Interest
income |
474 | 263 | 2,062 | 1,712 | |||||||||||||||
Other
(expense) |
(246 | ) | (2,717 | ) | (607 | ) | (14,838 | ) | |||||||||||
Total Other
Income (Expenses) |
228 | (2,454 | ) | 1,455 | (13,126 | ) | |||||||||||||
NET INCOME
|
$ | 879,659 | $ | 712,305 | $ | 3,359,870 | $ | 2,838,337 | |||||||||||
COMPREHENSIVE
INCOME: |
|||||||||||||||||||
NET INCOME
|
$ | 879,659 | $ | 712,305 | $ | 3,359,870 | $ | 2,838,337 | |||||||||||
OTHER
COMPREHENSIVE INCOME: |
|||||||||||||||||||
Unrealized
foreign currency translation gain (loss) |
(59,359 | ) | 158,519 | 108,308 | 582,653 | ||||||||||||||
COMPREHENSIVE
INCOME |
$ | 820,300 | $ | 870,824 | $ | 3,468,178 | $ | 3,420,990 | |||||||||||
NET INCOME
PER COMMON SHARE: |
|||||||||||||||||||
Basic
|
$ | 0.02 | $ | 0.02 | $ | 0.07 | $ | 0.07 | |||||||||||
Diluted
|
$ | 0.02 | $ | 0.01 | $ | 0.07 | $ | 0.06 | |||||||||||
See notes to unaudited consolidated financial
statements
F-33
| For the Nine Months Ended September 30, |
|||||||||||
|---|---|---|---|---|---|---|---|---|---|---|---|
| 2012 |
2011 |
||||||||||
CASH FLOWS
FROM OPERATING ACTIVITIES: |
|||||||||||
Net income
|
$ | 3,359,870 | $ | 2,838,337 | |||||||
Adjustments
to reconcile net income to net cash provided by operating activities: |
|||||||||||
Depreciation
|
158,502 | 128,086 | |||||||||
Amortization
of land use rights and yew forest assets |
259,221 | 213,131 | |||||||||
Loss on
disposal of fixed assets |
— | 9,877 | |||||||||
Changes in
operating assets and liabilities: |
|||||||||||
Accounts
receivable |
(531,020 | ) | — | ||||||||
Inventories
|
(2,335,370 | ) | 859,356 | ||||||||
Prepaid and
other current assets |
(13,812 | ) | (5,043 | ) | |||||||
Prepaid rent
— related party |
(67,361 | ) | — | ||||||||
Accounts
payable |
(451,897 | ) | 501,672 | ||||||||
Accrued
expenses and other payables |
(66,648 | ) | 2,234 | ||||||||
Due to
related parties |
27,247 | — | |||||||||
Taxes payable
|
7,081 | (5,935 | ) | ||||||||
Advances from
customers |
— | (173,686 | ) | ||||||||
NET CASH
PROVIDED BY OPERATING ACTIVITIES |
345,813 | 4,368,029 | |||||||||
CASH FLOWS
FROM INVESTING ACTIVITIES: |
|||||||||||
Proceeds from
disposal of property and equipment |
— | 19,982 | |||||||||
Purchase of
property and equipment |
(208,524 | ) | (133,678 | ) | |||||||
Purchase of
land use rights and yew forest assets |
(65,749 | ) | (5,494,788 | ) | |||||||
NET CASH USED
IN INVESTING ACTIVITIES |
(274,273 | ) | (5,608,484 | ) | |||||||
CASH FLOWS
FROM FINANCING ACTIVITIES: |
|||||||||||
Repayments to
related party |
(239,043 | ) | — | ||||||||
Proceeds from
related party advances |
— | 137,480 | |||||||||
Proceeds from
directors advances |
— | 62,944 | |||||||||
NET CASH
(USED IN) PROVIDED BY FINANCING ACTIVITIES |
(239,043 | ) | 200,424 | ||||||||
EFFECT OF
EXCHANGE RATE ON CASH |
2,930 | (21,968 | ) | ||||||||
NET
(DECREASE) IN CASH |
(164,573 | ) | (1,061,999 | ) | |||||||
CASH —
beginning of period |
732,371 | 1,850,488 | |||||||||
CASH —
end of period |
$ | 567,798 | $ | 788,489 | |||||||
SUPPLEMENTAL
DISCLOSURE OF CASH FLOW INFORMATION: |
|||||||||||
Cash paid
for: |
|||||||||||
Interest
|
$ | — | $ | — | |||||||
Income taxes
|
$ | — | $ | — | |||||||
Non-cash
investing and financing activities |
|||||||||||
Common stock
issued for common stock refundable subscription |
$ | 950,000 | $ | — | |||||||
See notes to unaudited consolidated financial
statements
F-34
YEW BIO-PHARM GROUP, INC. AND SUBSIDIARIES
NOTES TO UNAUDITED CONSOLIDATED FINANCIAL STATEMENTS
September 30, 2012
NOTES TO UNAUDITED CONSOLIDATED FINANCIAL STATEMENTS
September 30, 2012
NOTE 1 — BASIS OF
PRESENTATION
The accompanying unaudited condensed consolidated financial
statements have been prepared in accordance with accounting principles generally accepted in the United States of America (“US GAAP”).
Certain information and footnote disclosures normally included in financial statements prepared in accordance with US GAAP have been condensed or
omitted as permitted by rules and regulations of the US Securities and Exchange Commission (“SEC”). The condensed consolidated balance sheet
as of December 31, 2011 was derived from the audited consolidated financial statements of Yew Bio-Pharm Group, Inc. (individually “YBP” and
collectively with its subsidiaries and operating variable interest entity, the “Company”). The accompanying unaudited condensed consolidated
financial statements should be read in conjunction with the consolidated balance sheet of the Company as of December 31, 2011, and the related
consolidated statements of income and comprehensive income, changes in shareholders’ equity and cash flows for the year then ended included in the
Company’s Registration Statement on Form 10/A filed with the SEC.
In the opinion of management, all adjustments (which include
normal recurring adjustments) necessary to present a fair statement of the financial position as of September 30, 2012, and the results of operations
and cash flows for the nine-month period ended September 30, 2012 and 2011, have been made.
The preparation of consolidated financial statements in
accordance with US GAAP requires management to make estimates and assumptions that affect the reported amounts of assets and liabilities and
disclosures of contingent assets and liabilities at the date of the consolidated financial statements and the reported amounts of revenues and expenses
during the reporting period. Actual results could differ from those estimates. The Company continually evaluates its estimates, including those related
to bad debts, inventories, recovery of long-lived assets, income taxes, and the valuation of equity transactions. The Company bases its estimates on
historical experience and on various other assumptions that it believed to be reasonable under the circumstances, the results of which form the basis
for making judgments about the carrying values of assets and liabilities that are not readily apparent from other sources. Any future changes to these
estimates and assumptions could cause a material change to our reported amounts of revenues, expenses, assets and liabilities. Actual results may
differ from these estimates under different assumptions or conditions.
Details of the Company’s subsidiaries and variable interest
entities (“VIE”) are as follows:
| Name |
Domicile and date of incorporation |
Registered capital |
Effective ownership |
Principal activities |
||||||||||||||
|---|---|---|---|---|---|---|---|---|---|---|---|---|---|---|---|---|---|---|
Heilongjiang
Jinshangjing Bio-Technology Development Co., Limited (“JSJ”) |
PRC October 29, 2009 |
USD
$100,000 |
100% |
Holding company |
||||||||||||||
Yew Bio-Pharm
Holdings Limited (“Yew Bio-Pharm (HK)”) |
Hong
Kong November 29, 2010 |
HK$10,000 |
100% |
Holding company of JSJ |
||||||||||||||
F-35
YEW BIO-PHARM GROUP, INC. AND SUBSIDIARIES
NOTES TO UNAUDITED CONSOLIDATED FINANCIAL STATEMENTS
September 30, 2012
NOTES TO UNAUDITED CONSOLIDATED FINANCIAL STATEMENTS
September 30, 2012
| Name |
Domicile and date of incorporation |
Registered capital |
Effective ownership |
Principal activities | ||||||||||||||
|---|---|---|---|---|---|---|---|---|---|---|---|---|---|---|---|---|---|---|
Harbin Yew
Science and Technology Development Co., Ltd. (“HDS”) |
PRC August 22, 1996 |
RMB
45,000,000 |
Contractual arrangements |
Processing and selling yew raw materials used in the manufacture of TCM; growing and selling yew tree seedlings and mature trees, including
potted miniature yew trees; and manufacturing and selling furniture and handicrafts made of yew tree timber |
||||||||||||||
NOTE 2 — PRINCIPLES OF
CONSOLIDATION
The consolidated financial statements include the financial
statements of YBP, its subsidiaries and operating VIE, in which the Company is the primary beneficiary. All significant intercompany balances and
transactions have been eliminated on consolidation.
YBP’s subsidiary JSJ entered into a series of contractual
arrangements (the “Contractual Arrangements”) with HDS and/or Zhiguo Wang (“Mr. Wang”), his wife Guifang Qi (“Madame
Qi”), Xingming Han (Mr. Han) (collectively, the “HDS Shareholders”) as described below:
• |
Exclusive Business Cooperation Agreement. Pursuant to the Exclusive Business Cooperation Agreement between JSJ and HDS (the “Business Cooperation Agreement”), JSJ has the exclusive right to provide to HDS general business operation services, including advice and strategic planning, as well as consulting services related to technology, research and development, human resources, marketing and other services deemed necessary (collectively, the “Services”). Under the Business Cooperation Agreement, JSJ has exclusive and proprietary rights and interests in all rights, ownership, interests and intellectual properties arising out of or created during the performance of the Business Cooperation Agreement, including but not limited to copyrights, patents, patent applications, software and trade secrets. HDS shall pay to JSJ a monthly consulting service fee (the “Service Fee”) in RMB that is equal to 100% of the monthly net income of HDS. Upon the prior written consent by JSJ, the rate of Service Fee may be adjusted pursuant to the operational needs of HDS. Within 30 days after the end of each month, HDS shall (a) deliver to JSJ the management accounts and operating statistics of HDS for such month, including the net income of HDS during such month (the “Monthly Net Income”), and (b) pay 80% of such Monthly Net Income to JSJ (each such payment, a “Monthly Payment”). Within ninety (90) days after the end of each fiscal year, HDS shall (a) deliver to JSJ financial statements of HDS for such fiscal year, which shall be audited and certified by an independent certified public accountant approved by JSJ, and (b) pay an amount to JSJ equal to the shortfall, if any, of the aggregate net income of HDS for such fiscal year, as shown in such audited financial statements, as compared to the aggregate amount of the Monthly Payments paid by HDS to JSJ in such fiscal year. HDS also granted an irrevocable and exclusive option to JSJ to purchase any and all of the assets of HDS, to the extent permitted under PRC law, at the lowest price permitted by PRC law. Unless earlier terminated in accordance with the provisions of the Business Cooperation Agreement or other agreements separately executed between JSJ and HDS, the Business Cooperation Agreement is for a term of ten years and expires on November 5, 2020; however, the term of the Business Cooperation Agreement may be extended if confirmed in writing by JSJ prior to the expiration of the term thereof. The period of the extended term shall be determined exclusively by JSJ and HDS |
F-36
YEW BIO-PHARM GROUP, INC. AND SUBSIDIARIES
NOTES TO UNAUDITED CONSOLIDATED FINANCIAL STATEMENTS
September 30, 2012
NOTES TO UNAUDITED CONSOLIDATED FINANCIAL STATEMENTS
September 30, 2012
| shall accept such extended term unconditionally. Unless JSJ commits gross negligence, or a fraudulent act, against HDS, HDS shall not terminate the Business Cooperation Agreement prior to the expiration of the term, including any extended term. Notwithstanding the foregoing, JSJ shall have the right to terminate the Business Cooperation Agreement at any time upon giving 30 days’ prior written notice to HDS. |
• |
Exclusive Option Agreement. Under an Exclusive Option Agreement among JSJ, HDS and each HDS Shareholder (individually, an “Option Agreement”), the terms of which are substantively identical to each other, each HDS Shareholder has granted JSJ or its designee the irrevocable and exclusive right to purchase, to the extent permitted under PRC law, all or any part of the HDS Shareholder’s equity interests in HDS (the “Equity Interest Purchase Option”) for RMB 10. If an appraisal is required by PRC laws at the time when and if JSJ exercises the Equity Interest Purchase Option, the parties shall negotiate in good faith and, based upon the appraisal, make a necessary adjustment to the purchase price so that it complies with any and all then applicable PRC laws. Without the consent of JSJ, the HDS Shareholders shall not sell, transfer, mortgage or dispose of their respective shares of HDS stock. Additionally, without the prior consent of JSJ, the HDS Shareholders shall not in any manner supplement, change or amend the articles of association and bylaws of HDS, increase or decrease its registered capital, change the structure of its registered capital in any other manner, or engage in any transactions that could materially affect HDS’ assets, liabilities, rights or operations, including, without limitation, the incurrence or assumption of any indebtedness except incurred in the ordinary course of business, execute any major contract over RMB 500,000, sell or purchase any assets or rights, incur of any encumbrance on any of its assets or intellectual property rights in favor of a third party or transfer of any agreements relating to its business operation to any third party. The term of each Option Agreement is ten years commencing on November 5, 2020 and may be extended at the sole election of JSJ. |
• |
Equity Interest Pledge Agreement. In order to guarantee HDS’s performance of its obligations under the Business Cooperation Agreement, each HDS Shareholder, JSJ and HDS entered into an Equity Interest Pledge Agreement (individually, a “Pledge Agreement”), the terms of which are substantially similar to each other. Pursuant to the Pledge Agreement, each HDS Shareholder pledged all of his or her equity interest in HDS to JSJ. If HDS or the HDS Shareholders breach their respective contractual obligations and such breach is not remedied to the satisfaction of JSJ within 20 days after the giving of notice of breach, JSJ, as pledgee, will be entitled to exercise certain rights, including the right to foreclose upon and sell the pledged equity interests. During the term of the Pledge Agreement, the HDS Shareholder shall not transfer his or her equity interest in HDS or place or otherwise permit any other security interest of other encumbrance to be placed on such equity interest. Upon the full payment of the Service Fee under the Business Cooperation Agreement and upon the termination of HDS’s obligations thereunder, the Pledge Agreement shall be terminated. |
• |
Power of Attorney. Under the Power of Attorney executed by each HDS Shareholder (each, a “Power of Attorney”), the terms of which are substantially similar to each other, JSJ has been granted an exclusive, irrevocable power of attorney to take actions in the place and stead of the HDS Shareholders, to act on behalf of the HDS Shareholder as his or her exclusive agent and attorney with respect to all matters concerning the HDS Shareholder’s equity interests in HDS, including without limitation, the right to: 1) attend shareholders’ meetings of HDS; 2) exercise all the HDS Shareholders’ rights, including voting rights under PRC laws and HDS’s Articles of Association, including but not limited to the sale or transfer or pledge or disposition of the HDS Shareholder’s equity interests in HDS in whole or in part; and 3) designate and appoint on behalf of the HDS Shareholders the legal representative, executive director, supervisor, manager and other senior management of HDS. |
F-37
YEW BIO-PHARM GROUP, INC. AND SUBSIDIARIES
NOTES TO UNAUDITED CONSOLIDATED FINANCIAL STATEMENTS
September 30, 2012
NOTES TO UNAUDITED CONSOLIDATED FINANCIAL STATEMENTS
September 30, 2012
To the extent that the Contractual Arrangements are enforceable
under PRC law, as from time to time interpreted by relevant state agencies, they constitute the valid and binding obligations of each of the parties to
each such agreement.
The Company believes that HDS is considered a VIE under ASC 810
“Consolidation”, because the equity investors in HDS no longer have the characteristics of a controlling financial interest, and the Company,
through JSJ, is the primary beneficiary of HDS and controls HDS’s operations. Accordingly, HDS has been consolidated as a deemed subsidiary into
YBP as a reporting company under ASC 810.
As required by ASC 810-10, the Company performs a qualitative
assessment to determine whether the Company is the primary beneficiary of HDS which is identified as a VIE of the Company. A quality assessment begins
with an understanding of the nature of the risks in the entity as well as the nature of the entity’s activities including terms of the contracts
entered into by the entity, ownership interests issued by the entity and the parties involved in the design of the entity. The Company’s
assessment on the involvement with HDS reveals that the Company has the absolute power to direct the most significant activities that impact the
economic performance of HDS. JSJ is obligated to absorb a majority of the risk of loss from HDS activities and entitles JSJ to receive a majority of
HDS’s expected residual returns. In addition, HDS’s shareholders have pledged their equity interest in HDS to JSJ, irrevocably granted JSJ an
exclusive option to purchase, to the extent permitted under PRC law, all or part of the equity interests in HDS and agreed to entrust all the rights to
exercise their voting power to the person(s) appointed by JSJ. Under the accounting guidance, the Company is deemed to be the primary beneficiary of
HDS and the results of HDS are consolidated in the Company’s consolidated financial statements for financial reporting purposes. Accordingly, as a
VIE, HDS’s sales are included in the Company’s total sales, its income from operations is consolidated with the Company’s and the
Company’s net income includes all of HDS’s net income. The Company does not have any non-controlling interest and, accordingly, did not
subtract any net income in calculating the net income attributable to the Company. Because of the Contractual Arrangements, YBP has a pecuniary
interest in HDS that requires consolidation of HDS’s financial statements with those of the Company.
Additionally, pursuant to ASC 805, as YBP and HDS are under the
common control of the HDS Shareholders, the Second Restructure was accounted for in a manner similar to a pooling of interests. As a result, the
Company’s historical amounts in the accompanying consolidated financial statements give retrospective effect to the Second Restructure, whereby
the assets and liabilities of the Company are reflected at the historical carrying values and their operations are presented as if they were
consolidated for all periods presented, with the results of the Company being consolidated from the date of the Second Transfer Agreement. The accounts
of HDS are consolidated in the accompanying financial statements.
As of September 30, 2012, the Company agreed to waive all
management fees to be payable by HDS and the Company expects to waive such management fees in the near future due to a need of working capital in HDS
to expand HDS’s operations.
The Company is principally engaged in (1) processing and selling
yew raw materials used in the manufacture of TCM; (2) growing and selling yew tree seedlings and mature trees, including potted miniature yew trees;
and (3) manufacturing and selling furniture and handicrafts made of yew tree timber. The Company is located in Harbin, Heilongjiang Province,
China.
YBP has no direct or indirect legal or equity ownership interest
in HDS. However, through the Contractual Arrangements, the stockholders of HDS have assigned all their rights as stockholders, including voting rights
and disposition rights of their equity interests in HDS to JSJ, our indirect, wholly-owned subsidiary. YBP is deemed to be the primary beneficiary of
HDS and the financial statements of HDS are consolidated in the Company’s consolidated financial statements. At September 30, 2012 and December
31, 2011, the carrying amount and classification of the assets and liabilities in the Company’s balance sheets that relate to the Company’s
variable interest in the VIE is as follows:
F-38
YEW BIO-PHARM GROUP, INC. AND SUBSIDIARIES
NOTES TO UNAUDITED CONSOLIDATED FINANCIAL STATEMENTS
September 30, 2012
NOTES TO UNAUDITED CONSOLIDATED FINANCIAL STATEMENTS
September 30, 2012
| September 30, 2012 |
December 31, 2011 |
|||||||||
|---|---|---|---|---|---|---|---|---|---|---|
Assets |
||||||||||
Cash
|
$ | 506,987 | $ | 479,494 | ||||||
Accounts
receivable |
530,470 | — | ||||||||
Inventories
(current and long-term) |
10,603,379 | 8,218,874 | ||||||||
Prepaid
expenses and other assets |
1,595 | 283 | ||||||||
Prepaid rent
— related party |
64,529 | — | ||||||||
Property and
equipment, net |
735,639 | 750,779 | ||||||||
Land use
rights and yew forest assets, net |
15,034,720 | 15,166,197 | ||||||||
Total assets
of VIE |
$ | 27,477,319 | $ | 24,615,627 | ||||||
Liabilities |
||||||||||
Accounts
payable |
$ | 900,489 | $ | 1,360,611 | ||||||
Accrued
expenses and other payables |
23,163 | 73,727 | ||||||||
Taxes payable
|
8,142 | 1,049 | ||||||||
Due to VIE
holding companies |
2,058,426 | 2,164,107 | ||||||||
Due to
related parties |
6,623 | 240,159 | ||||||||
Total
liabilities of VIE |
$ | 2,996,843 | $ | 3,839,653 | ||||||
The assets and liabilities in the table above are held in HDS.
The creditors of HDS have legal recourse only to the assets of HDS and do not have such recourse to the Company. In addition, HDS’ assets are
generally restricted only to pay such liabilities. Thus, the Company’s maximum legal exposure to loss related to VIE is significantly less than
the carrying value of the HDS assets due to outstanding intercompany liabilities. Restricted net assets of the VIE shall mean that amount of our
proportionate share of net assets of HDS (after intercompany eliminations) which as of the end of the most recent fiscal year may not be transferred to
the parent company by the VIE in the form of loans, advances or cash dividends without the consent of a third party (e.g. lender, regulatory agency,
foreign government).
NOTE 3 — RESTATEMENTS
The Company’s consolidated financial statements have been
restated as of December 31, 2011 to reflect the proper accounting treatment for slow-moving inventory and potential reserves for slow-moving inventory.
Based on analysis of inventory, the Company determined that a reclassification of certain inventory should be made from current assets to long-term
assets. The Company originally recorded all inventory in current assets. However, based on analysis of inventory movement and analysis of its operating
cycle of one year, it was subsequently determined that any inventory in excess of our current operating cycle of one year, based on historical and
anticipated levels of sales, should be classified as long-term on its consolidated balance sheets. The classification of long-term inventory requires
the Company to estimate the portion of inventory that can be realized over the next 12 months.
Accordingly, the Company restated its consolidated balance sheet
as of December 31, 2011. The Company did not restate its consolidated statements of income and comprehensive income or consolidated statement of cash
flows for the period ended September 30, 2011. The respective restatement adjustments are non-cash in nature. These adjustments resulted in a decrease
in our total current assets of $7,508,030 and an increase in long-term assets of $7,508,030 as of December 31, 2011, respectively and summarized as
follows:
F-39
YEW BIO-PHARM GROUP, INC. AND SUBSIDIARIES
NOTES TO UNAUDITED CONSOLIDATED FINANCIAL STATEMENTS
September 30, 2012
NOTES TO UNAUDITED CONSOLIDATED FINANCIAL STATEMENTS
September 30, 2012
| December 31, 2011 (As Previously Reported) |
Adjustments to Restate |
December 31, 2011 (As Restated) |
||||||||||||
|---|---|---|---|---|---|---|---|---|---|---|---|---|---|---|
Consolidated Balance Sheet: |
||||||||||||||
Assets: |
||||||||||||||
Current Assets: |
||||||||||||||
Inventories |
$ | 8,218,874 | $ | (7,508,030 | ) | $ | 710,844 | |||||||
Total
Current Assets |
8,951,678 | (7,508,030 | ) | 1,443,648 | ||||||||||
Long-term Assets: |
||||||||||||||
Inventories, net of current portion |
— | 7,508,030 | 7,508,030 | |||||||||||
Total
Assets |
$ | 24,902,097 | $ | — | $ | 24,902,097 | ||||||||
NOTE 4 — INVENTORIES
Inventories consisted of raw materials, work-in-progress,
finished goods-handicrafts, yew seedlings and other trees (consisting of larix, spruce and poplar trees). The Company classifies its inventories based
on its historical and anticipated levels of sales; any inventory in excess of its normal operating cycle of one year is classified as long-term on its
consolidated balance sheets. As of September 30, 2012 and December 31, 2011, inventories consisted of the following:
| September 30, 2012 |
December 31, 2011 |
||||||||||||||||||||||||||
|---|---|---|---|---|---|---|---|---|---|---|---|---|---|---|---|---|---|---|---|---|---|---|---|---|---|---|---|
| Current portion |
Long-term portion |
Total |
Current portion |
Long-term portion |
Total |
||||||||||||||||||||||
Raw materials
|
$ | 208,862 | $ | 2,727,438 | $ | 2,936,300 | $ | 29,401 | $ | 2,817,980 | $ | 2,847,381 | |||||||||||||||
Work-in-process |
18,732 | — | 18,732 | 18,642 | — | 18,642 | |||||||||||||||||||||
Finished
goods — handicrafts |
229,740 | 631,004 | 860,744 | 236,854 | 687,258 | 924,112 | |||||||||||||||||||||
Yew seedlings
|
442,449 | 4,125,309 | 4,567,758 | 425,947 | 4,002,792 | 4,428,739 | |||||||||||||||||||||
Other trees
|
— | 2,219,845 | 2,219,845 | — | — | — | |||||||||||||||||||||
| $ | 899,783 | $ | 9,703,596 | $ | 10,603,379 | $ | 710,844 | $ | 7,508,030 | $ | 8,218,874 | ||||||||||||||||
NOTE 5 — PROPERTY AND
EQUIPMENT
Property and equipment consisted of the following as of September
30, 2012 and December 31, 2011:
| September 30, 2012 |
December 31, 2011 |
|||||||||
|---|---|---|---|---|---|---|---|---|---|---|
Buildings and
building improvements |
$ | 351,321 | $ | 267,015 | ||||||
Machinery and
equipment |
522,939 | 520,416 | ||||||||
Office equipment
|
46,207 | 44,841 | ||||||||
Leasehold
improvement |
53,019 | 52,763 | ||||||||
Motor vehicles
|
639,885 | 513,280 | ||||||||
| 1,613,371 | 1,398,315 | |||||||||
Less:
accumulated depreciation |
(775,369 | ) | (614,093 | ) | ||||||
| $ | 838,002 | $ | 784,222 | |||||||
For the three months ended September 30, 2012 and 2011,
depreciation expense amounted to $55,302 and $44,150, respectively. For the nine months ended September 30, 2012 and 2011, depreciation expenses
amounted to $158,502 and $128,086, respectively.
F-40
YEW BIO-PHARM GROUP, INC. AND SUBSIDIARIES
NOTES TO UNAUDITED CONSOLIDATED FINANCIAL STATEMENTS
September 30, 2012
NOTES TO UNAUDITED CONSOLIDATED FINANCIAL STATEMENTS
September 30, 2012
NOTE 6 — LAND AND YEW FOREST USE
RIGHTS
There is no private ownership of land in PRC. Land is owned by
the government and the government grants land use rights for specified terms. The following summarizes land use rights acquired by the
Company.
Yew trees on land containing yew tree forests will be used to
supply raw materials such as branches and leaves that will be used by the Company’s customers for production of TCM. The Company amortizes these
land and yew forest use rights over the term of the respective land use right. The lease agreements do not have any renewal option and the Company has
no further obligations to the lessor. The Company records the amortization of these land and yew forest use rights as part of its cost of revenues. For
the three months ended September 30, 2012 and 2011, amortization expense amounted to $87,050 and $88,830, respectively. For the nine months ended
September 30, 2012 and 2011, amortization expense amounted to $259,221 and $213,131, respectively. As of September 30, 2012, land and yew forest use
rights consisted of the following:
| Description |
Useful life |
Acquisition date |
Expiration date |
Metric acres (“Mu”) |
||||||||||||||||||
|---|---|---|---|---|---|---|---|---|---|---|---|---|---|---|---|---|---|---|---|---|---|---|
Parcel
A |
Undeveloped forest land |
50 |
3/2004 |
3/2054 |
125 |
|||||||||||||||||
Parcel
B |
Undeveloped forest land |
50 |
4/2004 |
4/2054 |
400 |
|||||||||||||||||
Parcel
C |
Yew
tree forests and underlying land |
50 |
1/2008 |
1/2058 |
290 |
|||||||||||||||||
Parcel
D |
Yew
tree forests and underlying land |
45 |
3/2010 |
3/2055 |
15,865 |
|||||||||||||||||
Parcel
E |
Undeveloped forest land |
16 |
7/2012 |
3/2028 |
117.5 |
|||||||||||||||||
At September 30, 2012 and December 31, 2011, land and yew forest
use rights consisted of the following:
| Useful life |
September 30, 2012 |
December 31, 2011 |
||||||||||||
|---|---|---|---|---|---|---|---|---|---|---|---|---|---|---|
Land
and yew forest use rights |
16–50 years | $ | 15,675,733 | $ | 15,546,414 | |||||||||
Less:
accumulated amortization |
(641,013 | ) | (380,217 | ) | ||||||||||
Total
|
$ | 15,034,720 | $ | 15,166,197 | ||||||||||
Amortization of land and yew forest use rights attributable to
future periods is as follows:
| Twelve-month periods ending September 30: |
Amount |
|||||
|---|---|---|---|---|---|---|
2013
|
$ | 348,056 | ||||
2014
|
348,056 | |||||
2015
|
348,056 | |||||
2016
|
348,056 | |||||
2017
|
348,056 | |||||
2018 and
thereafter |
13,294,440 | |||||
Total
|
$ | 15,034,720 | ||||
NOTE 7 — ACCRUED EXPENSES AND OTHER
PAYABLES
At September 30, 2012 and December 31, 2011, accrued expenses and
other payables consisted of the following:
| September 30, 2012 |
December 31, 2011 |
|||||||||
|---|---|---|---|---|---|---|---|---|---|---|
Accrued wage
|
$ | 19,939 | $ | 16,844 | ||||||
Accrued
professional fees |
10,000 | 75,029 | ||||||||
Other
|
20,000 | 28,028 | ||||||||
Total
|
$ | 49,939 | $ | 119,901 | ||||||
F-41
YEW BIO-PHARM GROUP, INC. AND SUBSIDIARIES
NOTES TO UNAUDITED CONSOLIDATED FINANCIAL STATEMENTS
September 30, 2012
NOTES TO UNAUDITED CONSOLIDATED FINANCIAL STATEMENTS
September 30, 2012
NOTE 8 — TAXES
(a) Federal Income Tax and Enterprise Income Taxes
The Company is incorporated in the State of Nevada and is subject
to the United States federal income tax at a tax rate of 34%. No provision for income taxes in the U.S. has been made as the Company had no U.S.
taxable income as of September 30, 2012 and December 31, 2011.
The Company’s subsidiary and VIE, JSJ and HDS, respectively,
being incorporated in the PRC, are subject to PRC’s Enterprise Income Tax. Pursuant to the PRC Income Tax Laws, Enterprise Income Taxes
(“EIT”) is generally imposed at 25%. However, JSJ and HDS has been named as a leading enterprise in the agricultural area and awarded with a
tax exemption for the years up to December 31, 2058.
The table below summarizes the difference between the U.S.
statutory federal tax rate and the Company’s effective tax rate for the nine months ended September 30, 2012 and 2011:
| Nine Months Ended September 30, |
|||||||||||
|---|---|---|---|---|---|---|---|---|---|---|---|
| 2012 |
2011 |
||||||||||
U.S. federal
income tax rate |
34 | % | 34 | % | |||||||
Foreign income
not recognized in the U.S. |
(34 | )% | (34 | )% | |||||||
PRC enterprise
income tax |
25 | % | 25 | % | |||||||
Tax exemption
|
(25 | )% | (25 | )% | |||||||
Total provision
for income tax |
— | — | |||||||||
Income before income tax expenses of $879,659 and $712,305 for
the three months ended September 30, 2012 and 2011, respectively, and $3,359,870 and $2,838,337 for the nine months ended September 30, 2012 and 2011,
respectively, was attributed to subsidiaries with operations in China. No income tax expense related to China income incurred for the nine months ended
September 30, 2012 and 2011.
The combined effects of the income tax expense exemptions and tax
reductions available to the Company for the three and nine months ended September 30, 2012 and 2011 are as follows:
| Three Months Ended September 30, |
Nine Months Ended September 30, |
||||||||||||||||||
|---|---|---|---|---|---|---|---|---|---|---|---|---|---|---|---|---|---|---|---|
| 2012 |
2011 |
2012 |
2011 |
||||||||||||||||
Tax exemption
effect |
$ | 255,902 | $ | 188,982 | $ | 909,548 | $ | 737,027 | |||||||||||
Basic net
income per share effect |
$ | (0.01 | ) | $ | (0.00 | ) | $ | (0.02 | ) | $ | (0.02 | ) | |||||||
Diluted net
income per share effect |
$ | (0.01 | ) | $ | (0.00 | ) | $ | (0.02 | ) | $ | (0.01 | ) | |||||||
The Company has incurred United States net operating loss for
income tax purposes for the three and nine months ended September 30, 2012 and 2011. The net operating loss carry forwards for United States income tax
purposes amounted to $830,018 and $564,438 at September 30, 2012 and December 31, 2011, respectively, which may be available to reduce future
years’ taxable income. These carry forwards will expire, if not utilized, through 2032. Management believes that the realization of the benefits
arising from this loss appear to be uncertain due to the Company’s limited operating history and continuing losses for United States income tax
purposes. Accordingly, the Company has provided a 100% valuation allowance at September 30, 2012 and December 31, 2011. The valuation allowance at
September 30, 2012 and December 31, 2011 was approximately $282,206 and $191,909, respectively. The net change in the valuation allowance was an
increase of $47,527 and $13,566 during the three months ended September 30, 2012 and 2011, respectively, and $90,297 and $33,224 during the nine months
ended September 30, 2012 and 2011, respectively, and management will review this valuation allowance periodically and make adjustments as
warranted.
F-42
YEW BIO-PHARM GROUP, INC. AND SUBSIDIARIES
NOTES TO UNAUDITED CONSOLIDATED FINANCIAL STATEMENTS
September 30, 2012
NOTES TO UNAUDITED CONSOLIDATED FINANCIAL STATEMENTS
September 30, 2012
For U.S. tax purposes, the Company has cumulative undistributed
earnings of foreign subsidiary and VIE of approximately $15.3 million and $12.0 million as of September 30, 2012 and December 31, 2011, respectively,
which are included in consolidated retained earnings and will continue to be indefinitely reinvested in international operations. Accordingly, no
provision has been made for U.S. deferred taxes related to future repatriation of these earnings, nor is it practicable to estimate the amount of
income taxes that would have to be provided if we concluded that such earnings will be remitted to the U.S. in the future.
There will be no deferred income tax assets or liabilities
calculation in the Federal Income Tax because the US corporation taxable loss and deferred taxable loss was the same and the use of any net operating
loss carry forwards appears to be uncertain, There will be no deferred income tax assets or liabilities calculation in the EIT because the Company
awarded EIT exempted status under agricultural area.
The Company did not have any interest and penalty provided or
recognized in the income statements for the three and nine months ended September 30, 2012 and 2011 or balance sheet as of September 30, 2012 and
December 31, 2011. The Company did not have uncertainty tax positions or events leading to uncertainty tax position within the next 12 months. The
Company’s 2009, 2010 and 2011 U.S. Corporation Income Tax Return are subject to U.S. Internal Revenue Service examination. The Company’s
2008, 2009, 2010 and 2011 China corporate income tax returns are subject to China State Administration of Taxation examination.
(b) Value Added Taxes
The applicable VAT tax rate is 13% for agricultural products and
17% for handicrafts sold in the PRC. In accordance with VAT regulations in the PRC, the Company is exempt from paying VAT on its yew seedling and trees
sales as an agricultural corps cultivating company up to December 31, 2016. VAT payable in the PRC is charged on an aggregated basis at the applicable
rate on the full price collected for the goods sold or taxable services provided and less any deductible VAT already paid by the taxpayer on purchases
of goods in the same financial year.
NOTE 9 — STOCKHOLDERS’
EQUITY
At December 31, 2011, the Company reflected a $950,000 refundable
common stock subscription liability related to 9,500,000 of the shares in a private offering of the Company’s common stock (the “2009 Summer
Offering”) on the accompanying balance sheet. The 9,500,000 shares of YBP Common Stock were the subject of a rescission offering (the
“Rescission Offering”) to the 62 subscribers in the 2009 Summer Offering, all of whom are residents of the PRC. In the Rescission Offering,
subscribers in the 2009 Summer Offering could either 1) confirm their subscriptions of shares of YBP Common Stock or 2) elect to rescind their
subscriptions of shares of YBP Common Stock and receive a refund of their respective subscription amounts, together with interest. Pursuant to the
Rescission Offering, which was conducted in March 2012, all the subscribers in the 2009 Summer Offering confirmed their subscriptions for an aggregate
9,500,000 shares of YBP Common Stock.
Pursuant to an agreement dated November 1, 2010 between YBP and a
consultant, a resident of the U.S., YBP agreed to pay $20,000 cash and 500,000 Shares to the consultant as compensation for consulting services
rendered by him to the Company. The shares were valued at $0.10 per share or $50,000 in total and the Company recorded $50,000 of compensation expense
related to those Shares for the year ended December 31, 2010. The shares were recorded as outstanding as of September 30, 2012 and December 31,
2011.
NOTE 10 — EARNINGS PER SHARE
ASC 260 “Earnings per Share,” requires dual
presentation of basic and diluted earnings per share (“EPS”) with a reconciliation of the numerator and denominator of the basic EPS
computation to the numerator and denominator of the diluted EPS computation. Basic EPS excludes dilution. Diluted EPS reflects the
potential
F-43
YEW BIO-PHARM GROUP, INC. AND SUBSIDIARIES
NOTES TO UNAUDITED CONSOLIDATED FINANCIAL STATEMENTS
September 30, 2012
NOTES TO UNAUDITED CONSOLIDATED FINANCIAL STATEMENTS
September 30, 2012
dilution that could occur if securities or other contracts to issue common stock were exercised or converted into common stock or resulted in the issuance of common stock that then shared in the earnings of the entity.
Basic net income per share is computed by dividing net income
available to common shareholders by the weighted average number of shares of common stock outstanding during the period. Diluted income per share is
computed by dividing net income by the weighted average number of shares of common stock, common stock equivalents and potentially dilutive securities
outstanding during each period.
The following table presents a reconciliation of basic and
diluted net income per share for the three months ended September 30, 2012 and 2011:
| Three Months Ended September 30, |
|||||||||||
|---|---|---|---|---|---|---|---|---|---|---|---|
| 2012 |
2011 |
||||||||||
Net income
available to common stockholders for basic and diluted net income per share of common stock |
$ | 879,659 | $ | 712,305 | |||||||
Weighted average
common stock outstanding — basic |
50,000,000 | 40,500,000 | |||||||||
Effect of
dilutive securities: |
|||||||||||
Subscribed
common shares issuable and subject to recession |
— | 9,500,000 | |||||||||
Weighted average
common stock outstanding — diluted |
50,000,000 | 50,000,000 | |||||||||
Net income per
common share — basic |
$ | 0.02 | $ | 0.02 | |||||||
Net income per
common share — diluted |
$ | 0.02 | $ | 0.01 | |||||||
The following table presents a reconciliation of basic and
diluted net income per share for the nine months ended September 30, 2012 and 2011:
| Nine Months Ended September 30, |
|||||||||||
|---|---|---|---|---|---|---|---|---|---|---|---|
| 2012 |
2011 |
||||||||||
Net income
available to common stockholders for basic and diluted net income per share of common stock |
$ | 3,359,870 | $ | 2,838,337 | |||||||
Weighted average
common stock outstanding — basic |
47,052,920 | 40,500,000 | |||||||||
Effect of
dilutive securities: |
|||||||||||
Subscribed
common shares issuable and subject to recession |
2,947,080 | 9,500,000 | |||||||||
Weighted average
common stock outstanding — diluted |
50,000,000 | 50,000,000 | |||||||||
Net income per
common share — basic |
$ | 0.07 | $ | 0.07 | |||||||
Net income per
common share — diluted |
$ | 0.07 | $ | 0.06 | |||||||
NOTE 11 — CONCENTRATIONS OF CREDIT RISK AND MAJOR
CUSTOMERS
Customers
For the three and nine months ended September 30, 2012 and 2011,
customers accounting for 10% or more of the Company’s revenue were as follows:
| Three Months Ended September 30, |
Nine Months Ended September 30, |
||||||||||||||||||
|---|---|---|---|---|---|---|---|---|---|---|---|---|---|---|---|---|---|---|---|
| Customer |
2012 |
2011 |
2012 |
2011 |
|||||||||||||||
A |
20 | % | 27 | % | 16 | % | 28 | % | |||||||||||
B |
32 | % | 21 | % | 12 | % | 26 | % | |||||||||||
F-44
YEW BIO-PHARM GROUP, INC. AND SUBSIDIARIES
NOTES TO UNAUDITED CONSOLIDATED FINANCIAL STATEMENTS
September 30, 2012
NOTES TO UNAUDITED CONSOLIDATED FINANCIAL STATEMENTS
September 30, 2012
| Three Months Ended September 30, |
Nine Months Ended September 30, |
||||||||||||||||||
|---|---|---|---|---|---|---|---|---|---|---|---|---|---|---|---|---|---|---|---|
| Customer |
2012 |
2011 |
2012 |
2011 | |||||||||||||||
C |
13 | % | 24 | % | 14 | % | 14 | % | |||||||||||
D |
* | 18 | % | * | * | ||||||||||||||
E |
17 | % | * | 14 | % | * | |||||||||||||
F |
* | * | 11 | % | * | ||||||||||||||
G |
* | * | 13 | % | * | ||||||||||||||
* |
Less than10% |
Three of the Company’s top five largest customers for the
nine months ended September 30, 2012 accounted for 100% of the Company’s accounts receivable at September 30, 2012. The Company did not have any
accounts receivable at December 31, 2011.
Suppliers
For the three and nine months ended September 30, 2012, the
Company did not make any purchases of yew seedlings. In connection with an agreement to acquire a land use right (see Note 15) in July 2012 (the
“Fuye Field Agreement”), the Company acquired more than 80,000 trees — which are not yew trees — for approximately $2.2 million
(the amount was included in the land use right agreement as part of the purchase price) from an individual. For the three and nine months ended
September 30, 2012, this purchase accounted for 100% and 95%, respectively, of the Company’s purchase of yew seedlings and other trees and the
Company had accounts payable of $895,532 related to the supplier at September 30, 2012. For the three months ended September 30, 2011, the Company did
not make any purchases of yew seedlings. For the nine months ended September 30, 2011, one company accounted for 94% of the Company’s purchase of
yew seedlings and the Company had accounts payable of $2,379,308 related to the supplier at September 30, 2011.
NOTE 12 — RELATED PARTY
TRANSACTIONS
In addition to several of the Company’s officers and
directors, the Company conducted transactions with the following related parties:
| Company |
Ownership |
|||||
|---|---|---|---|---|---|---|
Heilongjiang
Zishan Technology Stock Co., Ltd. (“ZTC”) |
18%
owned by Heilongjiang Hongdoushan Ecology Forest Stock Co., Ltd., 39% owned by Zhiguo Wang, Chairman and Chief Executive Officer, 31% owned by Guifang
Qi, the wife of Mr. Wang and Director of the Company, and 12% owned by third parties. |
|||||
Heilongjiang Yew
Pharmaceuticals, Co., Ltd. (“Yew Pharmaceutical”) |
95%
owned by Heilongjiang Hongdoushan Ecology Forest Stock Co., Ltd., and 5% owned by Madame Qi. |
|||||
Shanghai Kairun
Bio-Pharmaceutical Co., Ltd. (“Kairun”) |
60%
owned by Heilongjiang Zishan Technology Co., Ltd., 20% owned by Heilongjiang Hongdoushan Ecology Forest Stock Co., Ltd., and 20% owned by Mr.
Wang. |
|||||
Heilongjiang
Hongdoushan Ecology Forest Stock Co., Ltd. (“HEFS”) |
63%
owned by Mr. Wang, 34% owned by Madame Qi, and 3% owned by third parties. |
|||||
F-45
YEW BIO-PHARM GROUP, INC. AND SUBSIDIARIES
NOTES TO UNAUDITED CONSOLIDATED FINANCIAL STATEMENTS
September 30, 2012
NOTES TO UNAUDITED CONSOLIDATED FINANCIAL STATEMENTS
September 30, 2012
Revenue from Related Parties
Pursuant to the Cooperation and Development Agreement discussed
below, the Company generated sales from its related party company, Yew Pharmaceutical. For the three and nine months ended September 30, 2012 and 2011,
the Company recorded revenues from this related party, as follows:
| Three Months Ended September 30, |
Nine Months Ended September 30, |
||||||||||||||||||
|---|---|---|---|---|---|---|---|---|---|---|---|---|---|---|---|---|---|---|---|
| Name of related party |
2012 |
2011 |
2012 |
2011 |
|||||||||||||||
Yew
pharmaceutical |
$ | 442,467 | $ | 251,876 | $ | 602,159 | $ | 1,169,688 | |||||||||||
Total
|
$ | 442,467 | $ | 251,876 | $ | 602,159 | $ | 1,169,688 | |||||||||||
At September 30, 2012 and December 31, 2011, the Company did not
have any accounts receivable from Yew Pharmaceutical.
Cooperation and Development Agreement
On January 9, 2010, the Company entered into a Cooperation and
Development Agreement (the “Development Agreement”) with Yew Pharmaceutical. Pursuant to the Development Agreement, for a period of ten years
expiring on January 9, 2020, the Company shall supply cultivated yew raw materials to Yew Pharmaceutical that will be used by Yew Pharmaceutical to
make TCM and other pharmaceutical products, at price of RMB 1,000,000 (approximately $158,000) per metric ton. For the three months ended September 30,
2012 and 2011, sales to Yew Pharmaceutical under the Development Agreement amounted to $442,467 and $251,876, respectively. For the nine months ended
September 30, 2012 and 2011, sales to Yew Pharmaceutical under the Development Agreement amounted to $600,558 and $1,169,688, respectively. At
September 30, 2012 and December 31, 2011, the Company did not have any accounts receivable from Yew Pharmaceutical.
Purchases
For the three and nine months ended September 30, 2012 and 2011,
the Company did not make any material purchases from its related party companies. At September 30, 2012 and December 31, 2011, there were no accounts
payable amounts related to related parties.
Operating leases
On March 25, 2005, the Company entered into an Agreement for the
Lease of Seedling Land with ZTC (the “ZTC Lease”). Pursuant to the ZTC Lease, the Company leased 361 mu of land from ZTC for a period of 30
years, expiring on March 24, 2035. Annual payments under the ZTC Lease are RMB 162,450 (approximately $25,400). The payment for the first five years of
the ZTC Lease was due prior to December 31, 2010 and beginning in 2011, the Company is required to make full payment for the land use rights in advance
for each subsequent five-year period. For the three months ended September 30, 2012 and 2011, rent expense related to the ZTC Lease amounted to $6,414
and $6,323, respectively. For the nine months ended September 30, 2012 and 2011, rent expense related to the ZTC Lease amounted to $19,255 and $18,727,
respectively. At September 30, 2012, prepaid rent to ZTC amounted to $64,118. At December 31, 2011, amounts due under the ZTC lease amounted to
$172,284, and are included in due to related parties on the accompanying consolidated balance sheets.
On December 3, 2008, the Company entered into a lease for retail
space in Harbin with Madame Qi (the “Store Lease”). Pursuant to the Store Lease, no payment was due for the first year and an annual payment
of RMB 12,000 (approximately $1,875) is due for each of the second and third years thereof. The term of the Store Lease is three years and expired on
December 3, 2011. On November 15, 2011, the Company renewed the Store Lease. Pursuant to the renewed Store Lease, the annual rent is RMB 15,600
(approximately $2,359) and the annual payment is due by May 30 of each year. The term of the renewed Store Lease is 3 years and
F-46
YEW BIO-PHARM GROUP, INC. AND SUBSIDIARIES
NOTES TO UNAUDITED CONSOLIDATED FINANCIAL STATEMENTS
September 30, 2012
NOTES TO UNAUDITED CONSOLIDATED FINANCIAL STATEMENTS
September 30, 2012
expires on December 1, 2014. For the three months ended September 30, 2012 and 2011, rent expense related to the Store Lease amounted to $616 and $467, respectively. For the nine months ended September 30, 2012 and 2011, rent expense related to the Store Lease amounted to $1,849 and $1,383, respectively. At September 30, 2012, prepaid rent to Madame Qi amounted to $411.
On January 1, 2010, the Company entered into a lease for office
space with Mr. Wang (the “Office Lease”). Pursuant to the Office Lease, annual payments of RMB 15,000 (approximately $2,400) are due for each
of the term. The term of the Office Lease is 15 years and expires on December 31, 2025. For the three months ended September 30, 2012 and 2011, rent
expense related to the Office Lease amounted $592 and $584, respectively. For the nine months ended September 30, 2012 and 2011, rent expense related
to the Office Lease amounted $1,778 and $1,729, respectively.
On July 1, 2012, the Company entered into a lease for office
space with Mr. Wang (the “Far East Office Lease”). Pursuant to the Far East Office Lease, JSJ leases approximately 30 square meter of office
space from Mr. Wang in Harbin. Rent under the Far East Office Lease is RMB 10,000 (approximately $1,600) annually. The term of the Far East Office
Lease is three years and expires on June 30, 2015. For the three and nine months ended September 30, 2012, rent expense related to the Far East Office
Lease amounted $395. At September 30, 2012, prepaid rent to Mr. Wang related to the Far East Office Lease amounted to $2,763.
At September 30, 2012, the total prepaid rent for above operating
lease amounted to $67,292 which was included in prepaid rent — related parties on the accompanying consolidated balance sheets.
Future minimum rental payments required under the related party
operating leases are as follows:
| Twelve-month periods ending September 30: |
||||||
|---|---|---|---|---|---|---|
2013
|
$ | 32,057 | ||||
2014
|
32,057 | |||||
2015
|
29,610 | |||||
2016
|
28,015 | |||||
2017
|
28,015 | |||||
Thereafter |
468,366 | |||||
Total
|
$ | 618,120 |
Due to/due from related parties
The Company also received from and provided advances to its
officers and directors and related parties. These advances are unsecured and payable on demand. The due to/due from related party amount at September
30, 2012 and December 31, 2011 is as follows:
| Due to related party |
|||||||||||
|---|---|---|---|---|---|---|---|---|---|---|---|
| Name of related party |
September 30, 2012 |
December 31, 2011 |
|||||||||
Zhiguo Wang
|
$ | 54,409 | $ | 31,357 | |||||||
Yew
Pharmaceutical |
— | 62,847 | |||||||||
Madame Qi
|
1,689 | — | |||||||||
ZTC
|
— | 172,284 | |||||||||
Total
|
$ | 56,098 | $ | 266,488 | |||||||
F-47
YEW BIO-PHARM GROUP, INC. AND SUBSIDIARIES
NOTES TO UNAUDITED CONSOLIDATED FINANCIAL STATEMENTS
September 30, 2012
NOTES TO UNAUDITED CONSOLIDATED FINANCIAL STATEMENTS
September 30, 2012
Research and Development Agreement
The Company entered into a Technology Development Service
Agreement dated January 1, 2010 (the “Technology Agreement”) with Kairun. The term of the Technology Agreement was two years. Under the
Technology Agreement, Kairun provides the Company with testing and technologies regarding utilization of yew trees to extract taxol and develop higher
concentration of taxol in the yew trees the Company grow and cultivate. For these services, the Company agreed to pay Kairun RMB 200,000 after the
technologies developed by Kairun are tested and approved by the Company. The Company will retain all intellectual property rights in connection with
the technologies developed by Kairun. Kairun may not provide similar services to any other party without the Company’s prior written consent. In
February 2012, we entered into a supplemental agreement with Kairun, extending the term of the Technology Agreement indefinitely until project results
specified in the original Technology Agreement have been achieved. Kairun is owned directly and indirectly primarily by Mr. Wang and Madame Qi. As of
September 30, 2012, Kairun has not yet completed the services provided for in the Technology Agreement and, therefore, no payment was made to
Kairun.
NOTE 13 — STATUTORY RESERVES
The Company is required to make appropriations to reserve funds,
comprising the statutory surplus reserve and discretionary surplus reserve, based on after-tax net income determined in accordance with generally
accepted accounting principles of the PRC (“PRC GAAP”). Appropriation to the statutory surplus reserve is required to be at least 10% of the
after tax net income determined in accordance with PRC GAAP until the reserve is equal to 50% of the entities’ registered capital. Appropriations
to the discretionary surplus reserve are made at the discretion of the Board of Directors.
The statutory surplus reserve fund is non-distributable other
than during liquidation and can be used to fund previous years’ losses, if any, and may be utilized for business expansion or converted into share
capital by issuing new shares to existing shareholders in proportion to their shareholding or by increasing the par value of the shares currently held
by them, provided that the remaining reserve balance after such issue is not less than 25% of the registered capital. For the three months ended
September 30, 2012 and 2011, the Company appropriated to the statutory surplus reserve in the amount of $102,361 and $75,593, respectively. For the
nine months ended September 30, 2012 and 2011, the Company appropriated to the statutory surplus reserve in the amount of $363,819 and $294,811,
respectively. The accumulated balance of the statutory reserve of the Company as of September 30, 2012 and December 31, 2011 was $2,049,906 and
$1,686,087, respectively.
NOTE 14 — SEGMENT INFORMATION
ASC 280 requires use of the “management approach” model
for segment reporting. The management approach model is based on the way a company’s management organizes segments within the company for making
operating decisions and assessing performance. Reportable segments are based on products and services, geography, legal structure, management
structure, or any other manner in which management disaggregates a company.
During the three and nine months ended September 30, 2012 and
2011, the Company operated in three reportable business segments: (1) the TCM raw materials segment, consisting of the production and sale of yew raw
materials used in the manufacture of TCM; (2) the yew tree segment, consisting of the growth and sale of yew tree seedlings and mature trees, including
potted miniature yew trees; and (3) the handicrafts segment, consisting of the manufacture and sale of handicrafts and furniture made of yew timber.
The Company’s reportable segments are strategic business units that offer different products. They are managed separately based on the fundamental
differences in their operations. All of the Company’s operations are conducted in the PRC.
F-48
YEW BIO-PHARM GROUP, INC. AND SUBSIDIARIES
NOTES TO UNAUDITED CONSOLIDATED FINANCIAL STATEMENTS
September 30, 2012
NOTES TO UNAUDITED CONSOLIDATED FINANCIAL STATEMENTS
September 30, 2012
Information with respect to these reportable business segments
for the three and nine months ended September 30, 2012 and 2011 is as follows:
| For the Three Months Ended September 30, |
For the Nine Months Ended September 30, |
||||||||||||||||||
|---|---|---|---|---|---|---|---|---|---|---|---|---|---|---|---|---|---|---|---|
| 2012 |
2011 |
2012 |
2011 |
||||||||||||||||
Revenues: |
|||||||||||||||||||
TCM raw
materials |
$ | 893,909 | $ | 859,497 | $ | 2,860,552 | $ | 2,659,234 | |||||||||||
Yew trees
|
396,416 | 322,015 | 1,853,504 | 1,665,665 | |||||||||||||||
Handicrafts
|
82,699 | 24,486 | 118,734 | 91,391 | |||||||||||||||
| 1,373,024 | 1,205,998 | 4,832,790 | 4,416,290 | ||||||||||||||||
Cost
of revenues: |
|||||||||||||||||||
TCM raw
materials |
158,354 | 161,226 | 446,436 | 640,843 | |||||||||||||||
Yew trees
|
21,395 | 88,380 | 320,410 | 287,681 | |||||||||||||||
Handicrafts
|
51,188 | 11,524 | 69,863 | 60,068 | |||||||||||||||
| 230,937 | 261,130 | 836,709 | 988,592 | ||||||||||||||||
Depreciation and amortization: |
|||||||||||||||||||
TCM raw
materials |
84,334 | 95,545 | 253,157 | 208,248 | |||||||||||||||
Yew trees
|
14,573 | 13,020 | 41,638 | 37,485 | |||||||||||||||
Handicrafts
|
7,428 | 9,538 | 23,532 | 23,824 | |||||||||||||||
Other
|
36,017 | 14,877 | 99,396 | 71,660 | |||||||||||||||
| 142,352 | 132,980 | 417,723 | 341,217 | ||||||||||||||||
Net
income (loss): |
|||||||||||||||||||
TCM raw
materials |
735,555 | 698,271 | 2,414,116 | 2,018,391 | |||||||||||||||
Yew trees
|
375,021 | 233,635 | 1,533,094 | 1,377,984 | |||||||||||||||
Handicrafts
|
31,511 | 12,962 | 48,871 | 31,323 | |||||||||||||||
Other
|
(262,428 | ) | (232,563 | ) | (636,211 | ) | (589,361 | ) | |||||||||||
| $ | 879,659 | $ | 712,305 | $ | 3,359,870 | $ | 2,838,337 | ||||||||||||
| December 31, 2011 |
|||||||||||||||||||||||
|---|---|---|---|---|---|---|---|---|---|---|---|---|---|---|---|---|---|---|---|---|---|---|---|
| TCM raw materials |
Yew trees |
Handicrafts |
Other |
Total |
|||||||||||||||||||
Identifiable
long-lived assets, net |
$ | 14,880,192 | $ | 600,364 | $ | 153,686 | $ | 316,177 | $ | 15,950,419 | |||||||||||||
Expenditures for
segment assets |
$ | 5,515,590 | $ | 61,436 | $ | — | $ | 130,385 | $ | 5,707,411 | |||||||||||||
| September 30, 2012 |
|||||||||||||||||||||||
|---|---|---|---|---|---|---|---|---|---|---|---|---|---|---|---|---|---|---|---|---|---|---|---|
| TCM raw materials |
Yew trees |
Handicrafts |
Other |
Total |
|||||||||||||||||||
Identifiable
long-lived assets, net |
$ | 14,687,708 | $ | 739,908 | $ | 130,936 | $ | 314,170 | $ | 15,872,722 | |||||||||||||
Expenditures for
segment assets |
$ | 65,749 | $ | 83,098 | $ | — | $ | 125,426 | $ | 274,273 | |||||||||||||
The Company does not allocate any selling, general and
administrative expenses to its reportable segments because these activities are managed at a corporate level and not allocable to any segment.
Accordingly, depreciation, interest expense or net income by segment is not reported. The Company’s operations are located in the PRC. All
revenues are derived from customers in the PRC. All of the Company’s operating assets are located in the PRC.
F-49
YEW BIO-PHARM GROUP, INC. AND SUBSIDIARIES
NOTES TO UNAUDITED CONSOLIDATED FINANCIAL STATEMENTS
September 30, 2012
NOTES TO UNAUDITED CONSOLIDATED FINANCIAL STATEMENTS
September 30, 2012
NOTE 15 — COMMITMENTS AND
CONTINGENCIES
Operating lease
On March 20, 2002, the Company leased office space in the
A’cheng district in Harbin (the “A’cheng Lease”). The A’cheng Lease is for a term of 23 years and expires on March 19, 2025.
Pursuant to the A’cheng Lease, lease payment shall be made as follows:
| Year |
Annual lease amount |
Payment due date |
||||||||
|---|---|---|---|---|---|---|---|---|---|---|
March
2002 to February 2012 |
RMB 25,000 |
Before December 2012 |
||||||||
March
2012 to February 2017 |
RMB 25,000 |
Before December 2017 |
||||||||
March
2017 to March 2025 |
RMB 25,000 |
Before December 2025 |
||||||||
For the three months ended September 30, 2012 and 2011, rent
expense related to the A’cheng Lease amounted $987 and $973, respectively. For the nine months ended September 30, 2012 and 2011, rent expense
related to the A’cheng Lease amounted $2,963 and $2,882, respectively.
Future minimum rental payments required under the A’cheng
Lease are as follows:
| Twelve-month periods ending September 30: |
||||||
|---|---|---|---|---|---|---|
2013
|
$ | 3,947 | ||||
2014
|
3,947 | |||||
2015
|
3,947 | |||||
2016
|
3,947 | |||||
2017
|
3,947 | |||||
Thereafter |
29,438 | |||||
Total
|
$ | 49,173 |
See Note 11 for related party operating lease
commitments.
Seedling Purchase and Sale Long-Term Cooperation
Agreement
On November 25, 2010, HDS entered into a Seedling Purchase and
Sale Long-Term Cooperation Agreement (the “Seedling Agreement”) with Wuchang City Xinlin Foresty Co., Ltd (“Xinlin”), pursuant to
which HDS will sell yew seedlings to Xinlin at a price equal to 90% of HDS’s publicly-published wholesale prices. Xinlin has agreed to purchase
from the Company 10,000 yew seedlings annually. The Company did not make sales under the Seedling Agreement for the three and nine months ended
September 30, 2012. For the three and nine months ended September 30, 2011, the Company made sales of $0 and $311,158, respectively, under the Seedling
Agreement.
Land Use Rights and Yew Forest Purchase
On March 4, 2010, the Company entered into Land Use Right and
Seedling Transfer Agreement with Heilongjiang Pingshan Yew Comprehensive Development Co., Ltd., pursuant to which the Company acquired land use rights
with an area of 15,865 mu and all yew trees and seedlings situated on such land, for an aggregate cost of RMB 80,152,900 (approximately $12,500,000).
The purchase price was divided into three installments, each installment representing a parcel of land and the Company paid final installment in full
during the nine months ended September 30, 2012. As of September 30, 2012, there was no unpaid amount related to the Land Use Right and Seedling
Transfer Agreement.
F-50
YEW BIO-PHARM GROUP, INC. AND SUBSIDIARIES
NOTES TO UNAUDITED CONSOLIDATED FINANCIAL STATEMENTS
September 30, 2012
NOTES TO UNAUDITED CONSOLIDATED FINANCIAL STATEMENTS
September 30, 2012
Land Use Right
On July 18, 2012, the Company entered into the Fuye Field
Agreement with an individual in the PRC. Pursuant to the Fuye Field Agreement, HDS leases 117.5 mu (approximately 19.6 acres) located at Fuye Field,
Beizhao Village, Hongxing Town, A’cheng District in Helongjiang Province, PRC. The term of the Fuye Field Agreement is 16 years, through March
2028. During the term of the Fuye Field Agreement, HDS has the right to develop the property for the production of yew trees. In addition, HDS acquired
a building and more than 80,000 trees — which are not yew trees — located on the property.
Payments to be made by the Company under the Fuye Field Agreement
total RMB 15,002,300, payable as follows:
• |
RMB 6,300,000 upon receipt by HDS of all related supporting documents and materials on the ownership and land use right of the property; |
• |
RMB 3,700,000 on December 25, 2012; |
• |
RMB 5,002,300 on or before December 25, 2013. |
The Company paid RMB 9,330,000 (approximately $1.5 million) as of
September 30, 2012 and the unpaid amount related to the Fuye Field Agreement was RMB 5,672,300 (approximately $0.9 million) as of September 30, 2012
which was included in accounts payable on the accompanying consolidated balance sheets. The Company presently expects to be able to make the additional
payments required by the Fuye Field Agreement from cash-on-hand and net cash flow from operations.
Options
Generally, the founders of a corporation in the United States
receive shares of stock in consideration of the tangible and intangible assets contributed by them to the enterprise. Since the consideration for those
shares is the transfer of assets, including intellectual property, and business know-how, sometimes referred to as “sweat equity”, no payment
for such shares occurs.
However, unfamiliar with the usual way that founders acquire
equity interests in corporations in the United States, the HDS Shareholders actually purchased their HDS Shareholders’ Stock between March 2008
and September 2009, for cash, in a series of four different offerings of YBP Common Stock during that period, at prices ranging between $0.02 and $0.10
per share, for an aggregate purchase price of $890,501.
As a result of the Contractual Arrangements of the Second
Restructure, in which all of the profits of HDS will be paid under the terms of the Business Cooperation Agreement to JSJ, which is an indirect
wholly-owned subsidiary of YBP, combined with the actual purchase by the HDS Shareholders of the HDS Shareholders’ Stock for cash, it could be
viewed that Mr. Wang, Madame Qi and Mr. Han have, in effect, paid for their HDS Shareholders’ Stock twice.
Accordingly, it is the intention of the Company to rectify this
situation by issuing a stock purchase option (a “Founder’s Option”) to each of Mr. Wang, Madame Qi and Mr. Han in an amount equal to the
number of shares of YBP Common Stock that each of them currently owns. The terms of each Founder’s Option will be identical to each other except
for the name of the optionee and the number of shares of YBP Common Stock subject to each such Founder’s Option. Those terms
include:
• |
The issuance of the Founder’s Option will be subject to pre-issuance approval by our shareholders as described below; |
• |
Each Founder’s Option will be fully vested upon issuance; |
• |
Each Founder’s Option may be exercised only upon the approval by the YBP shareholders of an amendment to YBP’s Articles of Incorporation increasing the number of shares of authorized |
F-51
YEW BIO-PHARM GROUP, INC. AND SUBSIDIARIES
NOTES TO UNAUDITED CONSOLIDATED FINANCIAL STATEMENTS
September 30, 2012
NOTES TO UNAUDITED CONSOLIDATED FINANCIAL STATEMENTS
September 30, 2012
| Common Stock and the filing of an amendment of the Articles of Incorporation with the Secretary of State of Nevada; |
• |
Each Founder’s Option will be exercisable for a period of five years; |
• |
Each Founder’s Option will have a per share exercise price of equal to the fair market value of a share of YBP common stock on the date of grant; and |
• |
Each Founder’s Option will have a cashless exercise feature, pursuant to which, at the optionee’s election, he or she may choose to deliver previously-owned shares of YBP common stock in payment of the exercise price or not pay the exercise price of the Founder’s Option and receive instead a reduced number of shares of YBP common stock reflecting the value of the number of shares of YBP common stock equal to the difference, if any, between the aggregate fair market value of the shares issuable upon exercise of the Founder’s Option and the exercise price of the Founder’s Option. |
The Company has scheduled a special meeting of shareholders (the
“Meeting”) to be held on December 13, 2012 to approve the Founders’ Options, among other proposals to be brought before the Meeting.
Shareholders of record as of the record date of October 18, 2012 will be entitled to vote at the Meeting.
Assuming the options are approved by the shareholders of the
Company, the options will be valued on the date of grant using the Black-Scholes option pricing model, using the expected and implied volatility from
its peer companies’ volatilities as the Company itself does not have historical trading history, expected dividends yield of 0%, expected term of
5 years and risk-free interest rate on the date of grant. The value of the options granted will be immediately recognized as the Company’s
compensation expenses upon the issuance of the options. The number of shares of YBP Common Stock subject to each Founder’s Option is as
follows:
| Name of Optionee |
Number of Shares Subject to Option |
|||||||||
|---|---|---|---|---|---|---|---|---|---|---|
Zhioguo Wang |
20,103,475 | |||||||||
Guifang Qi |
2,488,737 | |||||||||
Xingming Han |
213,300 | |||||||||
The terms of the Founder’s Option have not been determined
as a result of arm’s-length negotiations. The Board of Directors of YBP, which consists of the same persons who are the HDS Shareholders and the
grantees of the Founder’s Option, may seek shareholder approval or ratification of the issuance of the Founder’s Options.
To the extent that the Founder’s Options are exercised,
assuming they are granted as described above, the number of shares to YBP Common Stock then held by each HDS Shareholder could as much double, which
would be highly dilutive to the other existing YBP shareholders. The following chart shows the maximum effect of this dilution assuming full exercise
of each Founder’s Option for cash:
| Shareholder |
Number Shares Presently Held |
Percentage of Issued Shares Presently Held |
Number Shares Held Assuming Exercise of Founder’s Options |
Percentage of Issued Shares Following Exercise of Founder’s Options |
||||||||||||||||||
|---|---|---|---|---|---|---|---|---|---|---|---|---|---|---|---|---|---|---|---|---|---|---|
Zhiguo Wang
|
20,103,475 | 40.50 | % | 40,206,950 | 55.23 | % | ||||||||||||||||
Guifang Qi
|
2,488,737 | 4.98 | % | 4,977,474 | 6.84 | % | ||||||||||||||||
Xingming Han
|
213,300 | 0.43 | % | 426,600 | 0.58 | % | ||||||||||||||||
All HDS
Shareholders as a group (3 persons) |
22,805,512 | 45.61 | % | 45,611,024 | 62.65 | % | ||||||||||||||||
All other
existing shareholders |
27,194,488 | 54.39 | % | 27,194,488 | 37.35 | % | ||||||||||||||||
Total
|
50,000,000 | 100.00 | % | 72,805,512 | 100.00 | % | ||||||||||||||||
F-52
YEW BIO-PHARM GROUP, INC. AND SUBSIDIARIES
NOTES TO UNAUDITED CONSOLIDATED FINANCIAL STATEMENTS
September 30, 2012
NOTES TO UNAUDITED CONSOLIDATED FINANCIAL STATEMENTS
September 30, 2012
NOTE 16 — JOINT VENTURE AGREEMENT FOR PLANTING OF YEW
TREES
On March 21, 2004, HDS entered into a Joint Venture Planting
Agreement (the “Joint Venture Agreement”) with Wuchang City Forestry Bureau (the “Forest Bureau”), pursuant to which the Forest
Bureau has given HDS access to 1,000,000 mu of forest land located in Wuchang City to develop yew tree forests and produce yew seedlings. Pursuant to
the Joint Venture Agreement, the Company is required to plant yew trees on this land from 2004 to 2034. Any profits from the planting of yew trees and
other agriculture shall be distributed 80% to the Company and 20% to the Forest Bureau. For the nine months ended September 30, 2012 and 2011, the
Company has not generated any revenues or activity on this land.
NOTE 17 — RECENT ACCOUNTING
PRONOUCEMENTS
In July 2012, the Financial Accounting Standards Board (FASB)
amended ASC 350, “Intangibles — Goodwill and Other”. This amendment is intended to simplify how an entity tests indefinite-lived
assets other than goodwill for impairment by providing entities with an option to perform a qualitative assessment to determine whether further
impairment testing is necessary. The amended provisions will be effective for the Company beginning in the first quarter of 2014, and early adoption is
permitted. This amendment impacts impairment testing steps only, and therefore adoption will not have an impact on the Company’s consolidated
financial position, results of operations or cash flows.
In August 2012, the FASB issued Accounting Standards Update
(“ASU”) 2012-03, “Technical Amendments and Corrections to SEC Sections: Amendments to SEC Paragraphs Pursuant to SEC Staff Accounting
Bulletin (SAB) No. 114, Technical Amendments Pursuant to SEC Release No. 33-9250, and Corrections Related to FASB Accounting Standards Update 2010-22
(SEC Update)” in Accounting Standards Update No. 2012-03. This update amends various SEC paragraphs pursuant to the issuance of SAB No. 114. The
adoption of ASU 2012-03 is not expected to have a material impact on financial position or results of operations of the Company.
In October 2012, the FASB issued ASU 2012-04, “Technical
Corrections and Improvements” in Accounting Standards Update No. 2012-04 (“ASU 2012-04”). The amendments in this update cover a wide
range of topics in the Accounting Standards Codification. These amendments include technical corrections and improvements to the Accounting Standards
Codification and conforming amendments related to fair value measurements. The amendments in this update will be effective for fiscal periods beginning
after December 15, 2012. The adoption of ASU 2012-04 is not expected to have a material impact on financial position or results of operations of the
Company.
F-53
16,500,000 Shares of Common Stock
YEW BIO PHARM GROUP, INC.
PROSPECTUS
YOU SHOULD RELY ONLY ON THE INFORMATION CONTAINED IN THIS DOCUMENT OR THAT WE HAVE REFERRED YOU TO. WE HAVE NOT AUTHORIZED ANYONE TO PROVIDE
YOU WITH INFORMATION THAT IS DIFFERENT. THIS PROSPECTUS IS NOT AN OFFER TO SELL COMMON STOCK AND IS NOT SOLICITING AN OFFER TO BUY COMMON STOCK IN ANY
STATE WHERE THE OFFER OR SALE IS NOT PERMITTED.
Until
, all dealers that effect transactions in these securities whether or not participating in
this offering may be required to deliver a prospectus. This is in addition to the dealer’s obligation to deliver a prospectus when acting as
underwriters and with respect to their unsold allotments or subscriptions.
The Date of This Prospectus is __________,
2012
PART II
INFORMATION NOT REQUIRED IN THE
PROSPECTUS
Item 13. Other Expenses and Issuance and
Distribution
The following table sets forth the
costs and expenses, other than underwriting discounts and commissions, if any, payable by the Registrant relating to the sale of securities being
registered.
Securities
and Exchange Commission registration fee |
$ | 562.55 | ||||
Federal Taxes
|
$ | 0 | ||||
State Taxes
and Fees |
$ | 0 | ||||
Transfer
Agent Fees |
$ | 20,800.00 | ||||
Accounting
fees and expenses |
$ | 2,000.00 | ||||
Legal fees
and expense |
$ | 25,000.00 | ||||
Blue Sky fees
and expenses |
$ | 4,900.00 | ||||
Miscellaneous
|
$ | 0 | ||||
Total
|
$ | 53,262.55 |
All amounts are estimates other than
the SEC’s registration fee. We are paying all expenses of the offering listed above. No portion of these expenses will be borne by the selling
shareholders. The selling shareholders, however, will pay any other expenses incurred in selling their common stock, including any brokerage
commissions or costs of sale.
Item 14. Indemnification of Directors and
Officers
Section 78.7502 of the Nevada
Corporation Law (the “NCL”) provides that a corporation may indemnify directors and officers as well as other employees and individuals
against expenses including attorneys’ fees, judgments, fines and amounts paid in settlement in connection with various actions, suits or
proceedings, whether civil, criminal, administrative or investigative other than an action by or in the right of the corporation, a derivative action,
if they acted in good faith and in a manner they reasonably believed to be in or not opposed to the best interests of the corporation, and, with
respect to any criminal action or proceeding, if they had no reasonable cause to believe their conduct was unlawful. A similar standard is applicable
in the case of derivative actions, except that indemnification only extends to expenses including attorneys’ fees incurred in connection with the
defense or settlement of such actions, and the statute requires court approval before there can be any indemnification where the person seeking
indemnification has been found liable to the corporation. The statute provides that it is not exclusive of other indemnification that may be granted by
a corporation’s articles of incorporation, bylaws, agreement, a vote of stockholders or disinterested directors or otherwise.
The NCL permits a corporation to
provide in its articles of incorporation or bylaws that a director of the corporation shall not be personally liable to the corporation or its
stockholders for monetary damages for breach of fiduciary duty as a director, except for liability for:
• |
any breach of the director’s duty of loyalty to the corporation or its stockholders; |
• |
acts or omissions not in good faith or which involve intentional misconduct or a knowing violation of law; |
• |
payments of unlawful dividends or unlawful stock repurchases or redemptions; or |
• |
any transaction from which the director derived an improper personal benefit. |
As permitted by the NCL, the
Company’s bylaws contain such provisions.
Additionally, the NCL provides that a
corporation may purchase and maintain insurance on behalf of a director, officer, employee or agent of the corporation against liability asserted
against or incurred by such person in any such capacity or arising out of such person’s status as such, whether or not the
corporation
II-1
would have the authority to indemnify such person against such liabilities or expenses. The Company does not currently maintain such insurance.
The Company has not entered into
indemnification agreements with any of its directors and officers.
Item 15. Recent Sales of Unregistered
Securities
In March 2008, YBP sold and issued
27,863,427 shares of common stock at $0.02 per share to 16 persons, all of whom are residents of the PRC (the “2008 Offering”). Of this
amount, 18,063,427 shares of common stock were paid for in cash in the aggregate amount of $361,269; and 9,800,000 shares of common stock were
subscribed but not paid for and were subsequently cancelled by YBP in May 2010.
In January 2009, YBP sold and issued
12,116,428 shares of common stock at $0.05 per share to 488 persons, all of whom are residents of the PRC, for gross and net proceeds in cash of
$605,821.
In May 2009, YBP sold and issued
9,820,145 shares of common stock at $0.10 per share to 442 persons, all of whom are residents of the PRC, for gross and net proceeds in cash of
$982,015.
From July 27, 2009 through September
30, 2009, YBP offered 10,000,000 shares of common stock at $0.10 per share to 63 persons, all but one of whom are residents of the PRC (the “2009
Summer Offering”), for gross and net proceeds in cash of $1,000,000. However, at the time of the Summer 2009 Offering, YBP did not have a
sufficient number of authorized and unissued shares of common stock to issue such shares because the 9,800,000 shares referred to above in the 2008
Offering had not yet been cancelled. YBP retained the subscription proceeds but did not issue any of the shares of common stock subscribed for in the
2009 Summer Offering.
Subsequently, YBP and one person, a
resident of the United States, entered into an agreement dated November 1, 2010 (the “Consultant’s Agreement”), pursuant to which that
person agreed to accept 500,000 of these shares as compensation for consulting services rendered by him to the Company instead of subscribing for
2,000,000 of these shares as had been originally intended in the 2009 Summer Offering.
In March 2012, the balance of 9,500,000
shares of YBP common stock from the 2009 Summer Offering were the subject of a rescission offering (the “Rescission Offering”) made to the
remaining 62 subscribers in the Summer 2009 Offering, all of whom are residents of the PRC. In the Rescission Offering, all the subscribers in the 2009
Summer Offering confirmed their subscriptions for an aggregate 9,500,000 shares of YBP common stock (the “Confirming Subscribers”) and no
subscribers in the 2009 Summer Offering elected to rescind their subscriptions and receive a refund of their respective subscription amounts. The
500,000 shares of YBP common stock were issued to the consultant under the Consultant’s Agreement and the 9,500,000 shares were issued to the
Confirming Subscribers.
The Company sold all of these shares of
common stock under the exemption from registration provided by Section 4(2) of the Securities Act or Regulation D or Regulation S promulgated
thereunder.
Item 16. Exhibits.
| Exhibit No. |
Description |
|||||
|---|---|---|---|---|---|---|
3.1(1) |
Articles of Incorporation of Yew Bio-Pharm Group, Inc. |
|||||
3.2(1) |
Certificate of Amendment of Articles of Incorporation of Yew Bio-Pharm Group, Inc. dated May 19, 2010 |
|||||
3.3* |
Certificate of Amendment of Articles of Incorporation of Yew Bio-Pharm Group, Inc. dated December 18, 2012 |
|||||
3.4(1) |
Bylaws of Yew Bio-Pharm Group, Inc. |
|||||
4.1(1) |
Equity Transfer Agreement dated February 23, 2010 between Heilongjiang Jinshangjing Bio-Technology Development Co., Limited and Zhiguo
Wang |
|||||
4.2(1) |
Equity Transfer Agreement dated February 23, 2010 between Heilongjiang Jinshangjing Bio-Technology Development Co., Limited and Guifang
Qi |
|||||
II-2
| Exhibit No. |
Description | |||||
|---|---|---|---|---|---|---|
4.3(1) |
Equity Transfer Agreement dated February 23, 2010 between Heilongjiang Jinshangjing Bio-Technology Development Co., Limited and Xingming
Han |
|||||
4.4(1) |
Equity Transfer Agreement dated February 23, 2010 between Heilongjiang Jinshangjing Bio-Technology Development Co., Limited and Heilongjiang
Ecology Stock Co. Ltd. |
|||||
4.5(1) |
Equity Transfer Agreement dated February 23, 2010 between Heilongjiang Jinshangjing Bio-Technology Development Co., Limited and Yingjun
Jiang |
|||||
4.6(1) |
Supplemental Agreement to Equity Transfer Agreement dated February 23, 2010 among Mr. Wang, Madame Qi, Mr. Han, Heilongjiang Ecology Forest
Co. Ltd. and Yingjun Jiang |
|||||
4.7(1) |
Debtor’s and Creditors’ Rights Transfer Agreement dated May 10, 2010 among Mr. Wang, Heilongjiang Ecology Stock Co. Ltd., Yingjun
Jiang and Heilongjiang Jinshangjing Bio-Technology Development Co., Limited |
|||||
4.8(1) |
Equity Transfer Agreement dated October 28, 2010 between Heilongjiang Jinshangjing Bio-Technology Development Co., Limited and Zhiguo
Wang |
|||||
4.9(1) |
Equity Transfer Agreement dated October 28, 2010 between Heilongjiang Jinshangjing Bio-Technology Development Co., Limited and Guifang
Qi |
|||||
4.10(1) |
Equity Transfer Agreement dated October 28, 2010 between Heilongjiang Jinshangjing Bio- Technology Development Co., Limited and Xingming
Han |
|||||
4.11(1) |
Supplemental Agreement to Equity Transfer Agreement dated February 16, 2011 among Heilongjiang Jinshangjing Bio-Technology Development Co.,
Limited, Zhiguo Wang, Guifang Qi and Xingming Han |
|||||
4.12(1) |
Exclusive Business Cooperation Agreement dated November 5, 2010 between Heilongjiang Jinshangjing Bio-Technology Development Co., Limited and
Harbin Hongdoushan Science and Technology Development Co., Ltd. |
|||||
4.13(1) |
Exclusive Option Agreement dated November 5, 2010 among Heilongjiang Jinshangjing Bio-Technology Development Co., Limited, Harbin Hongdoushan
Science and Technology Development Co., Ltd. and Zhiguo Wang |
|||||
4.14(1) |
Exclusive Option Agreement dated November 5, 2010 among Heilongjiang Jinshangjing Bio-Technology Development Co., Limited, Harbin Hongdoushan
Science and Technology Development Co., Ltd. and Guifang Qi |
|||||
4.15(1) |
Exclusive Option Agreement dated November 5, 2010 among Heilongjiang Jinshangjing Bio-Technology Development Co., Limited, Harbin Hongdoushan
Science and Technology Development Co., Ltd. and Xingming Han |
|||||
4.16(1) |
Equity Interest Pledge Agreement dated November 5, 2010 among Heilongjiang Jinshangjing Bio-Technology Development Co., Limited, Harbin
Hongdoushan Science and Technology Development Co., Ltd. and Zhiguo Wang |
|||||
4.17(1) |
Equity Interest Pledge Agreement dated November 5, 2010 among Heilongjiang Jinshangjing Bio-Technology Development Co., Limited, Harbin
Hongdoushan Science and Technology Development Co., Ltd. and Guifang Qi |
|||||
4.18(1) |
Equity Interest Pledge Agreement dated November 5, 2010 among Heilongjiang Jinshangjing Bio-Technology Development Co., Limited, Harbin
Hongdoushan Science and Technology Development Co., Ltd. and Xingming Han |
|||||
4.19(1) |
Power of Attorney dated November 5, 2010 — Zhiguo Wang |
|||||
4.20(1) |
Power of Attorney dated November 5, 2010 — Guifang Qi |
|||||
4.21(1) |
Power of Attorney dated November 5, 2010 — Xingming Han |
|||||
5.1* |
Opinion of SEC Law Firm |
|||||
II-3
| Exhibit No. |
Description | |||||
|---|---|---|---|---|---|---|
10.1(1) |
Cooperation and Development Contract of Yew (taxus) Yinpian dated January 9, 2010 between Harbin Yew Science and Technology Development Co.,
Ltd. and Heilongjiang Yew Pharmaceutical Co., Ltd. |
|||||
10.2(1) |
Technology Development Services Agreement dated January 1, 2010 between Harbin Yew Science and Technology Development Co., Ltd. and Shanghai
Kairun Bio-Pharmaceutical Co., Ltd. |
|||||
10.3(1) |
Technology Development Services Supplementary Agreement dated February 2, 2012 between Harbin Yew Science and Technology Development Co., Ltd.
and Shanghai Kairun Bio-Pharmaceutical Co., Ltd. |
|||||
10.4+(1) |
Labor Contract effective May 9, 2009 between Harbin Yew Science and Technology Development Co., Ltd. and Zhiguo Wang |
|||||
10.5+(1) |
Labor Contract effective April 9, 2009 between Harbin Yew Science and Technology Development Co., Ltd. and Xingming Han |
|||||
10.6+(1) |
Labor Contract effective April 9, 2009 between Harbin Yew Science and Technology Development Co., Ltd. and Guifang Qi |
|||||
10.7+(1) |
Engagement Agreement dated August 24, 2011 between Yew Bio-Pharm Group, Inc. and CFO On Call Asia, Inc. |
|||||
10.8(1) |
Consulting Agreement dated November 1, 2010 between Yew Bio-Pharm Group, Inc. and Richard Lo |
|||||
10.9(1) |
Joint-Stock Construct Rare Plant Northeast Yew Contract dated March 21, 2004 between Harbin Yew Science and Technology Development Co., Ltd.
and Wuchang City Forestry Bureau |
|||||
10.10(1) |
Waste Forest Land Transfer Agreement dated March 22, 2004 between Harbin Yew Science and Technology Development Co., Ltd. and Chengshan
Niu |
|||||
10.11(1) |
Barren Hills and Uncultivated Land Use Right Transfer Agreement dated April 4, 2004 between Harbin Yew Science and Technology Development Co.,
Ltd. and Pingshan Town Government |
|||||
10.12(1) |
Contract for Seedling Land dated March 25, 2005 between Harbin Yew Science and Technology Development Co., Ltd. and Heilongjiang Yew
Technology Stock Co. |
|||||
10.13(1) |
Contract for the Transfer of Forest Land Use Right and of the Ownership of Timbers dated January 18, 2008 among Harbin Yew Science and
Technology Development Co., Ltd., Shukun Jiang and Shubao Jiang |
|||||
10.14(1) |
Yew
Planting Seedlings Transfer Contract dated March 4, 2010 between Harbin Yew Science and Technology Development Co., Ltd. and Heilongjiang Pingshan Yew
Comprehensive Development Co., Ltd. |
|||||
10.15(1) |
Lease Contract dated March 20, 2002 between Harbin Yew Science and Development Technology Co., Ltd. and Heilongjiang Pingshan Yew
Comprehensive Development Co., Ltd. |
|||||
10.16(1) |
Lease Contract dated December 3, 2008 between Harbin Yew Science and Technology Development Co., Ltd. and Guifang Qi |
|||||
10.17(1) |
Lease Contract dated November 15, 2011 between Harbin Yew Science and Technology Development Co., Ltd. and Guifang Qi |
|||||
10.18(1) |
Lease Contract dated January 1, 2010 between Harbin Yew Science and Technology Development Co., Ltd. and Zhiguo Wang |
|||||
10.19+(1) |
Labor Contract effective April 10, 2012 between Harbin Yew Science and Technology Development Co., Ltd. and Xingming Han |
|||||
10.20+(1) |
Labor Contract effective April 10, 2012 between Harbin Yew Science and Technology Development Co., Ltd. and Guifang Qi |
|||||
10.21+(2) |
Labor Contract effective May 10, 2012 between Harbin Yew Science and Technology Development Co., Ltd. and Zhiguo Wang |
|||||
II-4
| Exhibit No. |
Description | |||||
|---|---|---|---|---|---|---|
10.22(3) |
Forest Transfer Contract for Fuye Field, Beizhao Village, Hongxing Town, Acheng District |
|||||
10.23(4) |
Founder’s Option dated December 13, 2012 issued to Zhiguo Wang |
|||||
10.24(4) |
Founder’s Option dated December 13, 2012 issued to Guifang Qi |
|||||
10.25(4) |
Founder’s Option dated December 13, 2012 issued to Xingming Han |
|||||
21** |
List
of subsidiaries |
|||||
23.1* |
Consent of Albert Wong & Co. |
|||||
23.2* |
Consent of SEC Law Firm |
|||||
24** |
Power of Attorney (included on signature page) |
|||||
+ |
Management compensatory agreement |
* |
Filed herewith |
** |
Previously filed |
(1) |
Incorporated by reference from the Company’s registration statement on Form 10 filed with the SEC on May 8, 2012. |
(2) |
Incorporated by reference from Amendment No. 1 to the Company’s registration statement on Form 10/A filed with the SEC on June 29, 2012. |
(3) |
Incorporated by reference from the Company’s Current Report on Form 8-K filed with the SEC on July 24, 2012. |
(4) |
Incorporated by reference from the Company’s Current Report on Form 8-K filed with the SEC on December 19, 2012. |
Item 17. Undertakings.
The undersigned registrant hereby
undertakes:
(1) |
To file, during any period in which offers or sales are being made, a post-effective amendment to this registration statement: |
i. |
To include any prospectus required by section 10(a)(3) of the Securities Act of 1933; |
ii. |
To reflect in the prospectus any facts or events arising after the effective date of the registration statement (or the most recent post-effective amendment thereof) which, individually or in the aggregate, represent a fundamental change in the information set forth in the registration statement. Notwithstanding the foregoing, any increase or decrease in volume of securities offered (if the total dollar value of securities offered would not exceed that which was registered) and any deviation from the low or high end of the estimated maximum offering range may be reflected in the form of prospectus filed with the Commission pursuant to Rule 424(b) if, in the aggregate, the changes in volume and price represent no more than 20% change in the maximum aggregate offering price set forth in the “Calculation of Registration Fee” table in the effective registration statement. |
iii. |
To include any material information with respect to the plan of distribution not previously disclosed in the registration statement or any material change to such information in the registration statement; |
(2) |
That, for the purpose of determining any liability under the Securities Act of 1933, each such post-effective amendment shall be deemed to be a new registration statement relating to the securities offered therein, and the offering of such securities at that time shall be deemed to be the initial bona fide offering thereof. |
(3) |
To remove from registration by means of a post-effective amendment any of the securities being registered which remain unsold at the termination of the offering. |
II-5
(4) |
Insofar as indemnification for liabilities arising under the Securities Act of 1933 may be permitted to directors, officers and controlling persons of the registrant pursuant to the foregoing provisions, or otherwise, the registrant has been advised that in the opinion of the Securities and Exchange Commission such indemnification is against public policy as expressed in the Act and is, therefore, unenforceable. In the event that a claim for indemnification against such liabilities (other than the payment by the registrant of expenses incurred or paid by a director, officer or controlling person of the registrant in the successful defense of any action, suit or proceeding) is asserted by such director, officer or controlling person in connection with the securities being registered, the registrant will, unless in the opinion of its counsel the matter has been settled by controlling precedent, submit to a court of appropriate jurisdiction the question whether such indemnification by it is against public policy as expressed in the Act and will be governed by the final adjudication of such issue. |
(5) |
Each prospectus filed pursuant to Rule 424(b) as part of a registration statement relating to an offering, other than registration statements relying on Rule 430B or other than prospectuses filed in reliance on Rule 430A, shall be deemed to be part of and included in the registration statement as of the date it is first used after effectiveness. Provided, however, that no statement made in a registration statement or prospectus that is part of the registration statement or made in a document incorporated or deemed incorporated by reference into the registration statement or prospectus that is part of the registration statement will, as to a purchaser with a time of contract of sale prior to such first use, supersede or modify any statement that was made in the registration statement or prospectus that was part of the registration statement or made in any such document immediately prior to such date of first use. |
(6) |
That, for the purpose of determining liability of the registrant under the Securities Act of 1933 to any purchaser in the initial distribution of the securities: The undersigned registrant undertakes that in a primary offering of securities of the undersigned registrant pursuant to this registration statement, regardless of the underwriting method used to sell the securities to the purchaser, if the securities are offered or sold to such purchaser by means of any of the following communications, the undersigned registrant will be a seller to the purchaser and will be considered to offer or sell such securities to such purchaser: |
i. |
Any preliminary prospectus or prospectus of the undersigned registrant relating to the offering required to be filed pursuant to Rule 424; |
ii. |
Any free writing prospectus relating to the offering prepared by or on behalf of the undersigned registrant or used or referred to by the undersigned registrant; |
iii. |
The portion of any other free writing prospectus relating to the offering containing material information about the undersigned registrant or its securities provided by or on behalf of the undersigned registrant; and |
iv. |
Any other communication that is an offer in the offering made by the undersigned registrant to the purchaser. |
II-6
Pursuant to the requirements of the
Securities Act of 1933, the registrant has duly caused this registration statement to be signed on its behalf by the undersigned, thereunto duly
authorized, in the City of Harbin, People’s Republic of China, on January 23, 2013.
Yew Bio-Pharm Group, Inc. |
|||||||||||
By: |
/s/ Zhiguo Wang |
||||||||||
Zhiguo Wang Chief Executive Officer (Principal Executive Officer) |
|||||||||||
By: |
/s/ Adam Wasserman |
||||||||||
Adam Wasserman Chief Financial Officer (Principal Accounting Officer) |
|||||||||||
POWER OF ATTORNEY
The officers and directors of Save the
World Air, Inc., whose signatures appear below, hereby constitute and appoint Zhiguo Wang and Xingming Han, and each of them, their true and lawful
attorneys and agents, each with power to act alone, to sign, execute and cause to be filed on behalf of the undersigned any amendment or amendments,
including post-effective amendments, to this registration statement of Yew Bio-Pharm Group, Inc. on Form S-1. Each of the undersigned does hereby
ratify and confirm all that said attorneys and agents shall do or cause to be done by virtue hereof.
Pursuant to the requirements of the
Securities Act of 1933, this registration statement has been signed by the following persons in the capacities and on the dates
indicated.
| Name |
Title |
Date |
|||||||||
|---|---|---|---|---|---|---|---|---|---|---|---|
/s/
Zhiguo Wang Zhiguo Wang |
Chief Executive Officer, President, Secretary and Chairman of the Board (Principal Executive Officer) |
January 23, 2013 |
|||||||||
/s/
Adam Wasserman Adam Wasserman |
Chief Financial Officer (Principal Accounting Officer) |
January 23, 2013 |
|||||||||
/s/
Guifang Qi* Guifang Qi |
Treasurer — Yew Bio-Pharm Group, Inc. and Director |
January 23, 2013 |
|||||||||
/s/
Xingming Han* Xingming Han |
General Manager — Harbin Yew Science and Technology Development Co., Ltd. and Director |
January 23, 2013 |
|||||||||
*By:
/s/ Zhiguo Wang Zhiguo Wang Attorney-in-fact |
|||||||||||
II-7
| Exhibit No. |
Description |
|||||
|---|---|---|---|---|---|---|
3.1(1) |
Articles of Incorporation of Yew Bio-Pharm Group, Inc. |
|||||
3.2(1) |
Certificate of Amendment of Articles of Incorporation of Yew Bio-Pharm Group, Inc. dated May 19, 2010 |
|||||
3.3* |
Certificate of Amendment of Articles of Incorporation of Yew Bio-Pharm Group, Inc. dated December 18, 2012 |
|||||
3.4(1) |
Bylaws of Yew Bio-Pharm Group, Inc. |
|||||
4.1(1) |
Equity Transfer Agreement dated February 23, 2010 between Heilongjiang Jinshangjing Bio-Technology Development Co., Limited and Zhiguo
Wang |
|||||
4.2(1) |
Equity Transfer Agreement dated February 23, 2010 between Heilongjiang Jinshangjing Bio-Technology Development Co., Limited and Guifang
Qi |
|||||
4.3(1) |
Equity Transfer Agreement dated February 23, 2010 between Heilongjiang Jinshangjing Bio-Technology Development Co., Limited and Xingming
Han |
|||||
4.4(1) |
Equity Transfer Agreement dated February 23, 2010 between Heilongjiang Jinshangjing Bio-Technology Development Co., Limited and Heilongjiang
Ecology Stock Co. Ltd. |
|||||
4.5(1) |
Equity Transfer Agreement dated February 23, 2010 between Heilongjiang Jinshangjing Bio-Technology Development Co., Limited and Yingjun
Jiang |
|||||
4.6(1) |
Supplemental Agreement to Equity Transfer Agreement dated February 23, 2010 among Mr. Wang, Madame Qi, Mr. Han, Heilongjiang Ecology Forest
Co. Ltd. and Yingjun Jiang |
|||||
4.7(1) |
Debtor’s and Creditors’ Rights Transfer Agreement dated May 10, 2010 among Mr. Wang, Heilongjiang Ecology Stock Co. Ltd., Yingjun
Jiang and Heilongjiang Jinshangjing Bio-Technology Development Co., Limited |
|||||
4.8(1) |
Equity Transfer Agreement dated October 28, 2010 between Heilongjiang Jinshangjing Bio-Technology Development Co., Limited and Zhiguo
Wang |
|||||
4.9(1) |
Equity Transfer Agreement dated October 28, 2010 between Heilongjiang Jinshangjing Bio-Technology Development Co., Limited and Guifang
Qi |
|||||
4.10(1) |
Equity Transfer Agreement dated October 28, 2010 between Heilongjiang Jinshangjing Bio-Technology Development Co., Limited and Xingming Han |
|||||
4.11(1) |
Supplemental Agreement to Equity Transfer Agreement dated February 16, 2011 among Heilongjiang Jinshangjing Bio-Technology Development Co.,
Limited, Zhiguo Wang, Guifang Qi and Xingming Han |
|||||
4.12(1) |
Exclusive Business Cooperation Agreement dated November 5, 2010 between Heilongjiang Jinshangjing Bio-Technology Development Co., Limited and
Harbin Hongdoushan Science and Technology Development Co., Ltd. |
|||||
4.13(1) |
Exclusive Option Agreement dated November 5, 2010 among Heilongjiang Jinshangjing Bio-Technology Development Co., Limited, Harbin Hongdoushan
Science and Technology Development Co., Ltd. and Zhiguo Wang |
|||||
4.14(1) |
Exclusive Option Agreement dated November 5, 2010 among Heilongjiang Jinshangjing Bio-Technology Development Co., Limited, Harbin Hongdoushan
Science and Technology Development Co., Ltd. and Guifang Qi |
|||||
4.15(1) |
Exclusive Option Agreement dated November 5, 2010 among Heilongjiang Jinshangjing Bio-Technology Development Co., Limited, Harbin Hongdoushan
Science and Technology Development Co., Ltd. and Xingming Han |
|||||
4.16(1) |
Equity Interest Pledge Agreement dated November 5, 2010 among Heilongjiang Jinshangjing Bio-Technology Development Co., Limited, Harbin
Hongdoushan Science and Technology Development Co., Ltd. and Zhiguo Wang |
|||||
II-8
| Exhibit No. |
Description | |||||
|---|---|---|---|---|---|---|
4.17(1) |
Equity Interest Pledge Agreement dated November 5, 2010 among Heilongjiang Jinshangjing Bio-Technology Development Co., Limited, Harbin
Hongdoushan Science and Technology Development Co., Ltd. and Guifang Qi |
|||||
4.18(1) |
Equity Interest Pledge Agreement dated November 5, 2010 among Heilongjiang Jinshangjing Bio-Technology Development Co., Limited, Harbin
Hongdoushan Science and Technology Development Co., Ltd. and Xingming Han |
|||||
4.19(1) |
Power of Attorney dated November 5, 2010 — Zhiguo Wang |
|||||
4.20(1) |
Power of Attorney dated November 5, 2010 — Guifang Qi |
|||||
4.21(1) |
Power of Attorney dated November 5, 2010 — Xingming Han |
|||||
5.1* |
Opinion of SEC Law Firm |
|||||
10.1(1) |
Cooperation and Development Contract of Yew (taxus) Yinpian dated January 9, 2010 between Harbin Yew Science and Technology Development Co.,
Ltd. and Heilongjiang Yew Pharmaceutical Co., Ltd. |
|||||
10.2(1) |
Technology Development Services Agreement dated January 1, 2010 between Harbin Yew Science and Technology Development Co., Ltd. and Shanghai
Kairun Bio-Pharmaceutical Co., Ltd. |
|||||
10.3(1) |
Technology Development Services Supplementary Agreement dated February 2, 2012 between Harbin Yew Science and Technology Development Co., Ltd.
and Shanghai Kairun Bio-Pharmaceutical Co., Ltd. |
|||||
10.4+(1) |
Labor Contract effective May 9, 2009 between Harbin Yew Science and Technology Development Co., Ltd. and Zhiguo Wang |
|||||
10.5+(1) |
Labor Contract effective April 9, 2009 between Harbin Yew Science and Technology Development Co., Ltd. and Xingming Han |
|||||
10.6+(1) |
Labor Contract effective April 9, 2009 between Harbin Yew Science and Technology Development Co., Ltd. and Guifang Qi |
|||||
10.7+(1) |
Engagement Agreement dated August 24, 2011 between Yew Bio-Pharm Group, Inc. and CFO On Call Asia, Inc. |
|||||
10.8(1) |
Consulting Agreement dated November 1, 2010 between Yew Bio-Pharm Group, Inc. and Richard Lo |
|||||
10.9(1) |
Joint-Stock Construct Rare Plant Northeast Yew Contract dated March 21, 2004 between Harbin Yew Science and Technology Development Co., Ltd.
and Wuchang City Forestry Bureau |
|||||
10.10(1) |
Waste Forest Land Transfer Agreement dated March 22, 2004 between Harbin Yew Science and Technology Development Co., Ltd. and Chengshan
Niu |
|||||
10.11(1) |
Barren Hills and Uncultivated Land Use Right Transfer Agreement dated April 4, 2004 between Harbin Yew Science and Technology Development Co.,
Ltd. and Pingshan Town Government |
|||||
10.12(1) |
Contract for Seedling Land dated March 25, 2005 between Harbin Yew Science and Technology Development Co., Ltd. and Heilongjiang Yew
Technology Stock Co. |
|||||
10.13(1) |
Contract for the Transfer of Forest Land Use Right and of the Ownership of Timbers dated January 18, 2008 among Harbin Yew Science and
Technology Development Co., Ltd., Shukun Jiang and Shubao Jiang |
|||||
10.14(1) |
Yew
Planting Seedlings Transfer Contract dated March 4, 2010 between Harbin Yew Science and Technology Development Co., Ltd. and Heilongjiang Pingshan Yew
Comprehensive Development Co., Ltd. |
|||||
10.15(1) |
Lease Contract dated March 20, 2002 between Harbin Yew Science and Development Technology Co., Ltd. and Heilongjiang Pingshan Yew
Comprehensive Development Co., Ltd. |
|||||
10.16(1) |
Lease Contract dated December 3, 2008 between Harbin Yew Science and Technology Development Co., Ltd. and Guifang Qi |
|||||
II-9
| Exhibit No. |
Description | |||||
|---|---|---|---|---|---|---|
10.17(1) |
Lease Contract dated November 15, 2011 between Harbin Yew Science and Technology Development Co., Ltd. and Guifang Qi |
|||||
10.18(1) |
Lease Contract dated January 1, 2010 between Harbin Yew Science and Technology Development Co., Ltd. and Zhiguo Wang |
|||||
10.19+(1) |
Labor Contract effective April 10, 2012 between Harbin Yew Science and Technology Development Co., Ltd. and Xingming Han |
|||||
10.20+(1) |
Labor Contract effective April 10, 2012 between Harbin Yew Science and Technology Development Co., Ltd. and Guifang Qi |
|||||
10.21+(2) |
Labor Contract effective May 10, 2012 between Harbin Yew Science and Technology Development Co., Ltd. and Zhiguo Wang |
|||||
10.22(3) |
Forest Transfer Contract for Fuye Field, Beizhao Village, Hongxing Town, Acheng District |
|||||
10.23(4) |
Founder’s Option dated December 13, 2012 issued to Zhiguo Wang |
|||||
10.24(4) |
Founder’s Option dated December 13, 2012 issued to Guifang Qi |
|||||
10.25(4) |
Founder’s Option dated December 13, 2012 issued to Xingming Han |
|||||
21** |
List
of subsidiaries |
|||||
23.1* |
Consent of Albert Wong & Co. |
|||||
23.2* |
Consent of SEC Law Firm |
|||||
24** |
Power of Attorney (included on signature page) |
|||||
+ |
Management compensatory agreement |
* |
Filed herewith |
** |
Previously filed |
(1) |
Incorporated by reference from the Company’s registration statement on Form 10 filed with the SEC on May 8, 2012. |
(2) |
Incorporated by reference from Amendment No. 1 to the Company’s registration statement on Form 10/A filed with the SEC on June 29, 2012. |
(3) |
Incorporated by reference from the Company’s Current Report on Form 8-K filed with the SEC on July 24, 2012. |
(4) |
Incorporated by reference from the Company’s Current Report on Form 8-K filed with the SEC on December 19, 2012. |
II-10