Attached files
| file | filename |
|---|---|
| EX-99.1 - EX-99.1 - Woodward, Inc. | d472046dex991.htm |
| EX-99.2 - EX-99.2 - Woodward, Inc. | d472046dex992.htm |
| 8-K - FORM 8-K - Woodward, Inc. | d472046d8k.htm |
Exhibit 99.3

| January 22, 2013 FY 2013 First Quarter Results |
| Today's Agenda Highlights & Market Review Tom GendronFinancial Results & Outlook Bob WeberQ&A 2 |

| Cautionary Statement 3 Information in this conference call and slide presentation contains forward-looking statements within the meaning of the Private Securities Litigation Reform Act of 1995 that involve risks and uncertainties, including, but not limited to, statements regarding future sales, earnings, liquidity, relative profitability, and the impact of economic conditions and downturns on Woodward. Readers are cautioned that these forward-looking statements are only predictions and are subject to risks, uncertainties, and assumptions that are difficult to predict. Factors that could cause actual results and the timing of certain events to differ materially from the forward-looking statements include, but are not limited to, a decline in business with, or financial distress of, our significant customers; instability in the financial markets, sovereign credit rating downgrades and uncertainty surrounding European sovereign and other debt defaults, or other prolonged unfavorable economic and other industry conditions; Woodward's ability to obtain financing, on acceptable terms or at all; Woodward's long sales cycle and implementation period of some of our products and services; Woodward's ability to implement and realize the intended effects of restructuring efforts; Woodward's ability to successfully manage competitive factors; Woodward's ability to manage expenses while responding to sales increases or decreases; the ability of Woodward's subcontractors and suppliers to meet their obligations; the success of, or expenses associated with, Woodward's product development activities; Woodward's ability to integrate acquisitions and manage costs related thereto; Woodward's debt obligations, debt service requirements and ability to operate its business and pursue its business strategies in light of restrictive covenants in its outstanding debt agreements; risks related to U.S. Government contracting activities; reductions in defense sales due to a decrease in the amount of U.S. Federal defense spending; future impairment charges resulting from changes in the estimates of fair value of reporting units or of long-lived assets; future subsidiary results or changes in domestic and international tax statutes; environmental liabilities; Woodward's continued access to a stable workforce and favorable labor relations; the geographical location of a significant portion of our Aerospace business in California, which historically has been susceptible to natural disasters; Woodward's ability to successfully manage regulatory, tax and legal matters; liabilities that may result from legal and regulatory proceedings, inquiries, or investigations by private or U.S. Government persons or entities; risks from operating internationally including the impact on reported earnings from fluctuations in foreign currency exchange rates; fair value of defined benefit plan assets and assumptions used in determining Woodward's retirement pension and other postretirement benefit obligations and related expenses, and other risk factors described in Woodward's Annual Report on Form 10-K for the year ended September 30, 2012 and the Quarterly Report on Form 10-Q for the quarter ended December 31, 2012 which we expect to file shortly. |
| Q1 FY 2013 Fiscal Highlights 4 Net Sales of $408 millionComparable to prior year quarterEarnings of $0.39 per diluted shareCompared to $0.40 last yearEBIT of $45 millionCompared to $46 million last yearFree cash flow of $10 millionUp $25 million YOY |
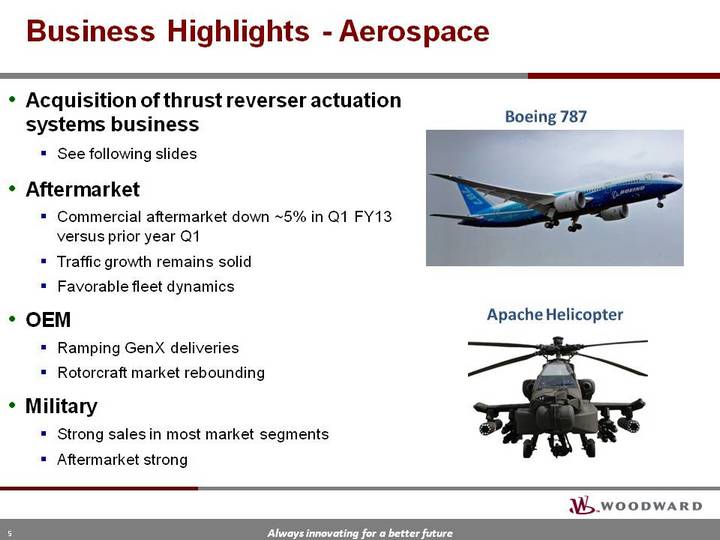
| Business Highlights - Aerospace Acquisition of thrust reverser actuation systems businessSee following slidesAftermarketCommercial aftermarket down ~5% in Q1 FY13 versus prior year Q1Traffic growth remains solidFavorable fleet dynamicsOEMRamping GenX deliveriesRotorcraft market reboundingMilitaryStrong sales in most market segmentsAftermarket strong 5 Apache Helicopter Boeing 787 |

| 6 Integrated Propulsion Systems Future Aerospace trendGreater engine/nacelle/airframe integrationBenefits lmproved fuel burnLower weight and costReduced dragReduced noise and maintenance Variable exhaust nozzle actuation Thrust reverser actuation Cowl door actuation Streamlined nacelle profile Engine accessory placement Product Strategy |
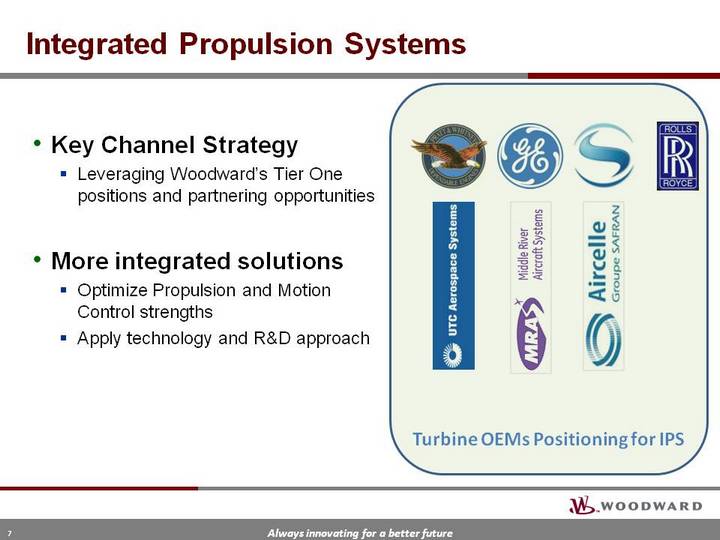
| 7 Integrated Propulsion Systems 777-8X Key Channel StrategyLeveraging Woodward's Tier One positions and partnering opportunitiesMore integrated solutionsOptimize Propulsion and Motion Control strengthsApply technology and R&D approach Turbine OEMs Positioning for IPS |
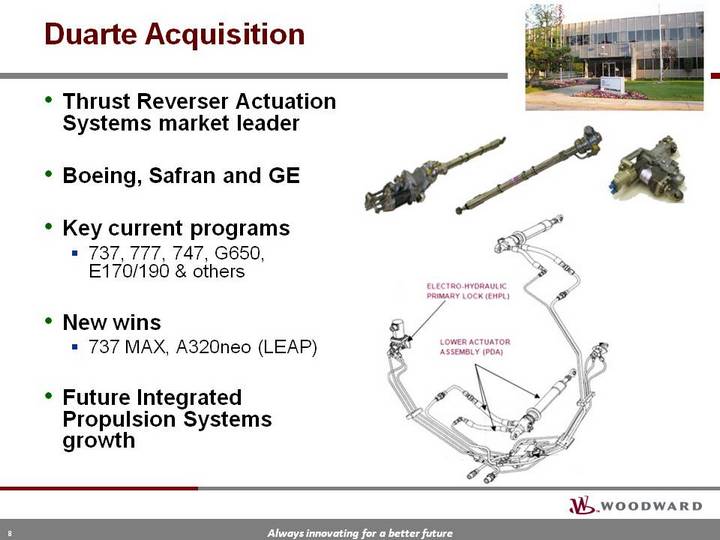
| Duarte Acquisition Thrust Reverser Actuation Systems market leaderBoeing, Safran and GEKey current programs737, 777, 747, G650, E170/190 & othersNew wins737 MAX, A320neo (LEAP)Future Integrated Propulsion Systems growth |
| Business Highlights - Energy Natural GasContinued growth due to availability and pricingUnstable Economic EnvironmentCompanies and governments hesitant to make investments due to riskImpacts large fuel systems where significant investment is requiredRenewable EnergyNorth American wind sales down significantly, as expectedRemain confident in the long-term future 9 |
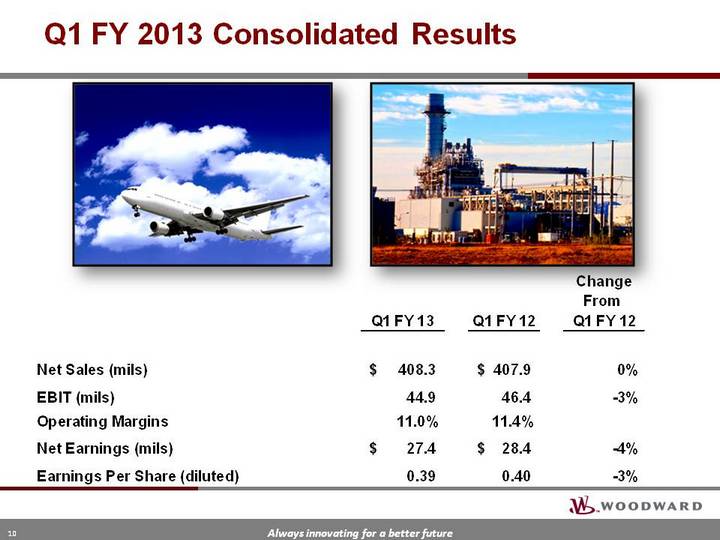
| Q1 FY 2013 Consolidated Results 10 |
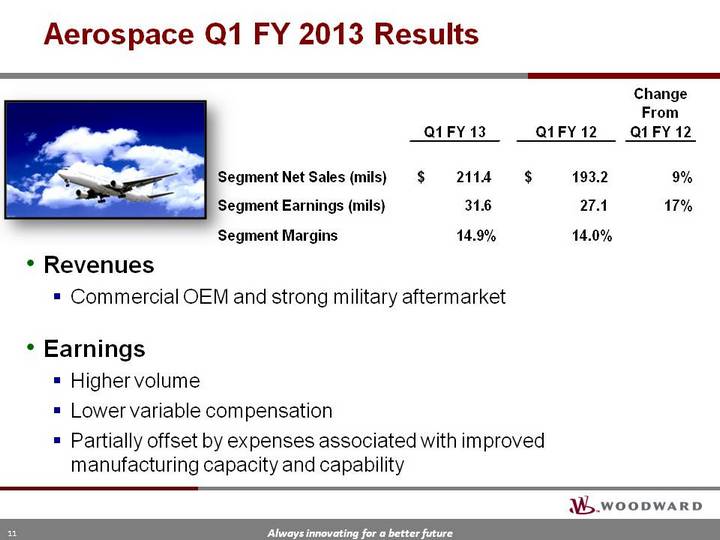
| Aerospace Q1 FY 2013 Results 11 RevenuesCommercial OEM and strong military aftermarketEarningsHigher volume Lower variable compensationPartially offset by expenses associated with improved manufacturing capacity and capability |
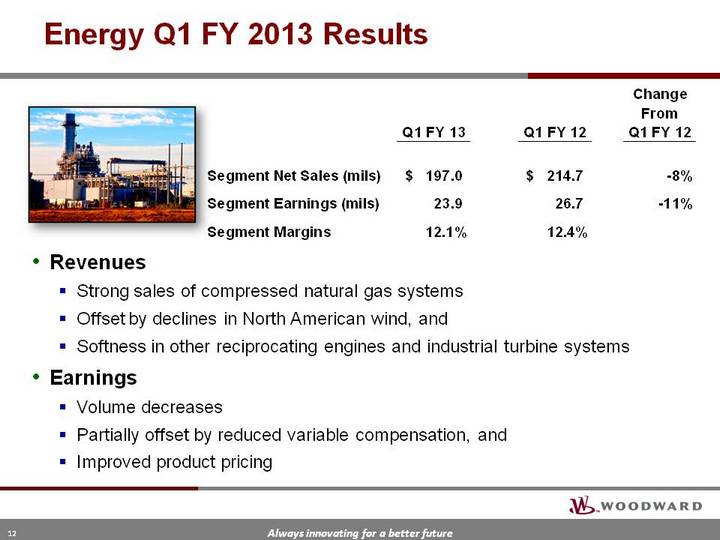
| Energy Q1 FY 2013 Results 12 RevenuesStrong sales of compressed natural gas systemsOffset by declines in North American wind, and Softness in other reciprocating engines and industrial turbine systemsEarningsVolume decreasesPartially offset by reduced variable compensation, and Improved product pricing |

| Selected Financial Items - Q1 FY 2013 13 * Gross margin defined as (Net Sales less Cost of Goods Sold) / (Net Sales);** EBT defined as Net Earnings Before Taxes *** EBITDA reconciliation to Net Earnings and Free Cash Flow calculation are shown in the appendix |

| Outlook 14 Fiscal 2013RevenueBetween $1.9 and $2.0 billionIncludes recent acquisitionEarnings per Diluted ShareBetween $2.22 and $2.42 per shareApproximately $0.07 per share effect of the fiscal year 2012 retroactive impact of the U.S. R&E credit for fiscal 2013 included |
| Appendix |
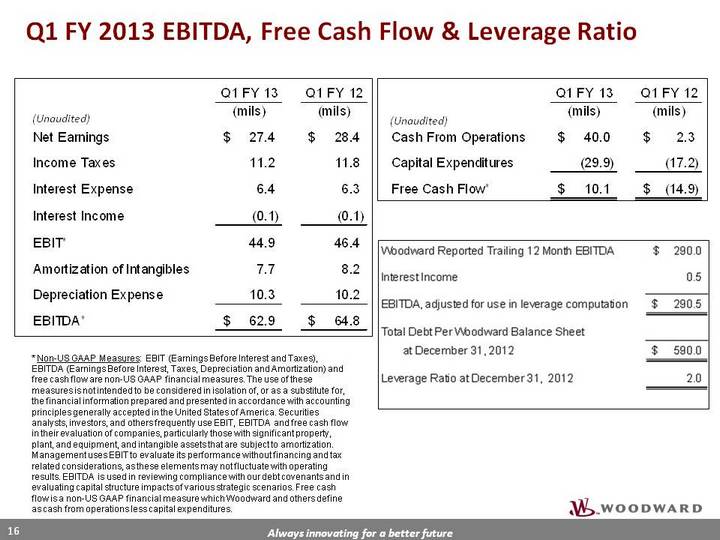
| Q1 FY 2013 EBITDA, Free Cash Flow & Leverage Ratio * Non-US GAAP Measures: EBIT (Earnings Before Interest and Taxes), EBITDA (Earnings Before Interest, Taxes, Depreciation and Amortization) and free cash flow are non-US GAAP financial measures. The use of these measures is not intended to be considered in isolation of, or as a substitute for, the financial information prepared and presented in accordance with accounting principles generally accepted in the United States of America. Securities analysts, investors, and others frequently use EBIT, EBITDA and free cash flow in their evaluation of companies, particularly those with significant property, plant, and equipment, and intangible assets that are subject to amortization. Management uses EBIT to evaluate its performance without financing and tax related considerations, as these elements may not fluctuate with operating results. EBITDA is used in reviewing compliance with our debt covenants and in evaluating capital structure impacts of various strategic scenarios. Free cash flow is a non-US GAAP financial measure which Woodward and others define as cash from operations less capital expenditures. (Unaudited) (Unaudited) 16 |