Attached files
| file | filename |
|---|---|
| 8-K - 8-K - FIRST NIAGARA FINANCIAL GROUP INC | a8-k12313erdeck.htm |
Fourth Quarter 2012 Earnings Highlights January 23, 2013 John R. Koelmel President & Chief Executive Officer Gregory W. Norwood Chief Financial Officer
Safe Harbor Statement Any statements contained in this presentation regarding the outlook for FNFG’s business and markets, such as projections of future earnings performance, statements of FNFG’s plans and objectives, forecasts or market trends and other matters, are forward-looking statements based on FNFG’s assumptions and beliefs. Such statements may be identified by such words or phrases as “will likely result,” “are expected to,” “will continue,” “outlook,” “will benefit,” “is anticipated,” “estimate,” “project,” “management believes” or similar expressions. These forward-looking statements are subject to certain risks and uncertainties that could cause actual results to differ materially from those discussed in such statements and no assurance can be given that the results in any forward-looking statement will be achieved. For these statements, FNFG claims the protection of the safe harbor for forward-looking statements contained in the Private Securities Litigation Reform Act of 1995. Any forward-looking statement speaks only as of the date on which it is made, and we disclaim any obligation to subsequently revise any forward-looking statement to reflect events or circumstances after such date or to reflect the occurrence of anticipated or unanticipated events. Certain factors could cause FNFG’s future results to differ materially from those expressed or implied in any forward-looking statements contained in this presentation. These factors include the factors discussed in Part I, Item 1A of FNFG’s 2011 Annual Report on Form 10-K under the heading “Risk Factors” and any other cautionary statements, written or oral, which may be made or referred to in connection with any such forward-looking statements. Since it is not possible to foresee all such factors, these factors should not be considered as complete or exhaustive. 2
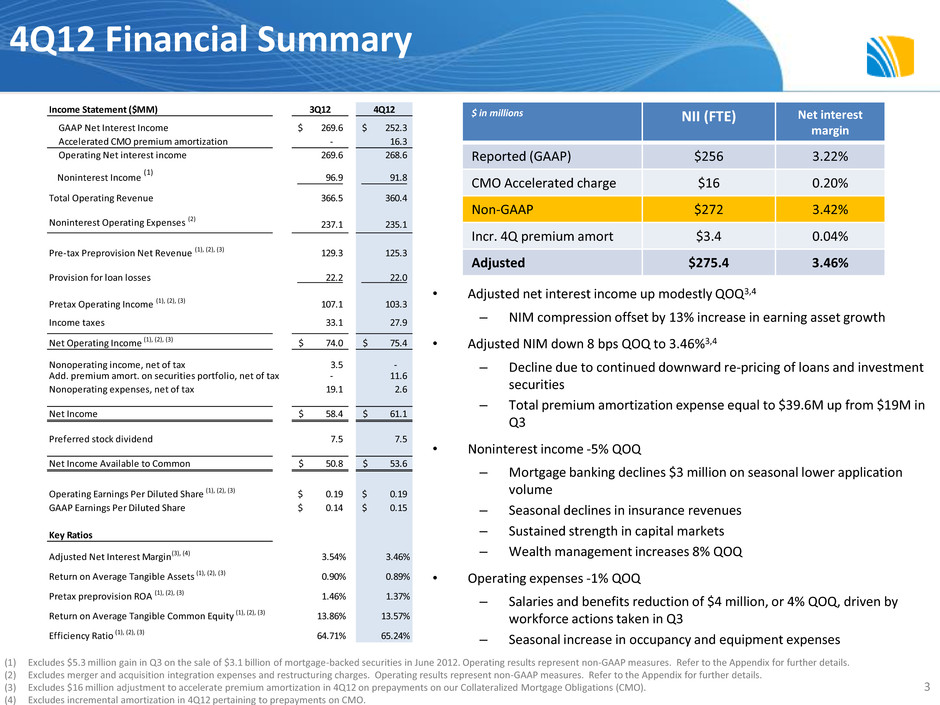
4Q12 Financial Summary • Adjusted net interest income up modestly QOQ3,4 – NIM compression offset by 13% increase in earning asset growth • Adjusted NIM down 8 bps QOQ to 3.46%3,4 – Decline due to continued downward re-pricing of loans and investment securities – Total premium amortization expense equal to $39.6M up from $19M in Q3 • Noninterest income -5% QOQ – Mortgage banking declines $3 million on seasonal lower application volume – Seasonal declines in insurance revenues – Sustained strength in capital markets – Wealth management increases 8% QOQ • Operating expenses -1% QOQ – Salaries and benefits reduction of $4 million, or 4% QOQ, driven by workforce actions taken in Q3 – Seasonal increase in occupancy and equipment expenses (1) Excludes $5.3 million gain in Q3 on the sale of $3.1 billion of mortgage-backed securities in June 2012. Operating results represent non-GAAP measures. Refer to the Appendix for further details. (2) Excludes merger and acquisition integration expenses and restructuring charges. Operating results represent non-GAAP measures. Refer to the Appendix for further details. (3) Excludes $16 million adjustment to accelerate premium amortization in 4Q12 on prepayments on our Collateralized Mortgage Obligations (CMO). (4) Excludes incremental amortization in 4Q12 pertaining to prepayments on CMO. 3 $ in millions NII (FTE) Net interest margin Reported (GAAP) $256 3.22% CMO Accelerated charge $16 0.20% Non-GAAP $272 3.42% Incr. 4Q premium amort $3.4 0.04% Adjusted $275.4 3.46% Income Statement ($MM) 3Q12 4Q12 GAAP Net Interest Income 269.6$ 252.3$ Accelerated CMO premium amortization - 16.3 Operating Net interest income 269.6 268.6 Noninterest Income (1) 96.9 91.8 Total Operating Revenue 366.5 360.4 Noninterest Operating Expenses (2) 237.1 235.1 Pre-tax Preprovision Net Revenue (1), (2), (3) 129.3 125.3 Provision for loan losses 22.2 22.0 Pretax Operating Income (1), (2), (3) 107.1 103.3 Income taxes 33.1 27.9 Net Operating Income (1), (2), (3) 74.0$ 75.4$ Nonoperating income, net of tax 3.5 - Add. premium amort. on securities portfolio, net of tax - 11.6 Nonoperating expenses, net of tax 19.1 2.6 Net Income 58.4$ 61.1$ Preferred stock dividend 7.5 7.5 Net Income Available to Common 50.8$ 53.6$ Operating Earnings Per Diluted Share (1), (2), (3) 0.19$ 0.19$ GAAP Earnings Per Diluted Share 0.14$ 0.15$ Key Ratios Adjusted Net Interest Margin(3), (4) 3.54% 3.46% Return on Average Tangible Ass s (1), (2), (3) 0.90% 0.89% Pretax preprovision ROA (1), (2), (3) 1.46% 1.37% Return on Average Tangible Common Equity (1), (2), (3) 13.86% 13.57% Efficiency Ratio (1), (2), (3) 64.71% 65.24%
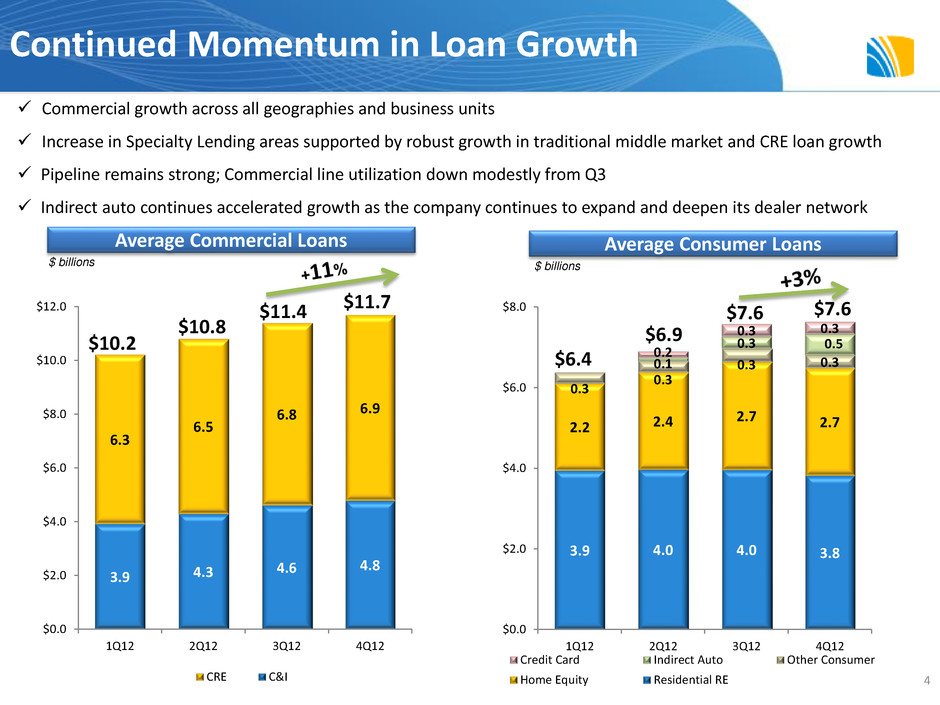
3.9 4.3 4.6 4.8 6.3 6.5 6.8 6.9 $0.0 $2.0 $4.0 $6.0 $8.0 $10.0 $12.0 1Q12 2Q12 3Q12 4Q12 CRE C&I 3.9 4.0 4.0 3.8 2.2 2.4 2.7 2.7 0.3 0.3 0.3 0.3 0.1 0.3 0.5 0.2 0.3 0.3 $0.0 $2.0 $4.0 $6.0 $8.0 1Q12 2Q12 3Q12 4Q12 Credit Card Indirect Auto Other Consumer Home Equity Residential RE Continued Momentum in Loan Growth Average Commercial Loans Average Consumer Loans $10.2 $10.8 $6.4 $6.9 $7.6 $ billions $ billions Commercial growth across all geographies and business units Increase in Specialty Lending areas supported by robust growth in traditional middle market and CRE loan growth Pipeline remains strong; Commercial line utilization down modestly from Q3 Indirect auto continues accelerated growth as the company continues to expand and deepen its dealer network $11.4 $7.6 $11.7 4
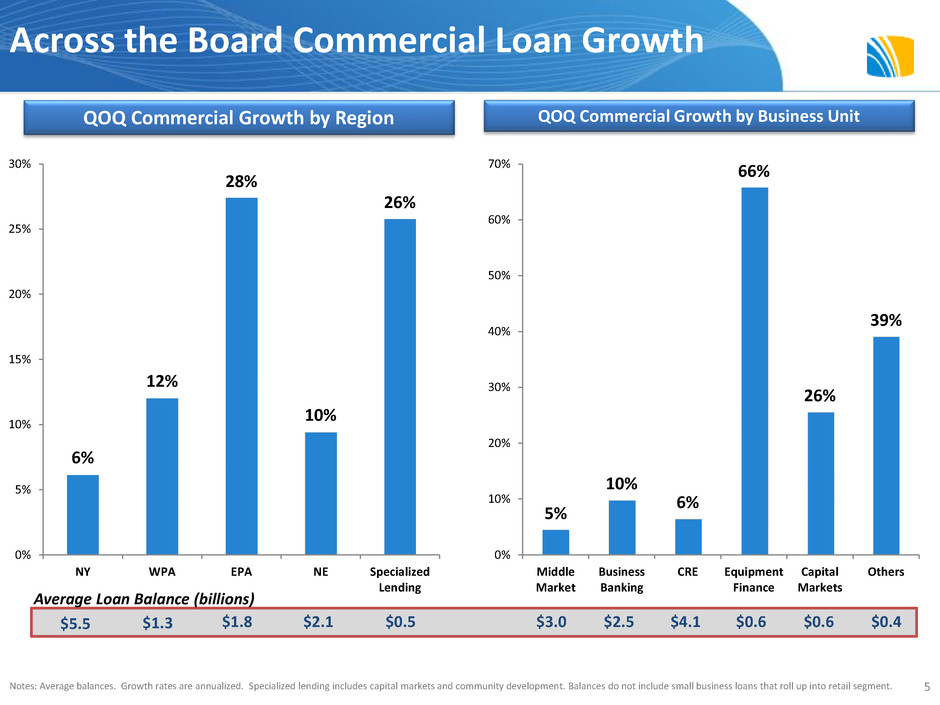
6% 12% 28% 10% 26% 0% 5% 10% 15% 20% 25% 30% NY WPA EPA NE Specialized Lending Across the Board Commercial Loan Growth Notes: Average balances. Growth rates are annualized. Specialized lending includes capital markets and community development. Balances do not include small business loans that roll up into retail segment. QOQ Commercial Growth by Region QOQ Commercial Growth by Business Unit $5.5 $1.3 $1.8 $2.1 $0.5 $3.0 $2.5 $4.1 $0.6 $0.6 $0.4 Average Loan Balance (billions) 5% 10% 6% 66% 26% 39% 0% 10% 20% 30% 40% 50% 60% 70% Middle Market Business Banking CRE Equipment Finance Capital Markets Others 5
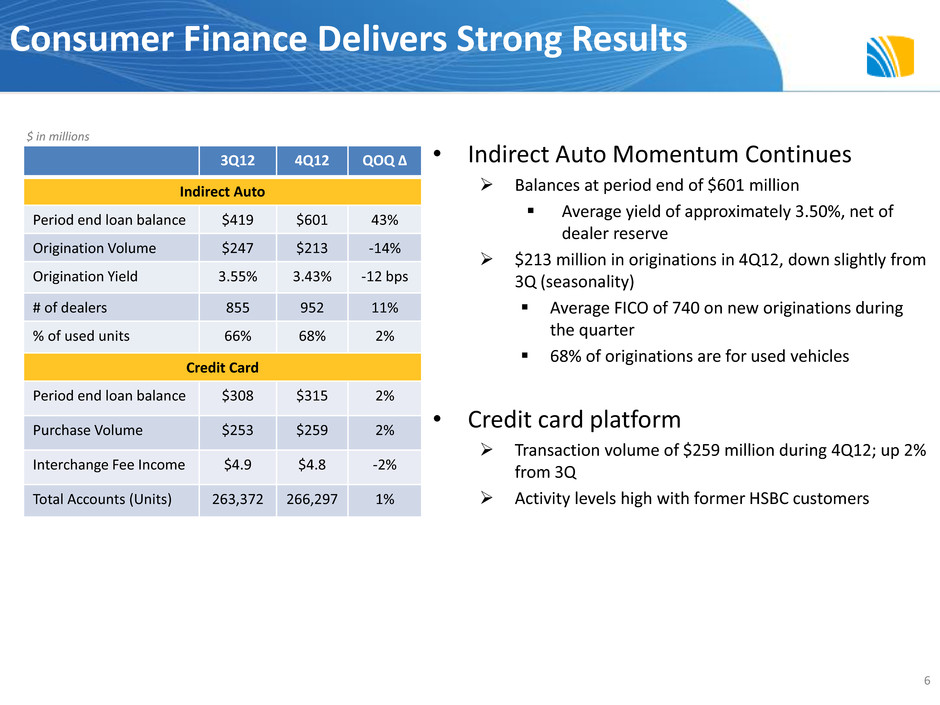
Consumer Finance Delivers Strong Results 6 3Q12 4Q12 QOQ ∆ Indirect Auto Period end loan balance $419 $601 43% Origination Volume $247 $213 -14% Origination Yield 3.55% 3.43% -12 bps # of dealers 855 952 11% % of used units 66% 68% 2% Credit Card Period end loan balance $308 $315 2% Purchase Volume $253 $259 2% Interchange Fee Income $4.9 $4.8 -2% Total Accounts (Units) 263,372 266,297 1% • Indirect Auto Momentum Continues Balances at period end of $601 million Average yield of approximately 3.50%, net of dealer reserve $213 million in originations in 4Q12, down slightly from 3Q (seasonality) Average FICO of 740 on new originations during the quarter 68% of originations are for used vehicles • Credit card platform Transaction volume of $259 million during 4Q12; up 2% from 3Q Activity levels high with former HSBC customers $ in millions
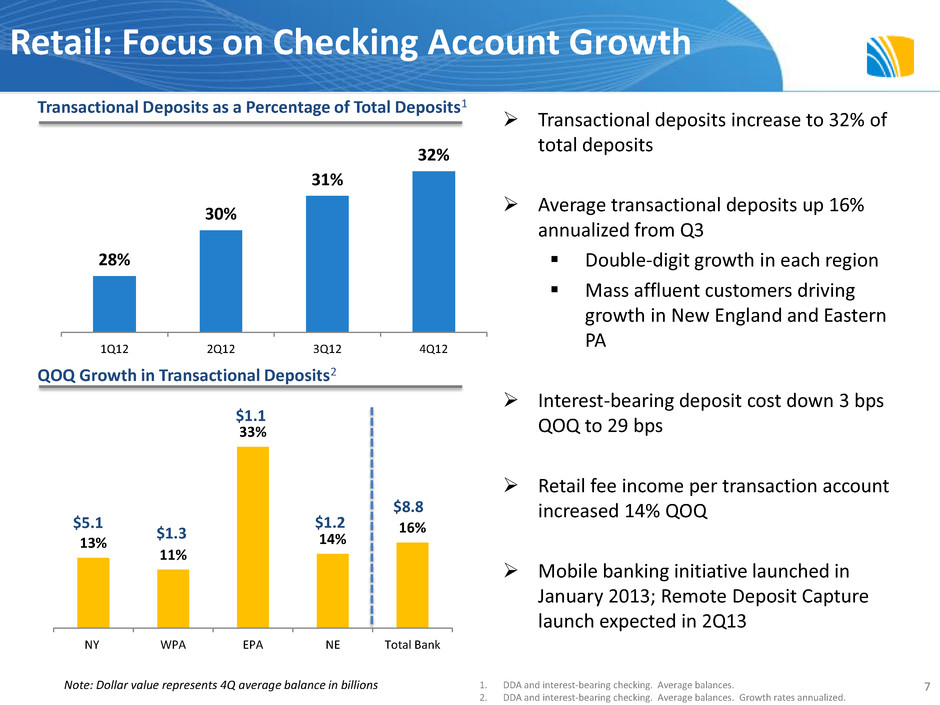
28% 30% 31% 32% 1Q12 2Q12 3Q12 4Q12 Retail: Focus on Checking Account Growth 7 1. DDA and interest-bearing checking. Average balances. 2. DDA and interest-bearing checking. Average balances. Growth rates annualized. Transactional deposits increase to 32% of total deposits Average transactional deposits up 16% annualized from Q3 Double-digit growth in each region Mass affluent customers driving growth in New England and Eastern PA Interest-bearing deposit cost down 3 bps QOQ to 29 bps Retail fee income per transaction account increased 14% QOQ Mobile banking initiative launched in January 2013; Remote Deposit Capture launch expected in 2Q13 Transactional Deposits as a Percentage of Total Deposits1 QOQ Growth in Transactional Deposits2 13% 11% 33% 14% 16% NY WPA EPA NE Total Bank $5.1 $1.3 $1.1 $1.2 $8.8 Note: Dollar value represents 4Q average balance in billions
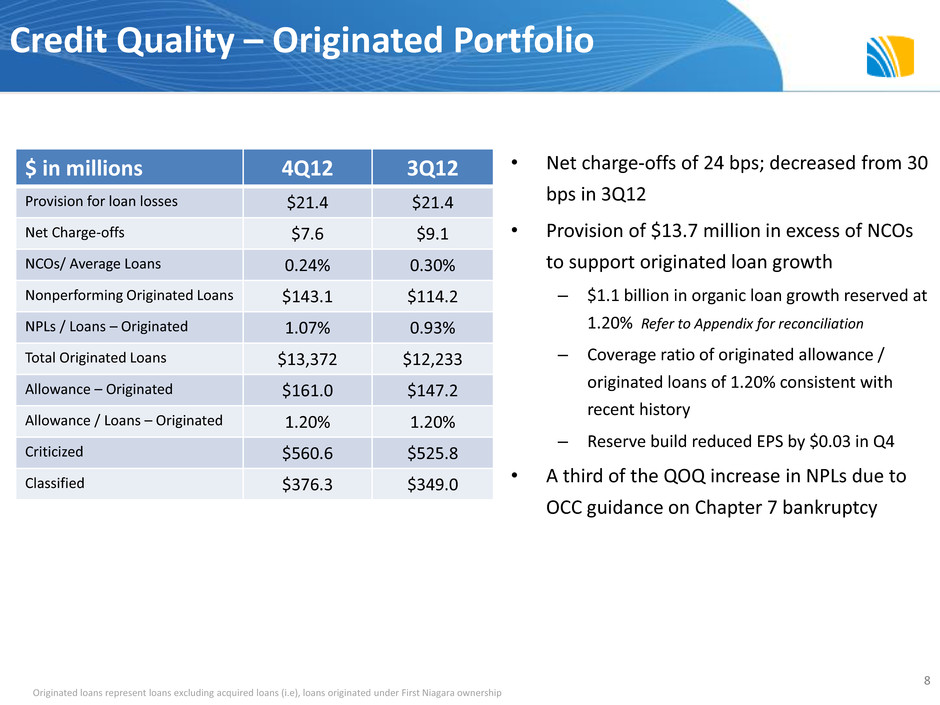
Credit Quality – Originated Portfolio • Net charge-offs of 24 bps; decreased from 30 bps in 3Q12 • Provision of $13.7 million in excess of NCOs to support originated loan growth – $1.1 billion in organic loan growth reserved at 1.20% Refer to Appendix for reconciliation – Coverage ratio of originated allowance / originated loans of 1.20% consistent with recent history – Reserve build reduced EPS by $0.03 in Q4 • A third of the QOQ increase in NPLs due to OCC guidance on Chapter 7 bankruptcy 8 $ in millions 4Q12 3Q12 Provision for loan losses $21.4 $21.4 Net Charge-offs $7.6 $9.1 NCOs/ Average Loans 0.24% 0.30% Nonperforming Originated Loans $143.1 $114.2 NPLs / Loans – Originated 1.07% 0.93% Total Originated Loans $13,372 $12,233 Allowance – Originated $161.0 $147.2 Allowance / Loans – Originated 1.20% 1.20% Criticized $560.6 $525.8 Classified $376.3 $349.0 Originated loans represent loans excluding acquired loans (i.e), loans originated under First Niagara ownership
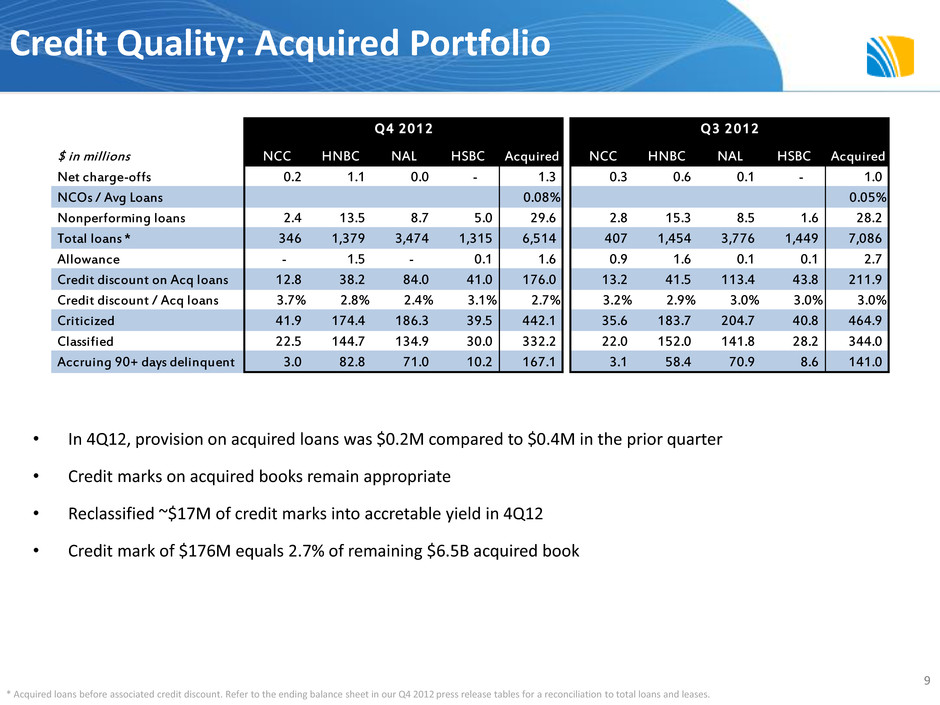
Credit Quality: Acquired Portfolio • In 4Q12, provision on acquired loans was $0.2M compared to $0.4M in the prior quarter • Credit marks on acquired books remain appropriate • Reclassified ~$17M of credit marks into accretable yield in 4Q12 • Credit mark of $176M equals 2.7% of remaining $6.5B acquired book 9 * Acquired loans before associated credit discount. Refer to the ending balance sheet in our Q4 2012 press release tables for a reconciliation to total loans and leases. $ in millions NCC HNBC NAL HSBC Acquired NCC HNBC NAL HSBC Acquired Net charge-offs 0.2 1.1 0.0 - 1.3 0.3 0.6 0.1 - 1.0 NCOs / Avg Loans 0.08% 0.05% Nonperforming loans 2.4 13.5 8.7 5.0 29.6 2.8 15.3 8.5 1.6 28.2 Total loans * 346 1,379 3,474 1,315 6,514 407 1,454 3,776 1,449 7,086 Allowance - 1.5 - 0.1 1.6 0.9 1.6 0.1 0.1 2.7 Credit discount on Acq loans 12.8 38.2 84.0 41.0 176.0 13.2 41.5 113.4 43.8 211.9 Credit discount / Acq loans 3.7% 2.8% 2.4% 3.1% 2.7% 3.2% 2.9% 3.0% 3.0% 3.0% Criticized 41.9 174.4 186.3 39.5 442.1 35.6 183.7 204.7 40.8 464.9 Classified 22.5 144.7 134.9 30.0 332.2 22.0 152.0 141.8 28.2 344.0 Accruing 90+ days delinquent 3.0 82.8 71.0 10.2 167.1 3.1 58.4 70.9 8.6 141.0 Q4 2012 Q3 2012
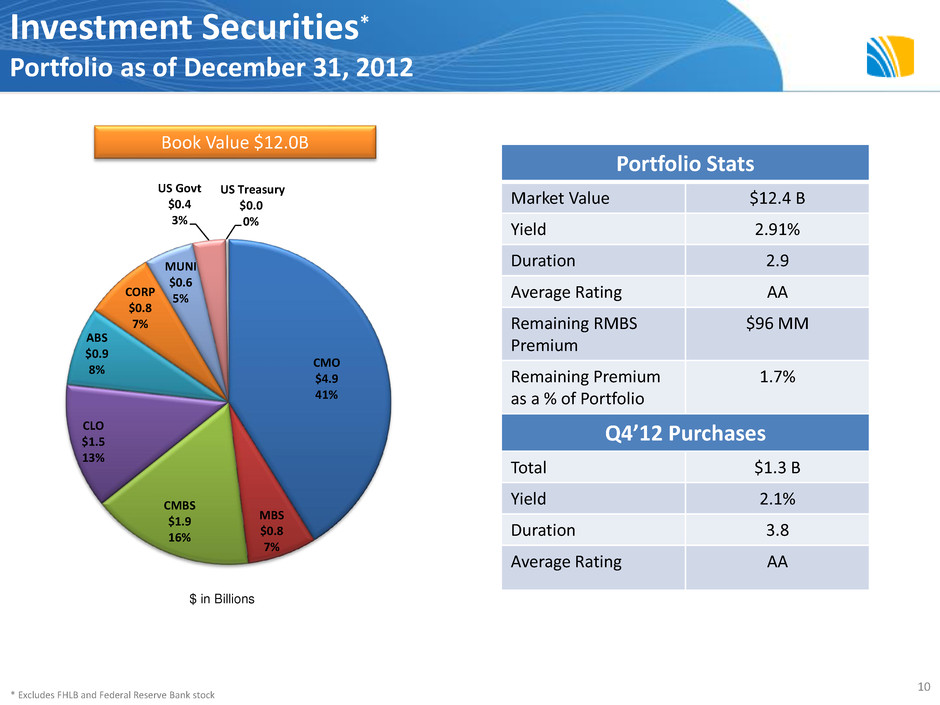
Investment Securities* Portfolio as of December 31, 2012 10 Portfolio Stats Market Value $12.4 B Yield 2.91% Duration 2.9 Average Rating AA Remaining RMBS Premium $96 MM Remaining Premium as a % of Portfolio 1.7% Q4’12 Purchases Total $1.3 B Yield 2.1% Duration 3.8 Average Rating AA Book Value $12.0B CMO $4.9 41% MBS $0.8 7% CMBS $1.9 16% CLO $1.5 13% ABS $0.9 8% CORP $0.8 7% MUNI $0.6 5% US Govt $0.4 3% US Treasury $0.0 0% $ in Billions * Excludes FHLB and Federal Reserve Bank stock
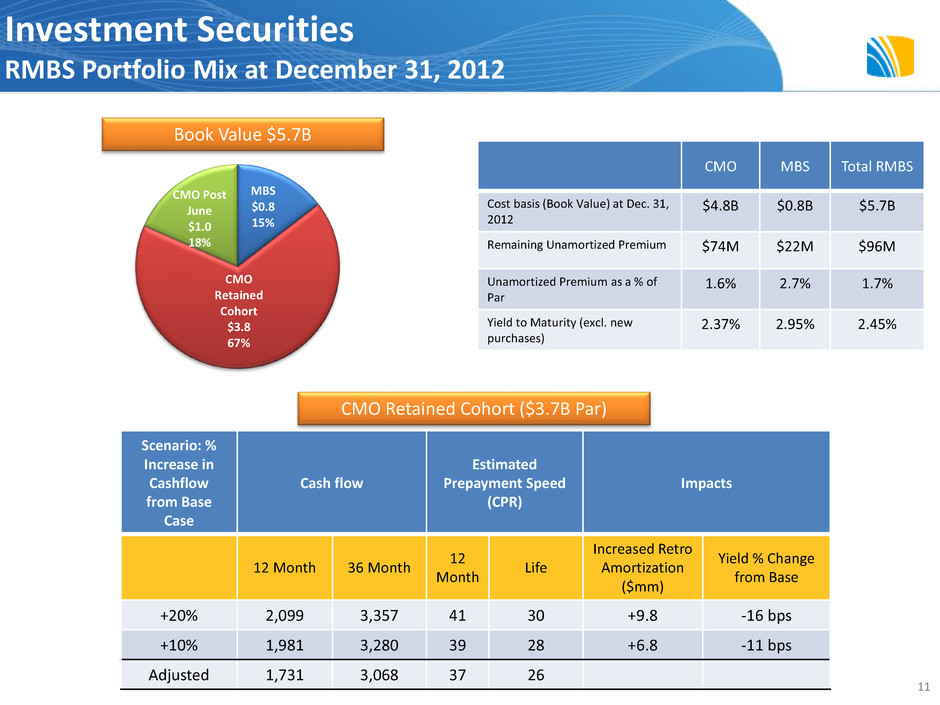
11 Investment Securities RMBS Portfolio Mix at December 31, 2012 Book Value $5.7B CMO MBS Total RMBS Cost basis (Book Value) at Dec. 31, 2012 $4.8B $0.8B $5.7B Remaining Unamortized Premium $74M $22M $96M Unamortized Premium as a % of Par 1.6% 2.7% 1.7% Yield to Maturity (excl. new purchases) 2.37% 2.95% 2.45% MBS $0.8 15% CMO Retained Cohort $3.8 67% CMO Post June $1.0 18% Scenario: % Increase in Cashflow from Base Case Cash flow Estimated Prepayment Speed (CPR) Impacts 12 Month 36 Month 12 Month Life Increased Retro Amortization ($mm) Yield % Change from Base +20% 2,099 3,357 41 30 +9.8 -16 bps +10% 1,981 3,280 39 28 +6.8 -11 bps Adjusted 1,731 3,068 37 26 CMO Retained Cohort ($3.7B Par)
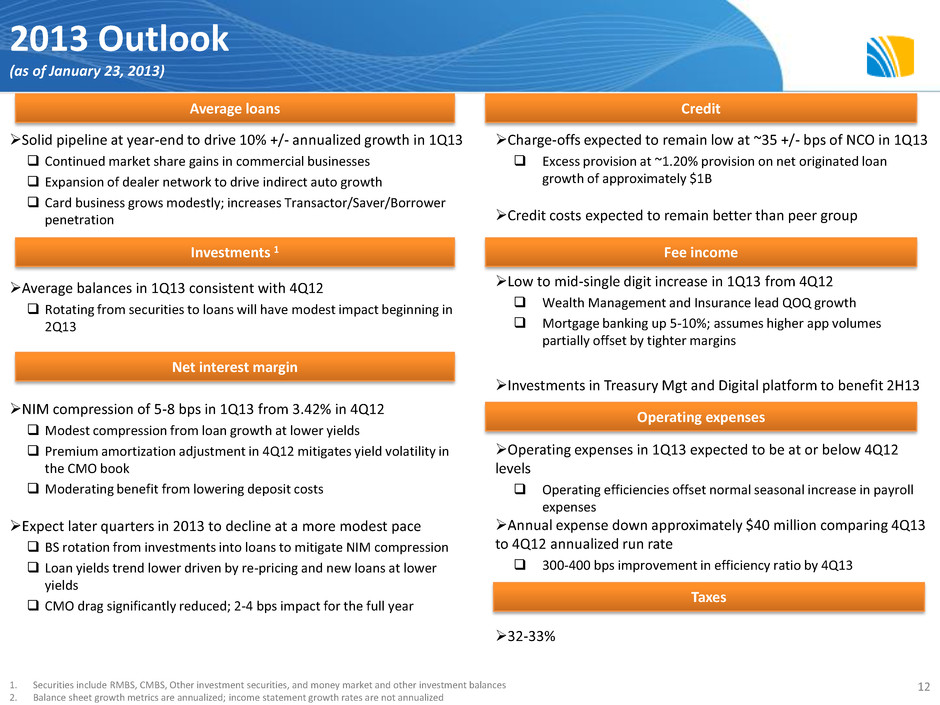
2013 Outlook (as of January 23, 2013) Solid pipeline at year-end to drive 10% +/- annualized growth in 1Q13 Continued market share gains in commercial businesses Expansion of dealer network to drive indirect auto growth Card business grows modestly; increases Transactor/Saver/Borrower penetration Average balances in 1Q13 consistent with 4Q12 Rotating from securities to loans will have modest impact beginning in 2Q13 NIM compression of 5-8 bps in 1Q13 from 3.42% in 4Q12 Modest compression from loan growth at lower yields Premium amortization adjustment in 4Q12 mitigates yield volatility in the CMO book Moderating benefit from lowering deposit costs Expect later quarters in 2013 to decline at a more modest pace BS rotation from investments into loans to mitigate NIM compression Loan yields trend lower driven by re-pricing and new loans at lower yields CMO drag significantly reduced; 2-4 bps impact for the full year Charge-offs expected to remain low at ~35 +/- bps of NCO in 1Q13 Excess provision at ~1.20% provision on net originated loan growth of approximately $1B Credit costs expected to remain better than peer group Low to mid-single digit increase in 1Q13 from 4Q12 Wealth Management and Insurance lead QOQ growth Mortgage banking up 5-10%; assumes higher app volumes partially offset by tighter margins Investments in Treasury Mgt and Digital platform to benefit 2H13 Operating expenses in 1Q13 expected to be at or below 4Q12 levels Operating efficiencies offset normal seasonal increase in payroll expenses Annual expense down approximately $40 million comparing 4Q13 to 4Q12 annualized run rate 300-400 bps improvement in efficiency ratio by 4Q13 32-33% 12 1. Securities include RMBS, CMBS, Other investment securities, and money market and other investment balances 2. Balance sheet growth metrics are annualized; income statement growth rates are not annualized Average loans Investments 1 Net interest margin Credit Fee income Operating expenses Taxes
Appendix 13 Non-GAAP Measures – This presentation contains financial information determined by methods other than in accordance with accounting principles generally accepted in the United States of America (GAAP). The Company believes that these non-GAAP financial measures provide a meaningful comparison of the underlying operational performance of the Company, and facilitate investors’ assessments of business and performance trends in comparison to others in the financial services industry. In addition, the Company believes the exclusion of these non- operating items enables management to perform a more effective evaluation and comparison of the Company’s results and to assess performance in relation to the Company’s ongoing operations. These disclosures should not be viewed as a substitute for financial measures determined in accordance with GAAP, nor are they necessarily comparable to non-GAAP performance measures that may be presented by other companies. Where non-GAAP disclosures are used in this presentation, the comparable GAAP financial measure, as well as the reconciliation to the comparable GAAP financial member, can be found in this Appendix.
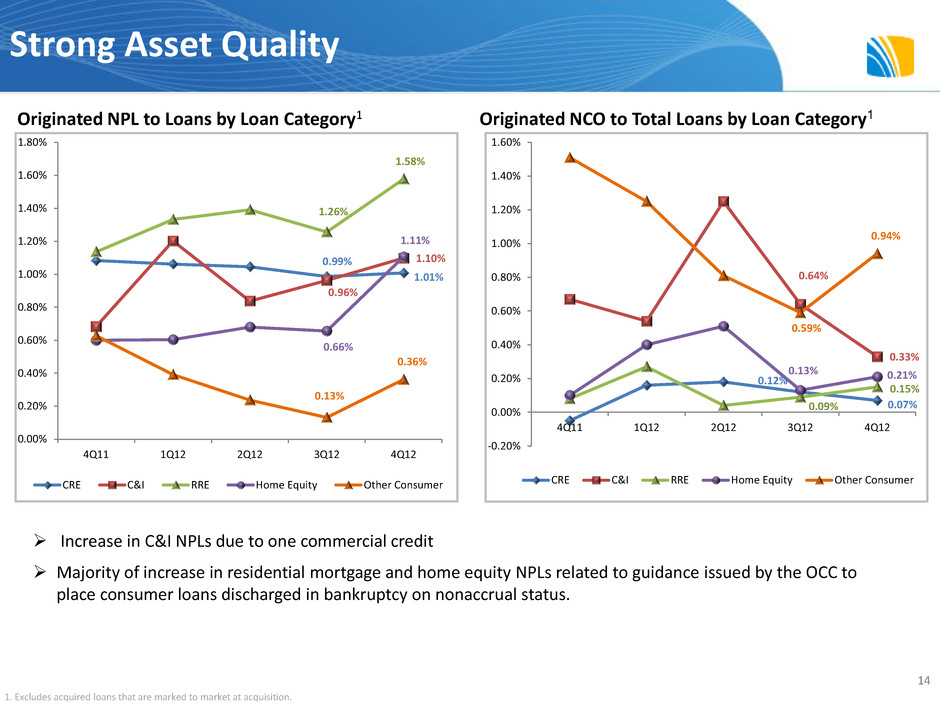
14 0.99% 1.01% 0.96% 1.10% 1.26% 1.58% 0.66% 1.11% 0.13% 0.36% 0.00% 0.20% 0.40% 0.60% 0.80% 1.00% 1.20% 1.40% 1.60% 1.80% 4Q11 1Q12 2Q12 3Q12 4Q12 CRE C&I RRE Home Equity Other Consumer Originated NPL to Loans by Loan Category1 Originated NCO to Total Loans by Loan Category1 Increase in C&I NPLs due to one commercial credit Majority of increase in residential mortgage and home equity NPLs related to guidance issued by the OCC to place consumer loans discharged in bankruptcy on nonaccrual status. 1. Excludes acquired loans that are marked to market at acquisition. 0.12% 0.07% 0.64% 0.33% 0.09% 0.15% 0.13% 0.21% 0.59% 0.94% -0.20% 0.00% 0.20% 0.40% 0.60% 0.80% 1.00% 1.20% 1.40% 1.60% 4Q11 1Q12 2Q12 3Q12 4Q12 CRE C&I RRE Home Equity Other Consumer Strong Asset Quality
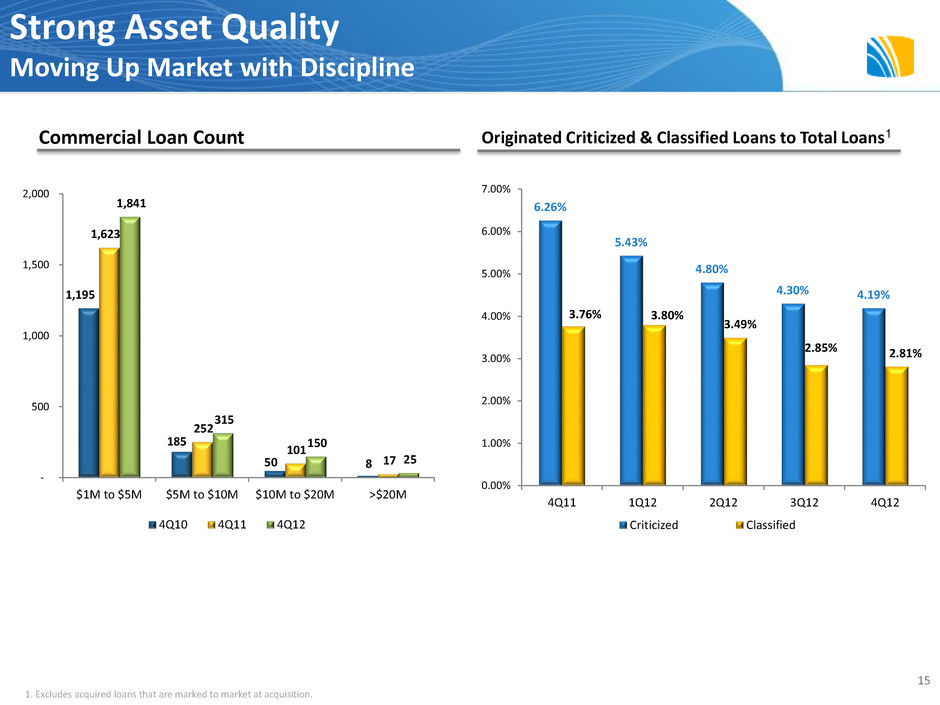
15 1,195 185 50 8 1,623 252 101 17 1,841 315 150 25 - 500 1,000 1,500 2,000 $1M to $5M $5M to $10M $10M to $20M >$20M 4Q10 4Q11 4Q12 Commercial Loan Count 6.26% 5.43% 4.80% 4.30% 4.19% 3.76% 3.80% 3.49% 2.85% 2.81% 0.00% 1.00% 2.00% 3.00% 4.00% 5.00% 6.00% 7.00% 4Q11 1Q12 2Q12 3Q12 4Q12 Criticized Classified Originated Criticized & Classified Loans to Total Loans1 1. Excludes acquired loans that are marked to market at acquisition. Strong Asset Quality Moving Up Market with Discipline
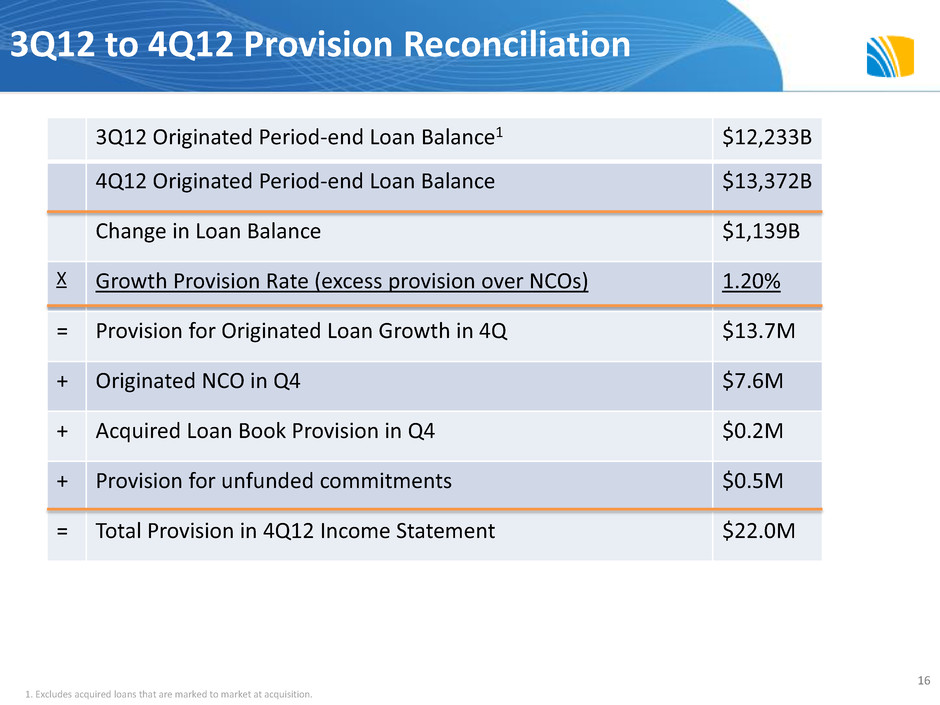
16 1. Excludes acquired loans that are marked to market at acquisition. 3Q12 to 4Q12 Provision Reconciliation 3Q12 Originated Period-end Loan Balance1 $12,233B 4Q12 Originated Period-end Loan Balance $13,372B Change in Loan Balance $1,139B X Growth Provision Rate (excess provision over NCOs) 1.20% = Provision for Originated Loan Growth in 4Q $13.7M + Originated NCO in Q4 $7.6M + Acquired Loan Book Provision in Q4 $0.2M + Provision for unfunded commitments $0.5M = Total Provision in 4Q12 Income Statement $22.0M
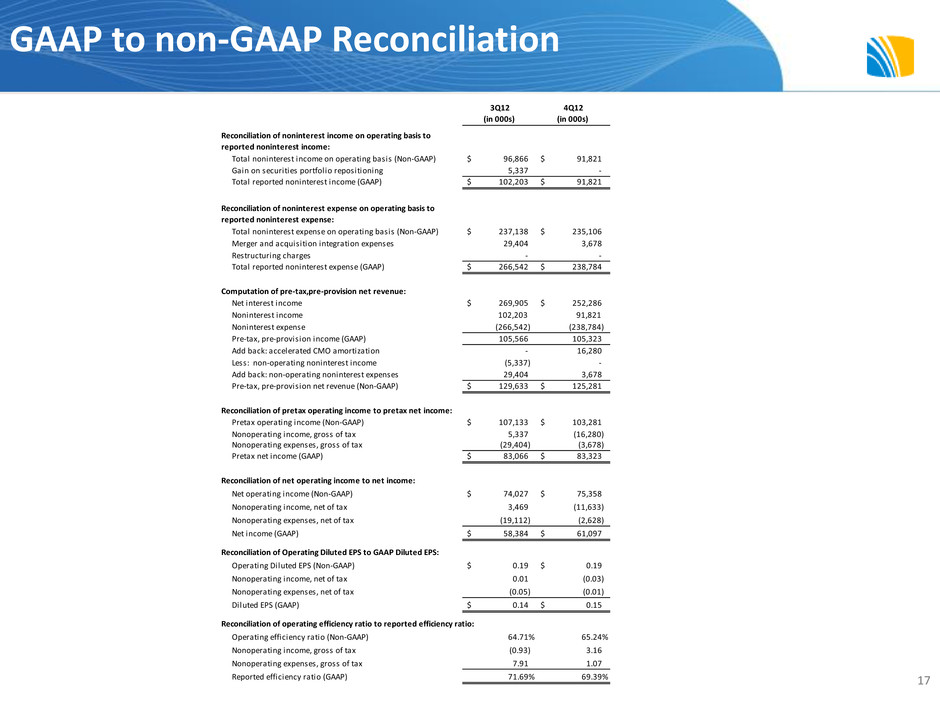
GAAP to non-GAAP Reconciliation 17 3Q12 (in 000s) 4Q12 (in 000s) Total noninterest income on operating basis (Non-GAAP) 96,866$ 91,821$ Gain on securities portfolio repositioning 5,337 - Total reported noninterest income (GAAP) 102,203$ 91,821$ Total noninterest expense on operating basis (Non-GAAP) 237,138$ 235,106$ Merger and acquisition integration expenses 29,404 3,678 Restructuring charges - - Total reported noninterest expense (GAAP) 266,542$ 238,784$ Computation of pre-tax,pre-provision net revenue: Net interest income 269,905$ 252,286$ Noninterest income 102,203 91,821 Noninterest expense (266,542) (238,784) Pre-tax, pre-provision income (GAAP) 105,566 105,323 Add back: accelerated CMO amortization - 16,280 Less: non-operating noninterest income (5,337) - Add back: non-operating noninterest expenses 29,404 3,678 Pre-tax, pre-provision net revenue (Non-GAAP) 129,633$ 125,281$ Reconciliation of pretax operating income to pretax net income: Pretax operating income (Non-GAAP) 107,133$ 103,281$ Nonoperating income, gross of tax 5,337 (16,280) Nonoperating expenses, gross of tax (29,404) (3,678) Pretax net income (GAAP) 83,066$ 83,323$ Reconciliation of net operating income to net income: Net operating income (Non-GAAP) 74,027$ 75,358$ Nonoperating income, net of tax 3,469 (11,633) Nonoperating expenses, net of tax (19,112) (2,628) Net income (GAAP) 58,384$ 61,097$ Reconciliation of Operating Diluted EPS to GAAP Diluted EPS: Operating Diluted EPS (Non-GAAP) 0.19$ 0.19$ Nonoperating income, net of tax 0.01 (0.03) Nonoperating expenses, net of tax (0.05) (0.01) Diluted EPS (GAAP) 0.14$ 0.15$ Reconciliation of operating efficiency ratio to reported efficiency ratio: Operating efficiency ratio (Non-GAAP) 64.71% 65.24% Nonoperating income, gross of tax (0.93) 3.16 Nonoperating expenses, gross of tax 7.91 1.07 Reported efficiency ratio (GAAP) 71.69% 69.39% Reconciliation of noninterest expense on operating basis to reported noninterest expense: Reconciliation of noninterest income on operating basis to reported noninterest income:
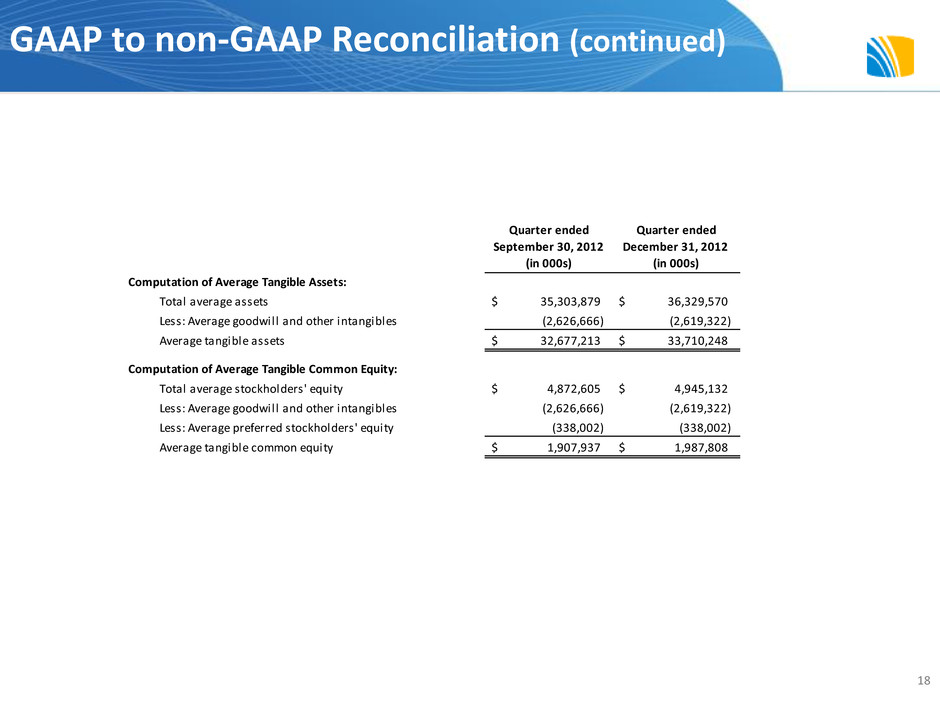
18 Quarter ended Quarter ended September 30, 2012 (in 000s) December 31, 2012 (in 000s) Computation of Average Tangible Assets: Total average assets 35,303,879$ 36,329,570$ Less: Average goodwill and other intangibles (2,626,666) (2,619,322) Average tangible assets 32,677,213$ 33,710,248$ Computation of Average Tangible Common Equity: Total average stockholders' equity 4,872,605$ 4,945,132$ Less: Average goodwill and other intangibles (2,626,666) (2,619,322) Less: Average preferred stockholders' equity (338,002) (338,002) Average tangible common equity 1,907,937$ 1,987,808$ GAAP to non-GAAP Reconciliation (continued)
