Attached files
| file | filename |
|---|---|
| 8-K - 8-K - TOTAL SYSTEM SERVICES INC | d470870d8k.htm |
| EX-99.1 - EX-99.1 - TOTAL SYSTEM SERVICES INC | d470870dex991.htm |
 2012 Fourth Quarter and
Year to Date Results January 22, 2013
© 2013
Total System Services, Inc.® All rights reserved worldwide.
People-Centered Payments
Exhibit 99.2 |
 This presentation and comments made by management contain
forward-looking statements including, among others, statements
regarding the expected future operating results of TSYS. These
statements are based on management’s current expectations and
assumptions and are subject to risks, uncertainties and changes in
circumstances. Forward-looking statements include all statements
that are not historical facts and can be identified by the use of
forward- looking
terminology
such
as
the
words
“believe,”
“expect,”
“anticipate,”
“intend,”
“plan,”
“estimate”
or similar expressions. Actual results may
differ materially from those set forth in the forward-looking statements
due to a variety of factors. More information about these risks,
uncertainties
and
factors
may
be
found
in
TSYS’
2011
Annual
Report
on Form 10-K, Quarterly Reports on Form 10-Q and Current Reports
on Form 8-K. TSYS does not assume any obligation to update any
forward-looking statements as a result of new information, future
developments or otherwise.
2
©2013
Total System Services, Inc.® Proprietary. All rights reserved worldwide.
Forward-Looking Statements |
 Use of Non-GAAP
Financial Measures This slide presentation contains certain non-GAAP financial
measures determined by methods other than in accordance with generally
accepted accounting principles. Such non-GAAP financial measures
include the following: revenues before reimbursable items; operating
margin excluding reimbursable items; revenues measured on a
constant currency basis; free cash flow; and EBITDA. The most
comparable GAAP measures to these measures are revenues;
operating margin; revenues; cash flows from operating activities; and
net income, respectively. Management uses these non-GAAP financial
measures
to
assess
the
performance
of
TSYS’
core
business.
TSYS
believes that these non-GAAP financial measures provide meaningful
additional information about TSYS to assist investors in evaluating
TSYS’
operating results. These non-GAAP financial measures should
not be considered as a substitute for operating results determined in
accordance with GAAP and may not be comparable to other similarly
titled measures of other companies. The computations of the non-
GAAP financial measures used in this slide presentation are set forth in
the Appendix to this slide presentation.
3
©2013
Total System Services, Inc.® Proprietary. All rights reserved worldwide.
|
 Phil Tomlinson
Chairman and Chief Executive Officer
People-Centered Payments
©2013
Total System Services, Inc.® Proprietary. All rights reserved worldwide. |
 Jim Lipham
Chief Financial Officer
People-Centered Payments
©2013
Total System Services, Inc.® Proprietary. All rights reserved worldwide. |
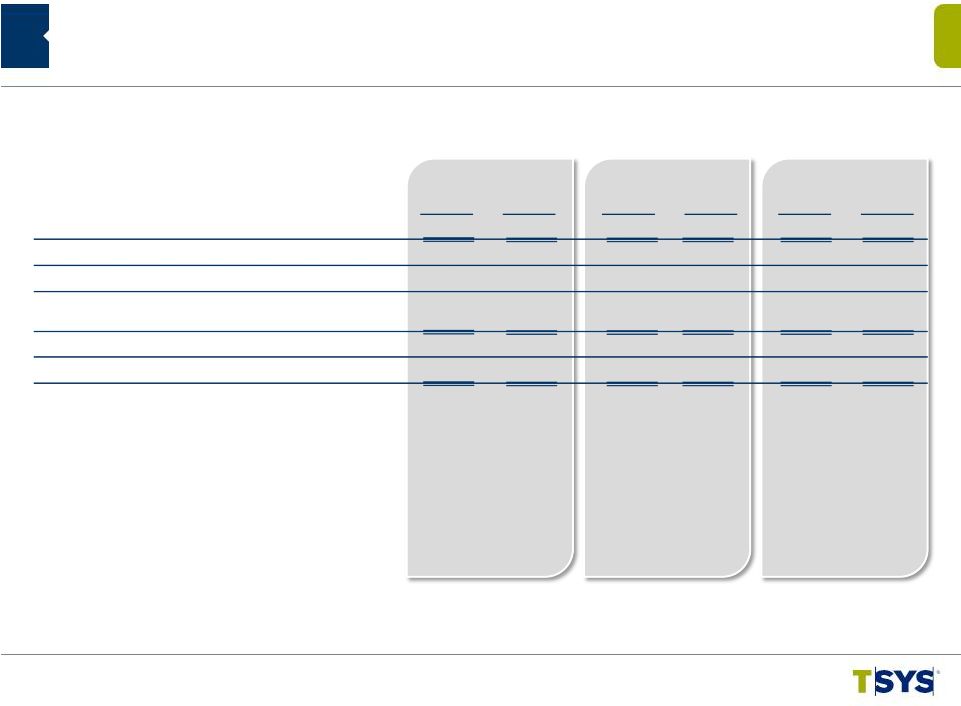
 Consolidated Selected Financial Highlights
6
$ 479,100
$ 472,234
1.5%
Total Revenues
$ 1,870,972
$ 1,808,966
3.4%
418,569
407,683
2.7
Revenues Before Reimbursable Items
1,618,491
1,540,698
5.0
89,831
89,718
0.1
Operating Income
357,652
322,456
10.9
60,862
59,874
1.7
Net Income Attributable to TSYS
Common Shareholders
244,280
220,559
10.8
2,668.6
2,347.3
13.7
Total Cardholder Transactions (in millions)
9,776.8
8,645.0
13.1
$0.33
$0.31
3.7
Earnings Per Share
Attributable to TSYS Common
Shareholders
$1.30
$1.15
13.1
YTD
2012
YTD
2011
Percent
Change
(in thousands, except per share data)
4 Qtr
2012
4 Qtr
2011
Percent
Change
th
th
©2013
Total System Services, Inc.® Proprietary. All rights reserved worldwide.
|
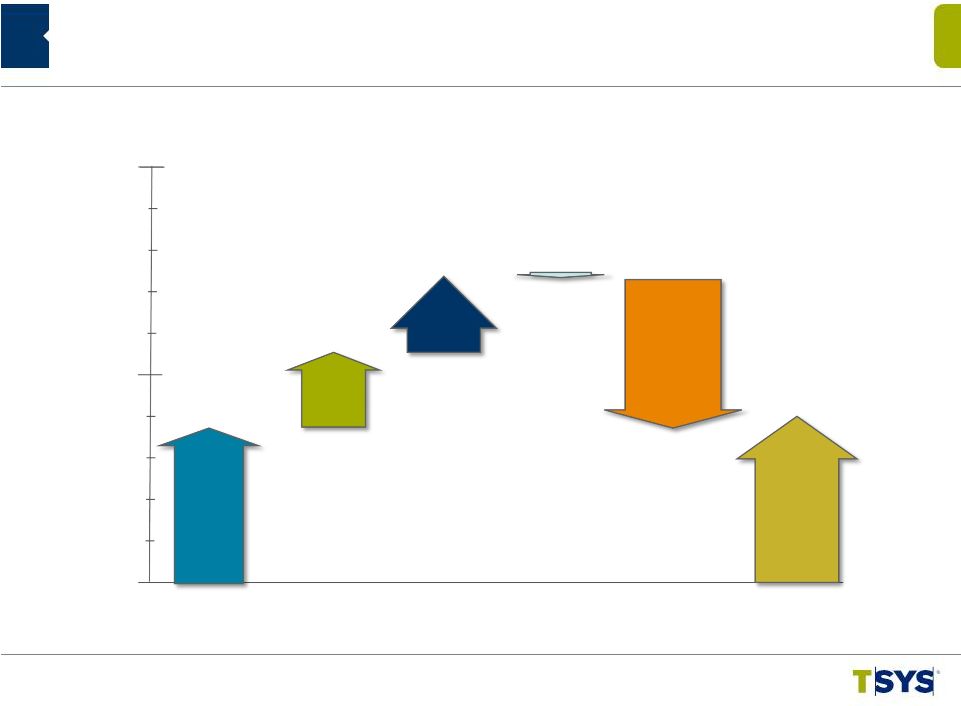
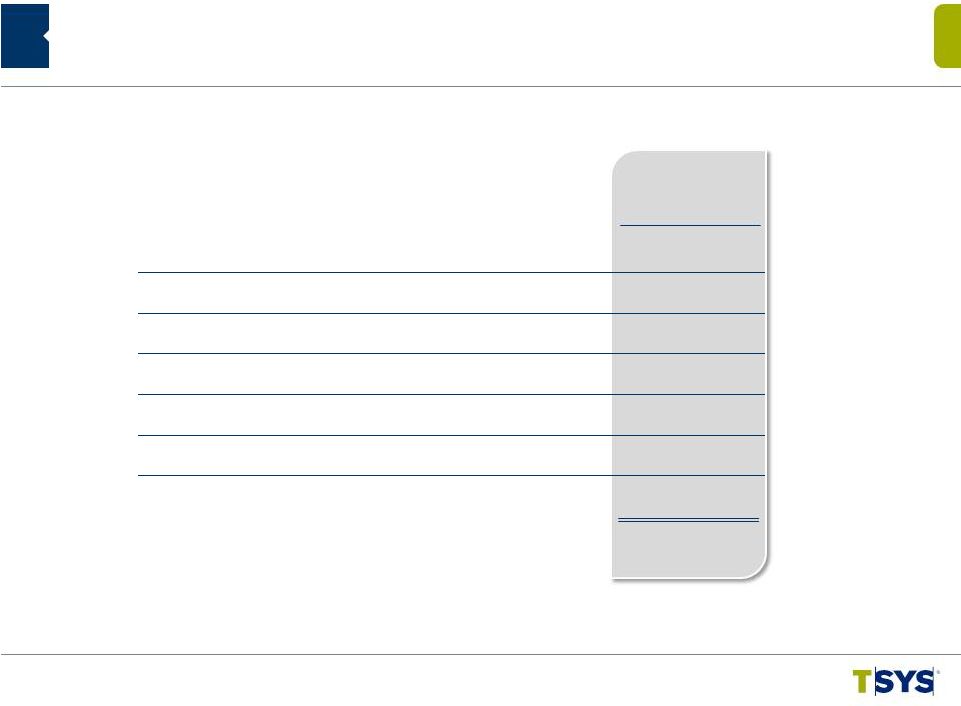
 2012
YTD Revenue Change Revenues Before Reimbursable Items
7
10%
15%
5%
0%
5.1%
Internal
Growth
New
Clients
3.2%
Acquisitions
Lost
Business,
Non-recurring
Items and
Price
Compression
(4.7%)
Reported
5.0%
Currency
(0.4%)
1.8%
©2013
Total System Services, Inc.® Proprietary. All rights reserved worldwide.
|
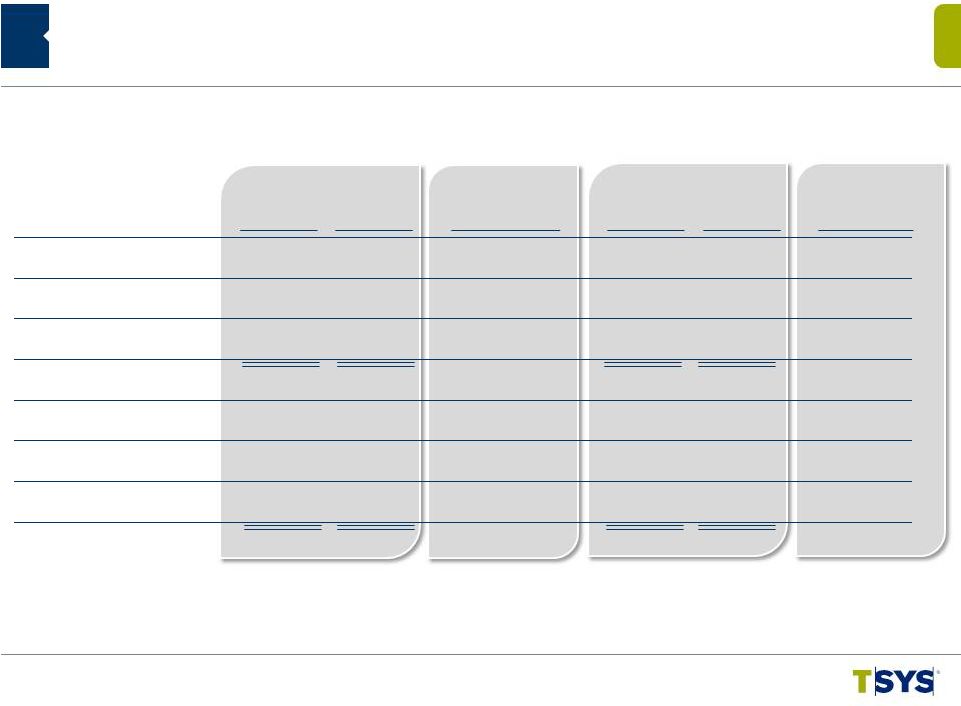
 Consumer Credit
200.5
195.0
2.8
200.5
195.0
2.8
Retail
25.0
24.6
2.0
25.0
24.1
3.8
Total Consumer
225.5
219.6
2.7
225.5
219.1
2.9
Commercial
37.1
35.2
5.3
37.1
36.3
2.3
Other
12.8
7.9
61.4
12.8
11.1
15.3
Subtotal
275.4
262.7
4.8
275.4
266.4
3.4
Prepaid /
Stored Value
115.9
85.2
36.1
115.9
114.3
1.4
Government
Services
57.0
29.7
92.0
57.0
48.8
16.8
Commercial Card
Single Use
31.1
26.6
17.1
31.1
36.8
(15.4
)
Total AOF
479.4
404.2
18.6
479.4
466.4
2.8
Consolidated Accounts on File Portfolio Summary
(in millions)
Dec
2012
Dec
2011
%
Change
Dec
2012
Sep
2012
%
Change
8
©2013
Total System Services, Inc.® Proprietary. All rights reserved worldwide.
|
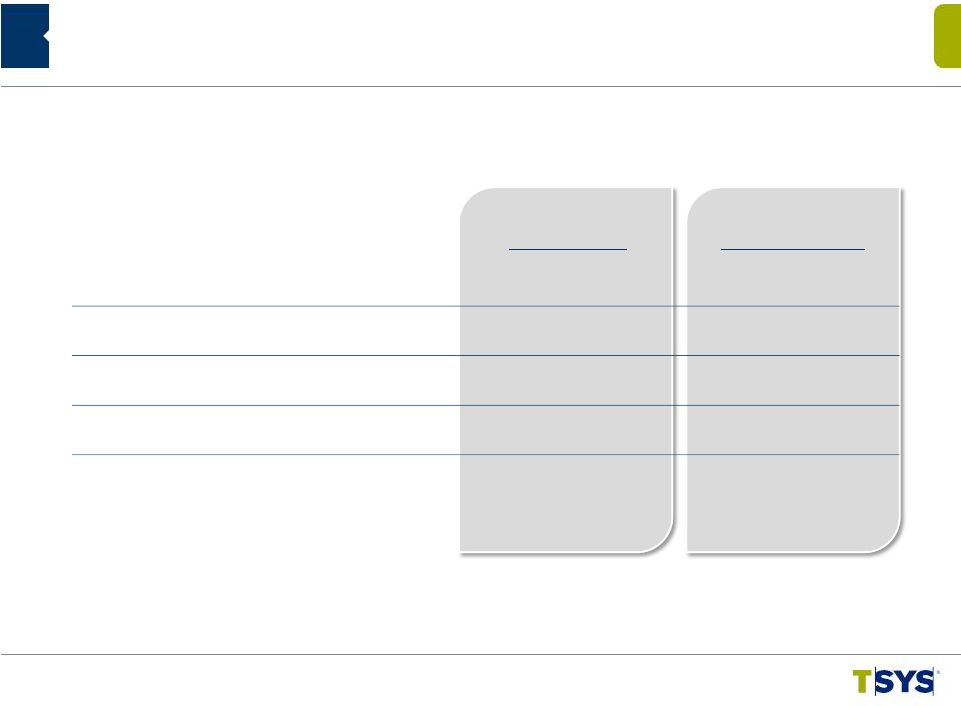
 Key Drivers
4Q 2012 Year Over Year Segment Financial Highlights
•
Strong internal growth
•
Increased volumes
•
Pricing concessions
•
Lost business
North America
Services
9
•
Total accounts on file were 424.8 million, an
increase of 20.9%
•
Excluding prepaid, govt. services and single use,
accounts on file were 222.7 million, an increase
of 5.5%
•
Total cardholder transactions were 2,194.7
million, an increase of 12.7%
Volumes
©2013
Total System Services, Inc.® Proprietary. All rights reserved worldwide.
Revenues
$247.6 million
Increase of 0.6%
Excluding Reimbursables
$213.6 million
Increase of 1.9%
Operating Income
$77.8 million
Increase of 16.9%
Operating Margin
31.4%
Excluding Reimbursables
36.4%
Same Client Transactions
2,154.6 million
Increase of 13.2% |
 4Q 2012 Year Over Year
Segment Financial Highlights •
Strong internal growth
•
Deconversion fee
•
Lost business
•
Conversion of new clients
•
Dedication of more internal resources,
previously shared between our North America
and International segments
10
Key Drivers
Volumes
•
Accounts on file were 54.6 million, an increase
of 3.5%
•
Total cardholder transactions were 474.0
million, an increase of 18.6%
©2013
Total System Services, Inc.® Proprietary. All rights reserved worldwide.
International
Services
Revenues
$107.0 million
Increase of 0.4%
Constant currency basis
$107.0 million
Excluding Reimbursables
$102.4 million
Decrease of 0.4%
Operating Income
$6.1 million
Decrease of 49.4%
Operating Margin
5.7%
Excluding Reimbursables
5.9%
Same Client Transactions
441.0
million
Increase of 12.9% |
 Merchant
Services
•
Upward trends in transaction volumes
•
Strong dollar volume growth in direct acquiring
•
Acquisition of Central Payment
11
Key Drivers
Volumes
•
Point-of-Sale transactions were 1,153.2 million,
a decrease of 5.2%
•
Excluding deconverted clients, Point-of-Sale
transactions increased 9.9%
4Q 2012 Year Over Year Segment Financial Highlights
Revenues
$129.4 million
Increase of 2.5%
Excluding Reimbursables
$105.9 million
Increase of 5.5%
Operating Income
$30.4 million
Decrease of 7.6%
Operating Margin
23.5%
Excluding Reimbursables
28.8%
©2013
Total System Services, Inc.® Proprietary. All rights reserved worldwide.
|
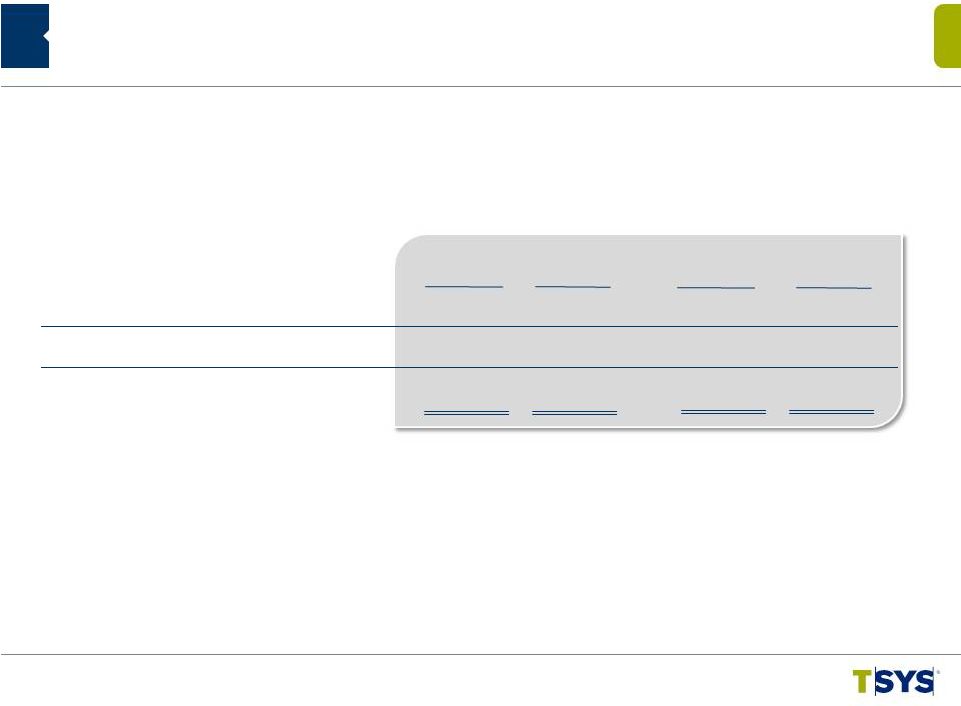
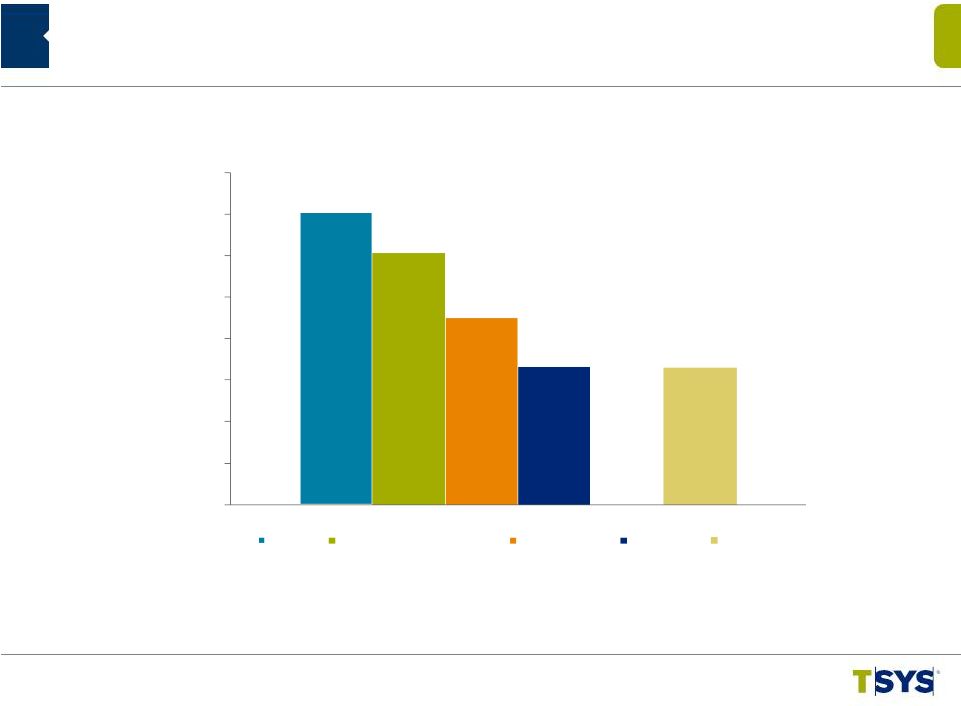 Cash Flow Strength:
2012 Consolidated Financial Highlights
(in millions)
12
$600
$525
$450
$375
$300
$225
$150
$75
$528
$0
$456
$338
$250
$248
EBITDA
Cash flow from operations
Free cash flow
Net income
Ending cash
©2013
Total System Services, Inc.® Proprietary. All rights reserved worldwide.
|
 2013
Guidance 13
Total Revenues
$1,955
to
$1,995
5%
to
7%
Revenues Before Reimbursable Items
1,711
to
1,746
6
to
8
Income attributable
to TSYS Common Shareholders
266
to
272
9
to
11
Earnings per Share from attributable
to TSYS Common Shareholder
$1.43
to
$1.45
10%
to
12%
(in millions, except per share data)
Range
Percent Change
Range
Change
©2013 Total System Services, Inc.® Proprietary. All rights reserved worldwide.
|
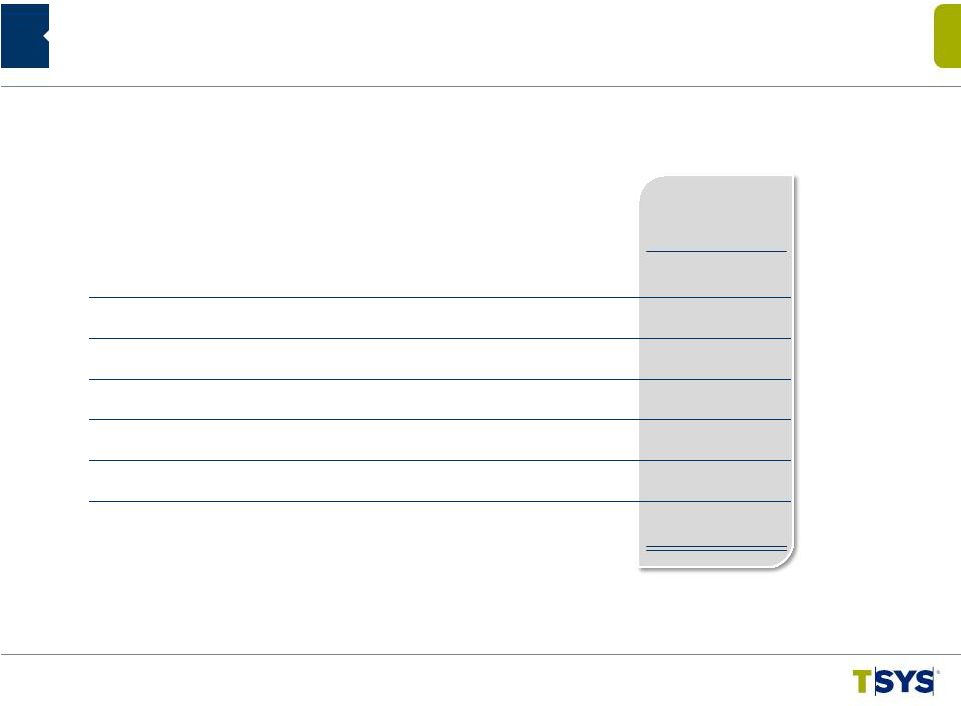
 2013
Guidance Revenue Change Revenues Before Reimbursable Items
14
20%
10%
0%
Internal
Growth
New
Clients
3-4%
Acquisitions
Lost
Business,
Non-recurring
Items and
Price
Compression
(5-7%)
Guidance
6-8%
Currency
5-7%
3-4%
0%
©2013
Total System Services, Inc.® Proprietary. All rights reserved worldwide.
|
 Appendix
People-Centered Payments
©2013 Total System Services, Inc.®
Proprietary. All rights reserved worldwide.
|
 Appendix Non-GAAP Reconciliation –
Revenues Before Reimbursable Items
Three Months
Ended Twelve Months Ended
Total Revenues
$ 472,234
$ 1,870,972
Reimbursable Items
64,551
252,481
268,268
Revenues Before Reimbursable Items
$ 407,683
$ 1,618,491
$ 1,540,698
(in thousands)
16
12/31/12
12/31/11
12/31/11
12/31/12
$ 1,808,966
©2013
Total System Services, Inc.® Proprietary. All rights reserved worldwide.
$ 479,100
60,531
$ 418,569 |
 Operating Income (a)
Total Revenues (b)
Reimbursable Items
Revenues Before
Reimbursable Items(c)
Operating Margin (a)/(b)
Operating Margin Excluding Reimbursables (a)/(c)
Appendix Non-GAAP Reconciliation –
Segment
Operating Margin Excluding Reimbursable Items
North America
International
Merchant
(in thousands)
17
Three Months Ended
Three Months Ended
Three Months Ended
12/31/12
12/31/11
12/31/11
12/31/11
$ 77,801
247,612
33,973
31.42%
36.42%
$ 66,560
246,190
36,572
27.04%
31.75%
107,000
4,573
102,427
106,560
3,768
102,792
129,413
23,558
105,855
126,224
25,845
100,379
5.66%
5.91%
23.52%
11.66%
26.11%
11.25%
28.75%
32.83%
$ 6,058
209,618
213,639
12/31/12
$ 11,983
12/31/12
$ 30,438
©2013
Total System Services, Inc.® Proprietary. All rights reserved worldwide.
$ 32,958 |
 Twelve
Months Ended
12/31/12 12/31/11
Percentage
Change
Three
Months Ended
12/31/12 12/31/11
Percentage
Change
Appendix Non-GAAP Reconciliation –
Constant Currency
(1) Reflects current period results on a non-GAAP basis as if foreign currency
rates did not change from the comparable prior year period. (2) Reflects the
impact of calculated changes in foreign currency rates from the comparable period.
(in thousands)
18
©2013
Total System Services, Inc.® Proprietary. All rights reserved worldwide.
Consolidated:
Constant Currency (1)
$ 479,027
$ 472,234
1.4%
$1,876,979
$ 1,808,966
3.8%
Foreign Currency (2)
73
---
(6,007)
---
Total Revenues
$479,100
$472,234
1.5%
$1,870,972
$1, 808,966
3.4%
International Services:
Constant Currency (1)
$ 106,985
$106,560
0.4%
$ 419,993
$ 394,831
6.4%
Foreign Currency (2)
15
---
(6,526)
---
Total Revenues
$107,000
$106,560
0.4%
$413,467
$394,831
4.7% |
 Appendix Non-GAAP Reconciliation –
EBITDA
Twelve Months
Ended
12/31/2012
(in thousands)
19
©2013
Total System Services, Inc.® Proprietary. All rights reserved worldwide.
Net Income
$ 249,922
Adjusted for:
Deduct: Equity in Income of Equity Investments
(10,171)
Add: Income Taxes
115,103
Add: Nonoperating expense
2,798
Add: Depreciation and Amortization
170,610
EBITDA
$ 528,263 |
 Appendix Non-GAAP Reconciliation –
Free Cash Flow
Twelve Months
Ended
12/31/2012
(in thousands)
20
Cash Flows from Operating Activities
$ 455,753
Less:
Purchase of Property and Equipment
(31,434)
Additions to Licensed Computer Software from Vendors
(33,001)
Additions to Internally Developed Computer Software
(19,285)
Additions to Contract Acquisition Costs
(34,384)
Free Cash Flow
$ 337,649
©2013
Total System Services, Inc.® Proprietary. All rights reserved worldwide.
|