Attached files
| file | filename |
|---|---|
| 8-K - FORM 8-K - CITIZENS REPUBLIC BANCORP, INC. | d470763d8k.htm |
 Investor Presentation
Fourth Quarter 2012
Exhibit 99.1 |
| 2
Safe Harbor Statement
Discussions and statements in this presentation that are not statements of
historical fact (including without limitation statements that include terms such as
“will,”
“may,”
“should,”
“believe,”
“expect,”
“anticipate,”
“estimate,”
“project”,
“intend,”
and “plan”) and statements regarding Citizens’
future financial and
operating results, plans, objectives, expectations and intentions, are
forward- looking statements that involve risks and uncertainties, many
of which are beyond
Citizens’
control or are subject to change. No forward–looking statement is a
guarantee of future performance and actual results could differ
materially. Factors that could cause or contribute to such differences
include, without limitation, risks and uncertainties detailed from time to
time in Citizens’ filings with
the Securities and Exchange Commission.
Other factors not currently anticipated may also materially and adversely affect
Citizens’
results of operations, cash flows, financial position and prospects. There
can be no assurance that future results will meet expectations.
While Citizens
believes that the forward-looking statements in this presentation are
reasonable, you should not place undue reliance on any forward-looking
statement. In addition, these statements speak only as of the date
made. Citizens does not undertake, and expressly disclaims any
obligation to update or alter any statements, whether as a result of new
information, future events or otherwise, except as required by applicable
law. |
| Who
We Are |
 4
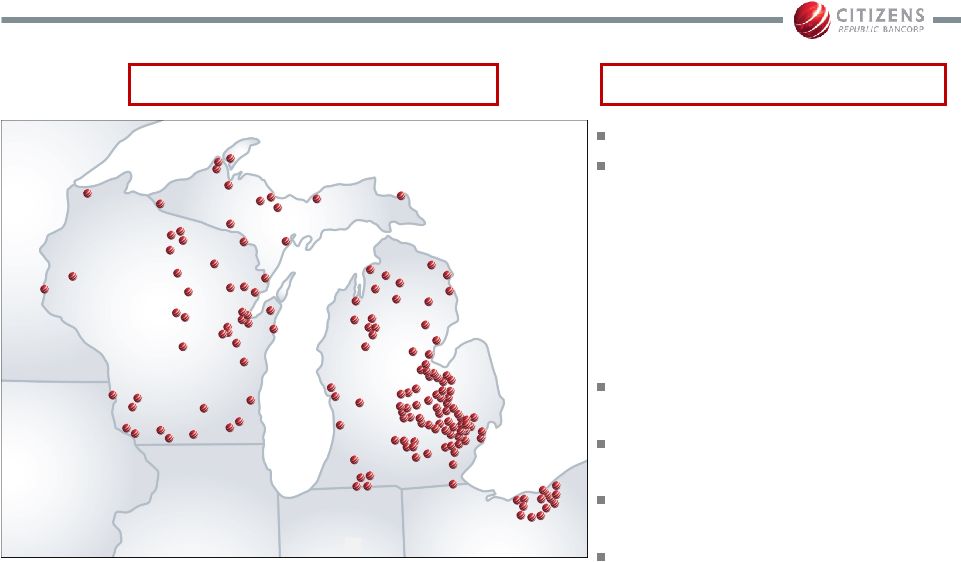
Who We Are
Established in 1871
58
largest
bank
holding
company in the U.S. ranked by
assets
–
$9.6 billion assets and $7.2
billion deposits
–
Presence in 3 Upper
Midwest states with 219
branches and 248 ATMs
Increased market share in 49%
of our counties since 2008
Grew number of new clients by
10%
85% of revenue is Michigan
based
Pending merger with FirstMerit,
expect to close 2Q13
Company Overview
219 Branches / 248 ATMs
th |
 5
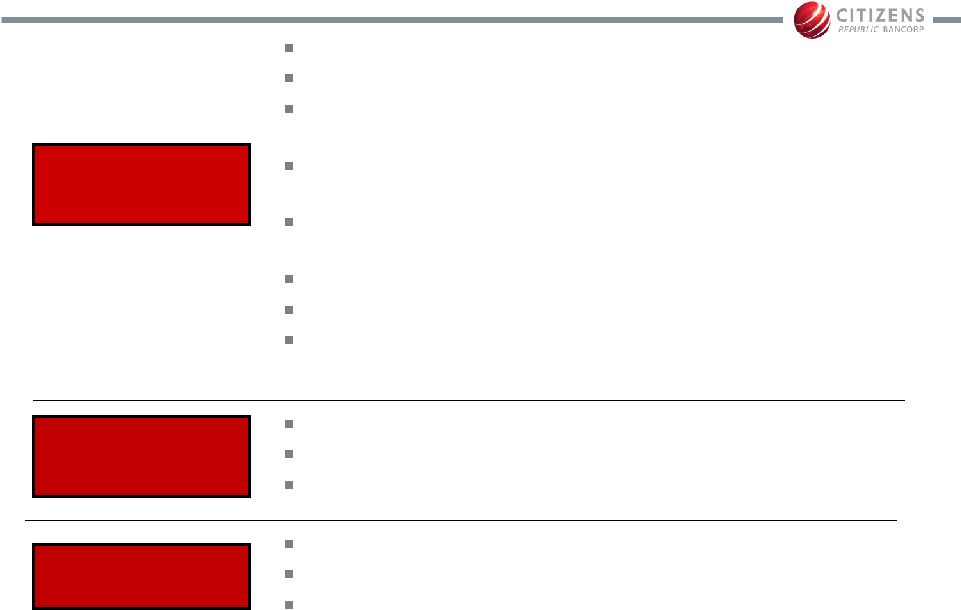
How We Deliver Our Service
Core Banking
87% of revenue
Retail consumer
Commercial clients up to $5 million loan size
Treasury Management: 31% of commercial clients use TM
services
Public Funds: focus on generating lasting relationships rather
than temporary deposits
Preferred SBA Lender: dedicated specialists to fast track
process. Expertise in other state and local loan programs.
Mortgage: accommodate and sell
Indirect marine and RV lending
Investment Center: introduce single service CD clients to
financial consultants
Corporate Banking
9% of revenue
Asset Based Lending
Corporate
Specialty healthcare focus in assisted living & skilled nursing
Wealth Management
4% of revenue
Personal Trust
Employee Benefits
Institutional Trust |
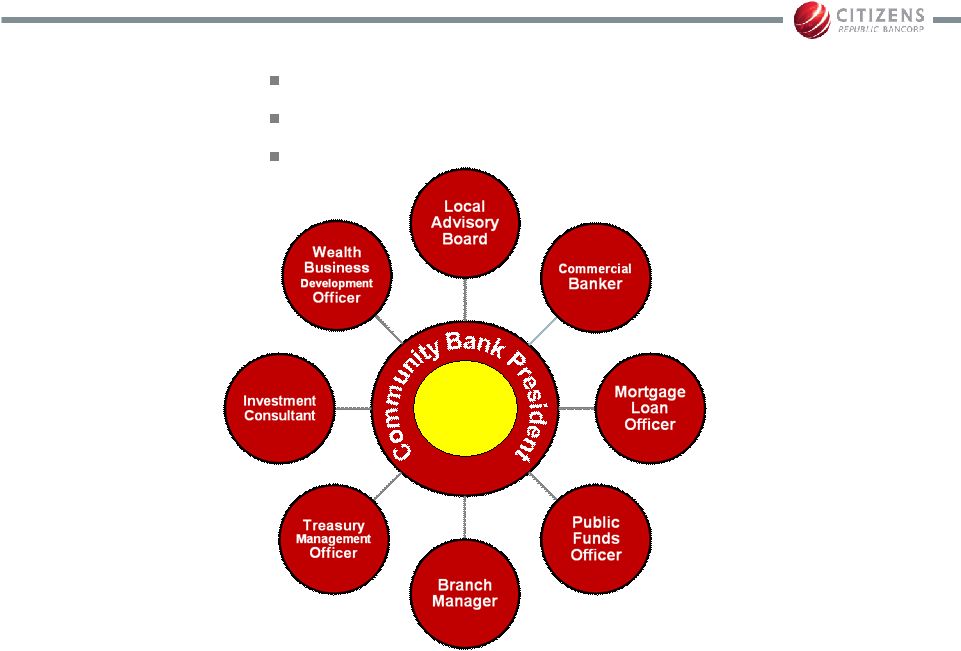 Local
Delivery of Service Local teams focus on delivery of :
Client service
Closing pipeline opportunities
Referring business
6
Client |
| Where We’ve Been |
 8
Strategically Managed Through Cycle
Acquired Michigan-based bank with heavy real
estate concentrations in late 2006
Economic downturn and challenging Michigan
economy resulted in elevated credit costs
Employed strategies to reduce balance sheet risk
Enhanced capital
–
suspended dividend (1Q08)
–
$200 million common equity raise (3Q08)
–
$300 million TARP issuance (4Q08)
–
exchanged sub debt & trust preferred for $200
million of common equity (3Q09) |
 9
Successful Leaders in Key Roles
Name
Title
Held
Position
Since
Cathy Nash
Chief Executive Officer
Feb. 09
Lisa McNeely
Chief Financial Officer
Aug. 10
Mark Widawski
Chief Credit Officer
Feb. 09
Brian Boike
Treasurer
Oct. 09
Judi Klawinski
Director of Core Banking
Oct. 09
Ray Green
Director of Corporate Banking
May 10
Joe Czopek
Controller
Oct. 09
Ken Duetsch
Director of Wealth Management
Aug. 11 |
 Since
2009, focused on clients/revenue while working through credit issues
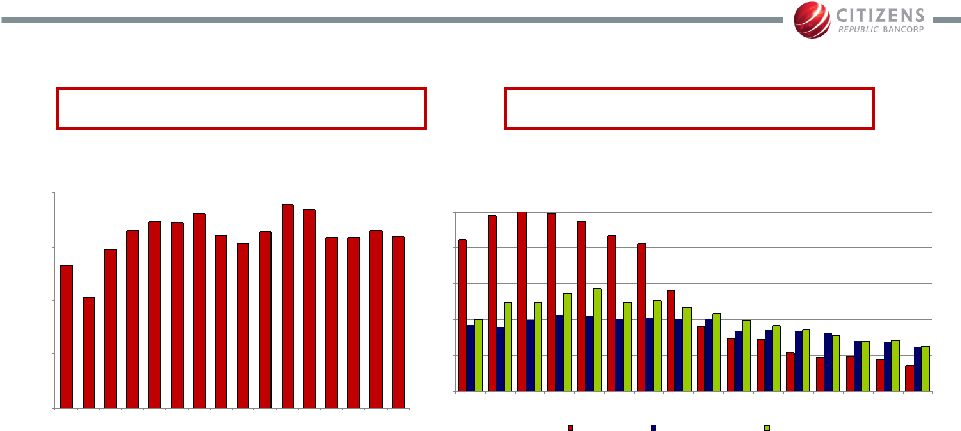
10
$26.6
$20.6
$29.6
$33.1
$34.7
$34.5
$36.2
$32.1
$30.7
$32.8
$37.8
$36.9
$31.7
$31.7
$33.0
$31.8
$0
$10
$20
$30
$40
1Q09
2Q09
3Q09
4Q09
1Q10
2Q10
3Q10
4Q10
1Q11
2Q11
3Q11
4Q11
1Q12
2Q12
3Q12
4Q12
Pre-tax Pre-provision Profit*
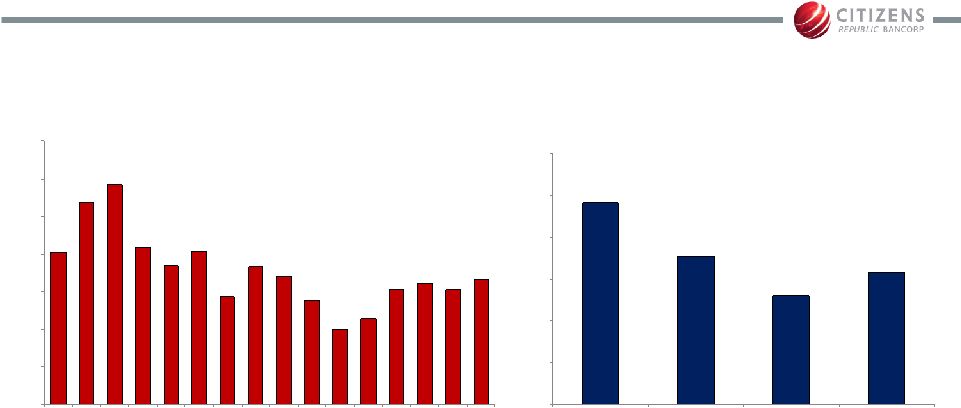
Revenue Focus
Problem Asset Resolution Focus
Strengthened franchise
value
Eliminated uncertainty
around credit
0%
1%
2%
3%
4%
5%
1Q09
2Q09
3Q09
4Q09
1Q10
2Q10
3Q10
4Q10
1Q11
2Q11
3Q11
4Q11
1Q112
2Q12
3Q12
4Q12
NPAs / Assets %
CRBC
Peer Median**
Regional Peer Median**
(in millions)
*
Non-GAAP
measure,
as
defined
by
management,
represents
net
income
(loss)
excluding
income
tax
provision
(benefit)
provision
for
loan
losses,
securities
(gains)/losses,
and
any
impairment
charges
(including
goodwill,
credit
write
downs
and
fair-value
adjustments)
caused
by
this
economic
cycle.
**
Source:
SNL
Financial
MRQ
data |
 Strategy from 2009 –
2010
1.
Preserved capital by managing assets
2.
Grew and maintained reserve levels in recognition of
portfolio risk
11 |
 Strategy from 2009 –
2010
3.
Aggressively and actively worked out of problem assets
4.
Carefully managed capital levels to allow execution of
problem asset reduction
12
Dec. 31,
2009
Dec. 31,
2010
Dec. 31,
2011
Dec. 31,
2012*
Leverage ratio
9.21%
7.71%
8.45%
9.95%
Tier 1 capital ratio
12.52
12.11
13.51
15.67
Total capital ratio
13.93
13.51
14.84
16.93
Tier 1 common
equity (non-GAAP)
8.47
6.62
7.24
9.24
* Estimate |
| Focused on Growth |
 Continue to Provide Top Tier Client Service
14
* Surveys conducted by Prime Performance ™
76
78
80
82
84
86
88
90
Sep 07
Sep 08
Sep 09
Sep 10
Sep 11
Sep 12
Likelihood to Recommend *
Citizens' Score
PPI Industry Average |
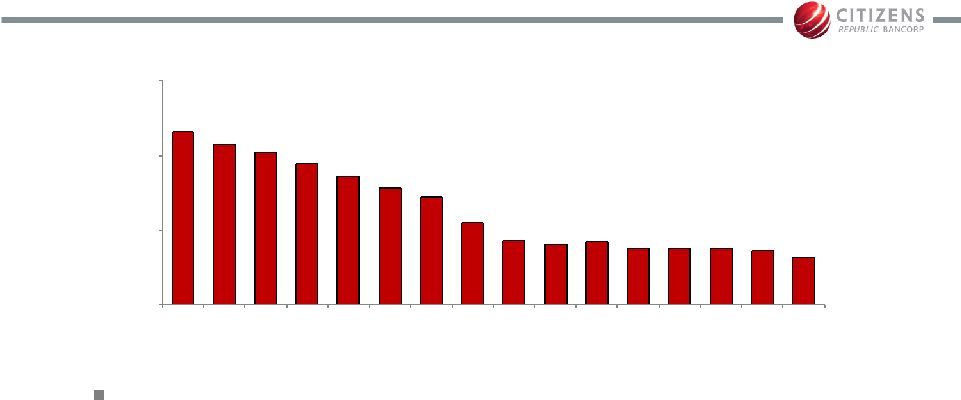 Rebuild Loan Portfolio
Focused on proven competencies
–
Business owner lending
–
Corporate lending –
structured finance, ABL, healthcare
expertise
–
Indirect marine and RV
15
$8,625
$8,302
$8,097
$7,788
$7,439
$7,138
$6,888
$6,217
$5,704
$5,628
$5,672
$5,530
$5,528
$5,522
$5,431
$5,259
$4,000
$6,000
$8,000
$10,000
1Q09
2Q09
3Q09
4Q09
1Q10
2Q10
3Q10
4Q10
1Q11
2Q11
3Q11
4Q11
1Q12
2Q12
3Q12
4Q12
Loan Portfolio Balances
(in millions) |
 Mitigate Expected Margin Pressure
16
2.74%
2.75%
2.99%
3.13%
3.14%
3.35%
3.32%
3.42%
3.53%
3.56%
3.63%
3.62%
3.56%
3.60%
3.57%
3.50%
2.00%
2.50%
3.00%
3.50%
4.00%
1Q09
2Q09
3Q09
4Q09
1Q10
2Q10
3Q10
4Q10
1Q11
2Q11
3Q11
4Q11
1Q12
2Q12
3Q12
4Q12
Net Interest Margin (FTE)
Continue focus on core deposits
Reduce single service CD clients
Manage liquidity levels to reflect
improved credit trends
10,000
12,000
14,000
16,000
18,000
12/31/10
3/31/11
6/30/11
9/30/11
12/31/11
3/31/12
6/30/12
9/30/12
12/31/12
Single Service CD Clients
Fed Funds Sold (average)
(in millions) |
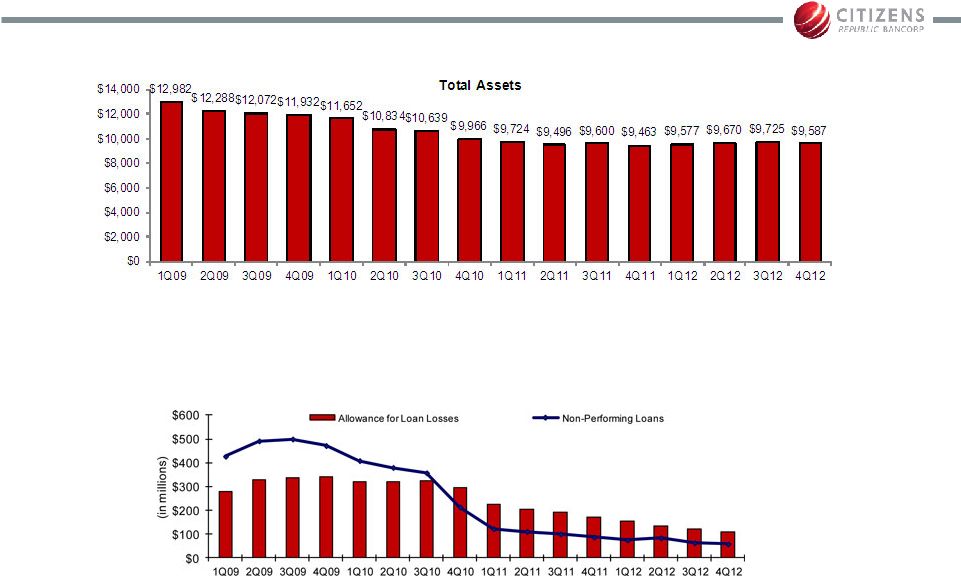
 Reserve Reductions Follow Improved Metrics
17
Reserve model is historical looking; future
modeling will continue to reflect significantly
improved credit metrics
Ensure reserves reflect reduced portfolio risk and
support growth initiatives
0%
1%
2%
3%
4%
5%
1Q09
2Q09
3Q09
4Q09
1Q10
2Q10
3Q10
4Q10
1Q11
2Q11
3Q11
4Q11
1Q12
2Q12
3Q12
4Q12
Loan Loss Reserves / Loans %
CRBC
Peer Median*
Regional Peer Median*
* Source: SNL Financial MRQ data |
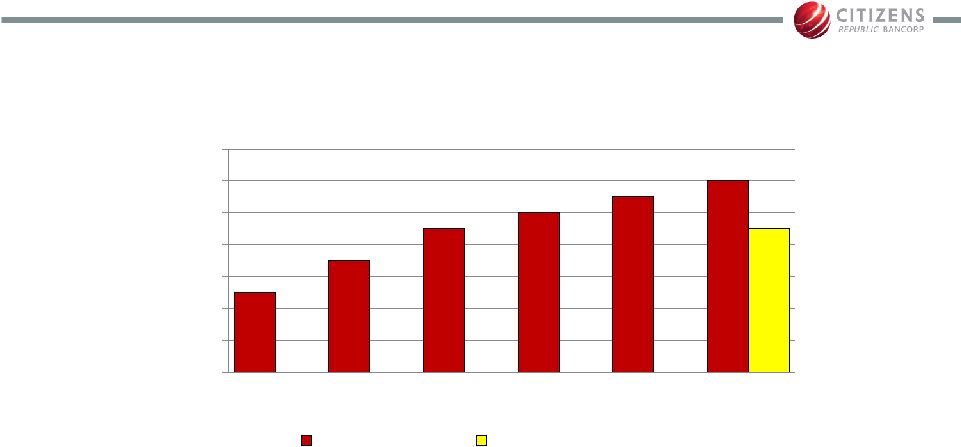
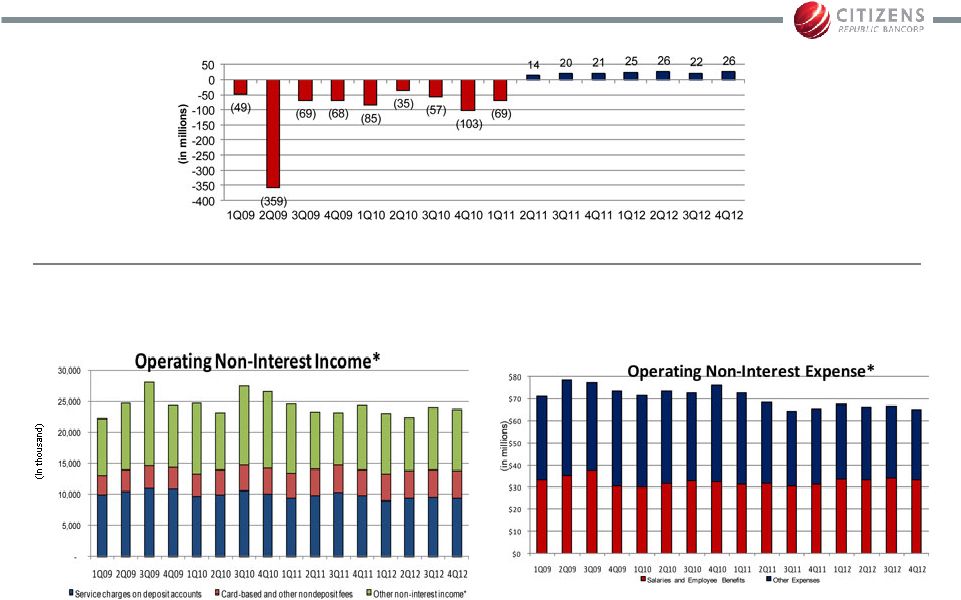 Report Consistent Profits
18
* Excludes discontinued operations
Reprice and add new fee income
streams to replace lost revenue
from regulatory changes
* Non-GAAP measure. See Appendix for reconciliation.
Continue prudent expense
management while adding key
revenue generating positions
Income (Loss) before Tax* |
 19
4Q12 Highlights
Reported consistent quarterly profit from banking
operations
–
Consistent net interest margin at 3.50%
–
Fee income from core banking services remained solid
–
Maintained control over operating expenses
Loan growth in focused areas of expertise
–
7% growth in C&I portfolio since last year
–
11% growth in Indirect portfolio since last year
–
Strong origination and pipeline activity in C&I and Indirect
Continued strong credit metrics and core deposit
funding base have created a lower risk profile balance
sheet |
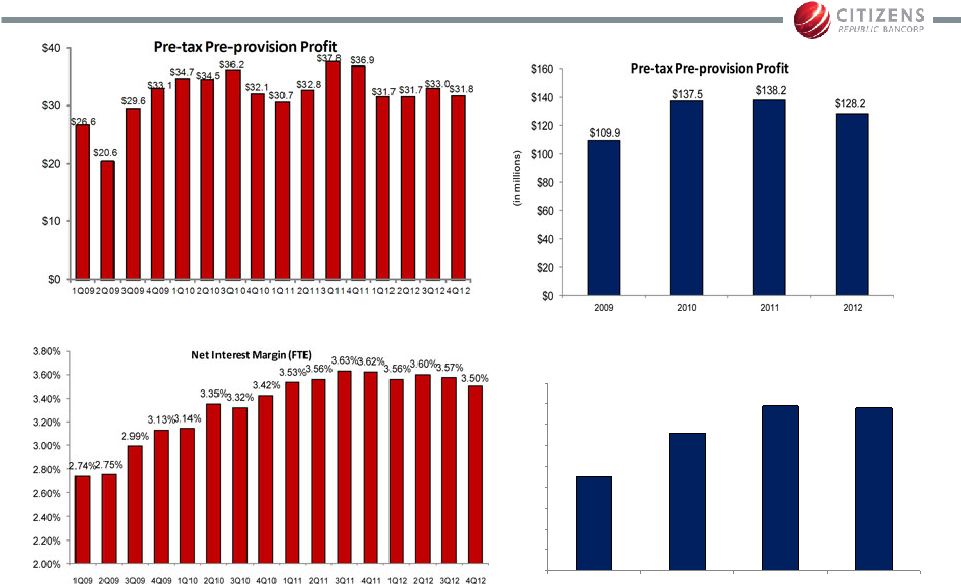 Solid
Core Earnings 20
2.90%
3.31%
3.58%
3.56%
2.00%
2.20%
2.40%
2.60%
2.80%
3.00%
3.20%
3.40%
3.60%
3.80%
2009
2010
2011
2012
Net Interest Margin (FTE) |
 Maintained Expense Control
21
70.2%
76.8%
79.2%
70.9%
68.4%
70.4%
64.2%
68.2%
67.1%
63.9%
59.9%
61.4%
65.2%
66.0%
65.2%
66.7%
50%
55%
60%
65%
70%
75%
80%
85%
1Q09
2Q09
3Q09
4Q09
1Q10
2Q10
3Q10
4Q10
1Q11
2Q11
3Q11
4Q11
1Q12
2Q12
3Q12
4Q12
Quarterly Efficiency Ratio
74.21%
67.73%
63.05%
65.75%
50%
55%
60%
65%
70%
75%
80%
2009
2010
2011
2012
Annual Efficiency Ratio |
    Organically Growing Strong Capital Position
0%
2%
4%
6%
8%
10%
12%
14%
16%
18%
1Q09
2Q09
3Q09
4Q09
1Q10
2Q10
3Q10
4Q10
1Q11
2Q11
3Q11
4Q11
1Q12
2Q12
3Q12
4Q12
Total Capital
Tier 1 Capital
Tier 1 Common (non-GAAP)
22
Accelerated
resolution of
over $920
million of
problem
assets |
 23
Positioned for Growth
Successfully managed through credit cycle with a
strategic focus on revenue generation and problem
asset resolutions
Strategically focused into 2013 to
–
Continue providing top tier client service
–
Rebuild loan portfolio
–
Mitigate expected margin pressure
–
Evaluate reserve levels
–
Report consistent profitability
Pending merger with FirstMerit Corporation (NASDAQ:
FMER) expected to close 2Q13 |
| 24
Appendix |
 25
Upper Midwest Franchise
MSA
Rank
Number
of
Branches
Total
Deposits
($000)
% of
Franchise
% Market
Share
Michigan:
Flint, MI
1
21
1,413,395
19.2
37.84
Detroit-Warren-Livonia, MI
11
31
1,155,621
15.7
1.19
Saginaw-Saginaw Township North,
1
15
614,662
8.4
30.60
Lansing-East Lansing, MI
3
14
527,318
7.2
10.13
Jackson, MI
2
8
372,527
5.1
23.76
Bay City, MI
3
5
216,496
2.9
20.69
Ann Arbor, MI
12
6
211,446
2.9
3.17
Cadillac, MI
1
7
192,242
2.6
36.30
Owosso, MI
3
6
139,177
1.9
20.48
Sturgis, MI
3
4
101,110
1.4
15.27
Total Michigan
8
156
5,923,119
80.7
3.55
Non-Michigan:
Green Bay, WI
5
10
286,993
3.9
4.85
Cleveland-Elyria-Mentor, OH
18
12
279,794
3.8
0.56
Appleton, WI
12
5
105,395
1.4
2.77
Stevens Point, WI
5
2
88,627
1.2
6.89
Platteville, WI
9
4
70,793
1.0
6.02
Total Non-Michigan
60
1,419,936
19.3
Source: SNL Financial as of 6/30/12 |
 26
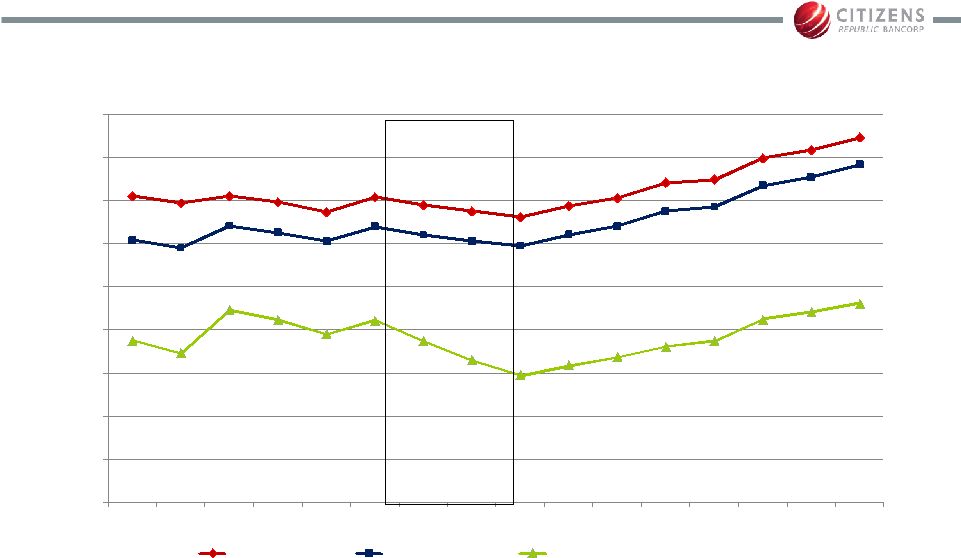
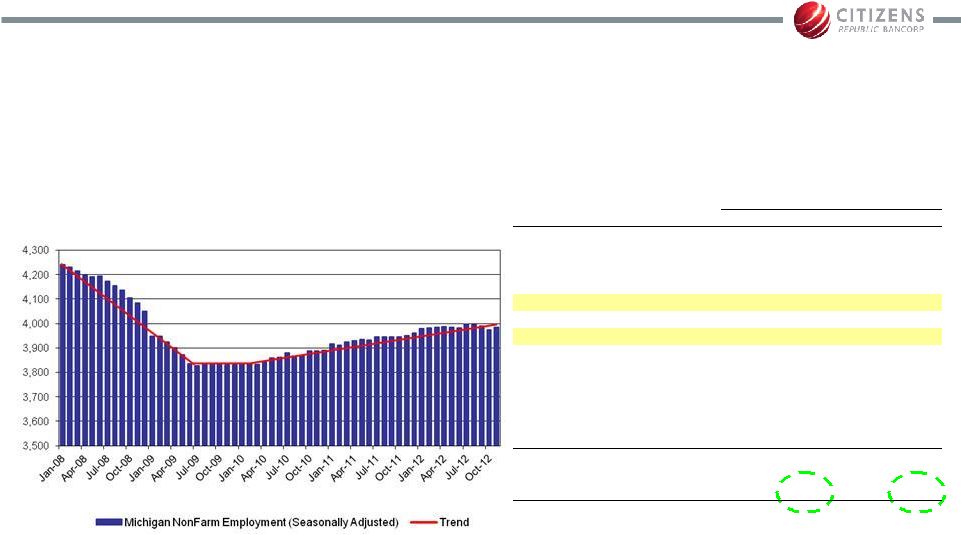
Continued Stabilization and Diversification
in Michigan’s Economy
Source: U.S. Bureau of Labor Statistics
Michigan Nonfarm Employment
Michigan Employment by Industry
Nov. 2012
Nov. 2002
$000s
%
$000s
%
Trade, Transportation, and Utilities
663.5
16.5%
763.3
16.8%
Government
630.3
15.6%
717.9
15.8%
Professional Services
578.1
14.3%
606.7
13.4%
Health Care
554.9
13.8%
477.8
10.5%
Other Manufacturing
391.4
9.7%
479.0
10.6%
Leisure and Hospitality
366.3
9.1%
391.1
8.6%
Motor Vehicle
211.1
5.2%
362.0
8.0%
Financial Activities
198.0
4.9%
213.8
4.7%
Other Services
168.7
4.2%
179.2
3.9%
Construction
124.2
3.1%
201.7
4.4%
Education Services
82.8
2.1%
68.2
1.5%
Information
52.5
1.3%
69.1
1.5%
Mining and Logging
7.3
0.2%
8.8
0.2%
Total Nonfarm
4,029.1
4,538.6
Total Manufacturing
602.5
15.0%
841.0
18.5%
in thousands |
 27
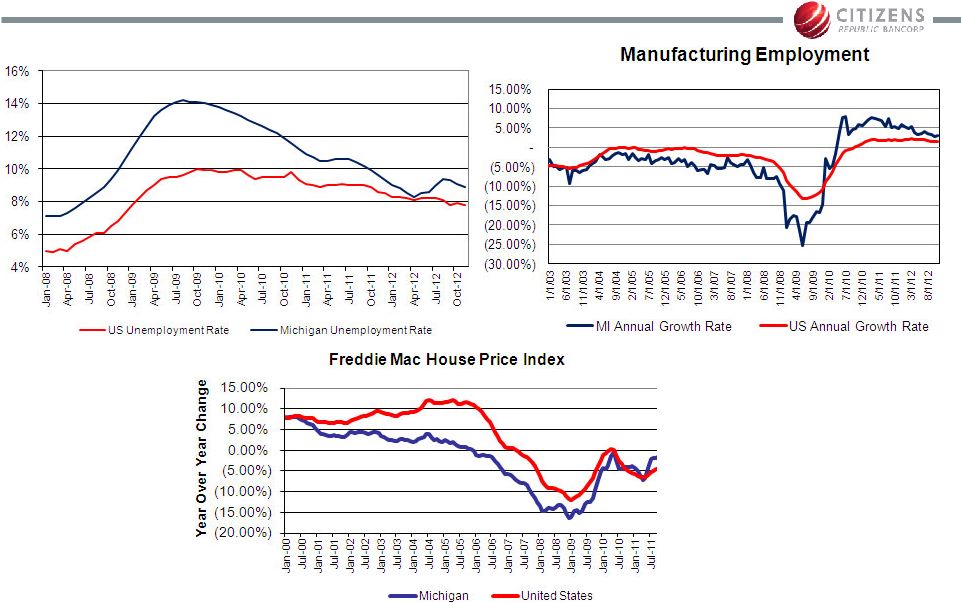
Continued Stabilization and Diversification
in Michigan’s Economy
Source: U.S. Bureau of Labor Statistics and Freddie Mac
Unemployment Trends |
 28
Core Earnings Strength
(1)
Non-GAAP
measure,
as
defined
by
management,
represents
total
revenue
(total
net
interest
income
and
non-interest
income)
excluding
any
securities
gains/losses,
fair
value
adjustments
on
loans
held
for
sale,
interest
rate
swaps,
and
bank
owned
life
insurance,
less
non-interest
expense
excluding
any
goodwill
impairment
charges,
credit
write
downs,
fair
value
adjustments
and
special
assessments.
Pre-Tax Pre-Provision Profit (non-GAAP)
(in millions)
1Q12
2Q12
3Q12
4Q12
Income(loss) from continuing operations
$24.9
$303.2
$21.0
$23.2
Income tax (benefit) provision
-
(276.8)
1.3
2.5
Provision for loan losses
8.4
5.3
5.2
4.3
Investment securities (gains) losses
-
-
-
-
Net losses (gains) on LHFS
(0.9)
(0.0)
0.2
1.7
(Gains) losses on ORE
(0.4)
(0.2)
0.9
(0.6)
Merger related expenses
-
-
4.4
0.6
Fair-value adjustment on BOLI
(0.2)
0.1
(0.0)
0.0
Fair-value adjustment on swaps
(0.1)
0.1
0.1
(0.1)
Pre-Tax Pre-Provision Profit
(1)
$31.7
$31.7
$33.0
$31.8
Last 12 Months
$128.2 |
 29
(in millions)
2009
2010
2011
2012
Income (loss) from continuing operations
($505.7)
($289.1)
$6.7
$372.3
Income tax (benefit) provision
(29.6)
12.9
(20.2)
(273.0)
Provision for loan losses
323.8
392.9
138.8
23.2
Goodwill impairment charge
256.3
-
-
-
Net loss on debt extinguishment
15.9
-
-
-
Investment securities (gains) losses
(0.0)
(13.9)
1.3
-
FDIC special assessment
5.4
-
-
-
Net losses (gains) on LHFS
20.1
20.6
(1.8)
1.0
Losses (gains) on ORE
23.3
13.4
12.8
(0.2)
Merger related expenses
-
-
-
5.0
Fair-value adjustment on BOLI
(0.1)
(0.1)
0.2
(0.1)
Fair-value adjustment on swaps
0.6
0.8
0.4
0.0
Pre-Tax Pre-Provision Profit
(1)
$109.9
$137.5
$138.2
$128.2
Core Earnings Strength
Pre-Tax Pre-Provision Profit (non-GAAP)
(1)
Non-GAAP
measure,
as
defined
by
management,
represents
total
revenue
(total
net
interest
income
and
non-interest
income)
excluding
any
securities
gains/losses,
fair
value
adjustments
on
loans
held
for
sale,
interest
rate
swaps,
and
bank
owned
life
insurance,
less
non-interest
expense
excluding
any
goodwill
impairment
charges,
credit
write
downs,
fair
value
adjustments
and
special
assessments. |
 30
Quarterly Non-Interest Income Trends
(in thousands)
4Q 11
1Q12
2Q12
3Q12
4Q12
Service charges on deposit accounts
$9,724
$8,985
$9,355
$9,554
$9,414
Trust fees
3,747
3,602
3,582
3,635
3,782
Mortgage and other loan income
2,705
1,858
1,952
2,028
2,265
Brokerage and investment fees
1,243
1,324
1,331
1,831
1,569
Card-based and other nondeposit fees
4,305
4,265
4,444
4,431
4,367
Net (losses) gains on loans held for sale
(217)
916
6
(184)
(1,723)
Investment securities gains (losses)
38
-
-
-
-
Other income
2,818
3,290
1,675
2,415
2,350
Total Non-Interest Income (GAAP)
$24,363
$24,240
$22,345
$23,710
$22,024
Investment securities gains (losses)
(38)
$
-
$
-
$
-
$
-
$
Net (losses) gains on loans held for sale
217
(916)
(6)
184
1,723
Fair value adjustment on BOLI
(100)
(205)
118
(31)
47
Fair value adjustment on swaps
(46)
(61)
74
83
(85)
Operating Non-interest Income
(Non-GAAP)
$24,396
$23,058
$22,531
$23,946
$23,709 |
 31
Annual Non-Interest Income Trends
(in thousands)
2009
2010
2011
2012
Service charges on deposit accounts
$42,116
$40,336
$39,268
$37,308
Trust fees
14,784
15,603
15,103
14,601
Mortgage and other loan income
12,393
10,486
9,620
8,104
Brokerage and investment fees
5,194
4,579
5,072
6,055
Card-based and other nondeposit fees
6,283
7,057
17,167
17,507
Bankcard fees
7,714
8,859
Net (losses) gains on loans held for sale
(20,086)
(20,617)
1,808
(984)
Net loss on debt extinguishment
(15,929)
-
-
-
Investment securities gains (losses)
5
13,896
(1,336)
-
Other income
10,659
14,460
8,555
9,729
Total Non-Interest Income (GAAP)
$63,133
$94,659
$95,257
$92,320
Net loss on debt extinguishment
$15,929
-
$
-
$
-
$
Investment securities gains (losses)
(5)
(13,896)
1,336
-
Net (losses) gains on loans held for sale
20,086
20,617
(1,808)
984
Fair value adjustment on BOLI
(144)
(67)
233
(71)
Fair value adjustment on swaps
606
782
413
11
Operating Non-interest Income
(Non-GAAP)
$99,605
$102,095
$95,431
$93,244 |
 32
Quarterly Non-Interest Expense Trends
(in thousands)
4Q 11
1Q12
2Q12
3Q12
4Q12
Salaries and employee benefits
$30,952
$33,298
$32,801
$33,589
$33,163
Occupancy
6,326
6,696
6,140
6,129
6,031
Professional services *
2,311
2,023
2,465
6,806
2,478
Equipment
3,326
3,303
2,904
2,937
2,858
Data processing services
3,709
4,048
3,721
4,427
4,521
Advertising and public relations
1,298
1,335
1,708
1,847
1,014
Postage and delivery
1,165
1,099
1,119
1,157
1,081
Other loan expenses
3,497
3,186
3,266
3,121
3,650
Losses on other real estate (ORE)
1,081
(385)
(173)
941
(596)
ORE expenses
995
450
266
323
220
Intangible asset amortization
688
578
545
513
484
Other expense
11,292
11,470
11,577
10,265
10,224
Total Non-Interest Expense (GAAP)
$66,640
$67,101
$66,339
$72,055
$65,128
Merger related expenses
-
-
-
4,411
597
Losses (gains) on ORE
1,081
(385)
(173)
941
(596)
Operating Non-Interest Expense
(Non-GAAP)
$65,559
$67,486
$66,512
$66,703
$65,127
* Includes merger related expenses |
 33
Annual Non-Interest Expense Trends
(in thousands)
2009
2010
2011
2012
Salaries and employee benefits
$135,389
$126,384
$123,514
$132,850
Occupancy
26,723
26,963
26,059
24,997
Professional services
11,877
10,550
9,331
13,772
Equipment
11,714
12,482
12,136
12,001
Data processing services
17,692
18,734
16,131
16,717
Advertising and public relations
7,113
6,530
5,848
5,904
Postage and delivery
5,525
4,571
4,543
4,456
Other loan expenses
24,553
20,311
16,007
13,224
Losses on other real estate (ORE)
23,312
13,438
12,768
(214)
ORE expenses
4,389
4,970
4,322
1,259
Intangible asset amortization
7,036
3,923
3,027
2,120
Goodwill impairment
256,272
-
-
-
Other expense
53,544
58,231
49,464
43,536
Total Non-Interest Expense (GAAP)
$585,139
$307,087
$283,150
$270,622
Goodwill impairment
256,272
$
-
$
-
$
-
$
FDIC Special Assessment
5,351
-
-
-
Merger-related expenses
-
-
-
5,008
Fair-value adjustment on ORE
23,312
13,438
12,768
(214)
Operating Non-Interest Expense
(Non-GAAP)
$300,204
$293,649
$270,382
$265,828 |
 34
($ in millions)
Market
% of
Credit Rating
Value
Total
Gov't & Agency
2,711
$
91.0%
AAA
15
0.5%
AA
137
4.6%
A
34
1.2%
BAA1, BAA2 & BAA3
51
1.7%
BA1 & Lower
14
0.5%
Non-rated
18
0.6%
Total
2,980
$
100.0%
•
Over $2.2 billion in unpledged securities
•
No OTTI concerns
•
Over 70% of portfolio are GNMA securities
purchased over the last 2 –
3 years
($ in millions)
Book
Market
TEY*
Duration
Type
Value
Value
(%)
(years)
MBS Agency
893
$
933
$
2.61%
1.46
CMO - Agency
594
601
1.82%
3.54
CMO - Non-agency
60
61
3.43%
2.52
Municipals
97
103
6.21%
2.50
Total Available for Sale
1,644
$
1,698
$
2.57%
2.31
MBS Agency
844
$
883
$
2.99%
2.18
CMO - Agency
283
293
1.96%
1.22
Municipals
99
106
6.00%
3.54
Total Held to Maturity
1,226
$
1,282
$
2.99%
2.07
Total Investment Securities
2,870
$
2,980
$
2.75%
2.21
Investment Portfolio at December 31, 2012
* Taxable equivalent yield, except for Municipal yields which are before tax
effect Effective Management of Securities Portfolio Provides
Source of Liquidity |
 35
($ in millions)
12/31/09
12/31/10
3/31/11
6/30/11
9/30/11
12/31/11
3/31/12
6/30/12
9/30/12
12/31/12**
Tier 1 capital
$ 1,067
$ 777
$ 706
$ 727
$ 758
$ 773
$ 795
$ 860
$ 878
$ 892
Qualifying LLR
109
83
76
74
75
73
74
74
73
72
Qualifying capital securities
10
7
3
3
3
3
-
-
-
- Total risk-based capital
$ 1,186
$ 867
$ 785
$ 805
$ 836
$ 850
$ 869
$ 934
$ 951
$ 964
Tier 1 capital
$ 1,067
$ 777
$ 706
$ 727
$ 758
$ 773
$ 795
$ 860
$ 878
$ 892
Qualifying capital securities
(74)
(74)
(74)
(74)
(74)
(74)
(74)
(74)
(74)
(74)
Preferred stock
(272)
(278)
(280)
(282)
(283)
(285)
(287)
(289)
(291)
(292)
Tier 1 common equity
$ 721
$ 425
$ 352
$ 371
$ 401
$ 415
$ 435
$ 497
$ 514
$ 526
Total Capital Ratio
13.93%
13.51%
13.24%
13.77%
14.14%
14.84%
14.97%
15.96%
16.35%
16.93%
Tier 1 Capital Ratio
12.52%
12.11%
11.90%
12.43%
12.81%
13.51%
13.70%
14.70%
15.09%
15.67%
Tier 1 Leverage Ratio
9.21%
7.71%
7.39%
7.83%
8.21%
8.45%
8.71%
9.77%
9.66%
9.95%
Tier 1 Common Ratio *
8.47%
6.62%
5.93%
6.36%
6.77%
7.24%
7.49%
8.50%
8.83%
9.24%
TCE to TA *
6.16%
4.20%
3.59%
4.05%
4.31%
4.47%
4.68%
7.73%
7.91%
8.15%
** Estimate
TA - tangible assets
* Non-GAAP
TCE - tangible common equity
Maintaining Strong Capital Levels |
 36
Non-GAAP Common Equity Ratios
($ in thousands)
4Q11
1Q12
2Q12
3Q12
4Q12*
Total assets
$9,463
$9,577
$9,670
$9,725
$9,587
Goodwill
(318)
(318)
(318)
(318)
(318)
Other intangible assets
(7)
(7)
(6)
(6)
(5)
Tangible assets
$9,137
$9,252
$9,346
$9,401
$9,263
Total shareholders' equity
$1,020
$1,045
$1,336
$1,358
$1,371
Goodwill
(318)
(318)
(318)
(318)
(318)
Other intangible assets
(7)
(7)
(6)
(6)
(5)
Tangible equity
$694
$720
$1,011
$1,034
$1,047
Preferred stock
(285)
(287)
(289)
(291)
(292)
Tangible common equity
$409
$433
$723
$744
$755
Total shareholders' equity
$1,020
$1,045
$1,336
$1,358
$1,371
Qualifying capital securities
74
74
74
74
74
Goodwill
(318)
(318)
(318)
(318)
(318)
Disallowed tax assets
-
-
(236)
(235)
(242)
Accumulated other comprehensive income
6
2
10
6
13
Other assets
(7)
(7)
(6)
(6)
(5)
Total Tier 1 capital (regulatory)
$773
$795
$860
$878
$892
Qualifying capital securities
(74)
(74)
(74)
(74)
(74)
Preferred stock
(285)
(287)
(289)
(291)
(292)
Total Tier 1 common equity (non-GAAP)
$415
$435
$497
$514
$526
Net risk-weighted assets (regulatory)
$5,723
$5,804
$5,852
$5,822
$5,695
Tangible common equity to tangible assets ratio
4.47%
4.68%
7.73%
7.91%
8.15%
Tier 1 common equity ratio (non-GAAP)
7.24%
7.49%
8.50%
8.83%
9.24%
(1)
Other assets deducted from Tier 1 capital and risk-weighted assets consist of
intangible assets (excluding goodwill) * Estimate
(¹)
(1) |
 $0
$20
$40
$60
$80
$100
$120
$140
$160
$180
1Q09
2Q09
3Q09
4Q09
1Q10
2Q10
3Q10
4Q10
1Q11
2Q11
3Q11
4Q11
1Q12
2Q12
3Q12
4Q12
37
Proactive Credit Management
$0
$50
$100
$150
$200
$250
1Q09
2Q09
3Q09
4Q09
1Q10
2Q10
3Q10
4Q10
1Q11
2Q11
3Q11
4Q11
1Q12
2Q12
3Q12
4Q12
30-89 Day Past Due
Portfolio Balances
Non-Performing Loans
($ in millions)
$0
$50
$100
$150
$200
$250
$300
$350
$400
$450
$500
$550
1Q09
2Q09
3Q09
4Q09
1Q10
2Q10
3Q10
4Q10
1Q11
2Q11
3Q11
4Q11
1Q12
2Q12
3Q12
4Q12
Net Charge-Offs
$0
$2,000
$4,000
$6,000
$8,000
$10,000
1Q09
2Q09
3Q09
4Q09
1Q10
2Q10
3Q10
4Q10
1Q11
2Q11
3Q11
4Q11
1Q12
2Q12
3Q12
4Q12 |
 $0
$5
$10
$15
$20
$25
$30
$35
1Q09
2Q09
3Q09
4Q09
1Q10
2Q10
3Q10
4Q10
1Q11
2Q11
3Q11
4Q11
1Q12
2Q12
3Q12
4Q12
$0
$20
$40
$60
$80
$100
$120
1Q09
2Q09
3Q09
4Q09
1Q10
2Q10
3Q10
3Q10
4Q10
1Q11
2Q11
3Q11
4Q11
1Q12
2Q12
3Q12
4Q12
$0
$10
$20
$30
$40
$50
$60
1Q092Q093Q094Q091Q102Q103Q104Q101Q112Q113Q114Q111Q122Q123Q124Q12
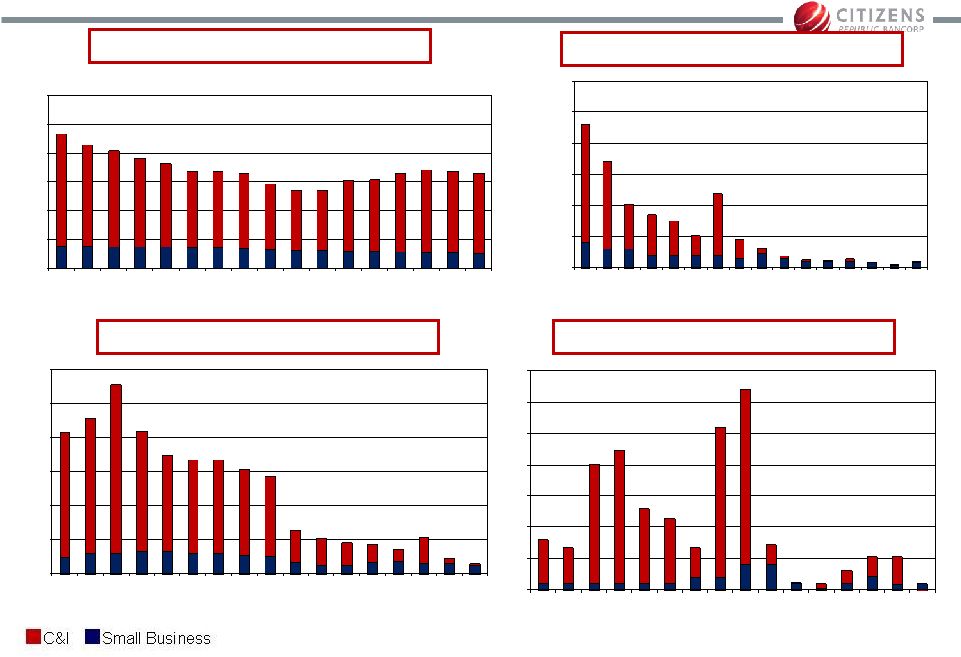
38
Commercial & Industrial Portfolio
$0
$500
$1,000
$1,500
$2,000
$2,500
$3,000
1Q09
2Q09
3Q09
4Q09
1Q10
2Q10
3Q10
3Q10
4Q10
1Q11
2Q11
3Q11
4Q11
1Q12
2Q12
3Q12
4Q12
30-89 Day Past Due
Portfolio Balances
($ in millions)
Non-Performing Loans
Net Charge-Offs |
 39
Commercial Portfolio Size Characteristics
< $5 million
$5 - $10 million
> $10 million
Total
Total Commercial Portfolio
Total (millions)
1,823
$
515
$
561
$
2,899
$
# of loans
6,791
74
37
6,902
Average loan size
$268,000
$6,954,000
$15,162,000
$420,000
Delinquencies
Total (millions)
4
$
-
$
-
$
4
$
# of loans
33
-
-
33
Average loan size
$125,000
-
$
-
$
$125,000
Nonperforming Loans
Total (millions)
27
$
-
$
-
$
27
$
# of loans
162
-
-
162
Average loan size
$164,000
-
$
-
$
$164,000
Loan size category: |
 $0
$40
$80
$120
$160
$200
$240
$280
$320
1Q09
2Q09
3Q09
4Q09
1Q10
2Q10
3Q10
4Q10
1Q11
2Q11
3Q11
4Q11
1Q12
2Q12
3Q12
4Q12
$0
$20
$40
$60
$80
$100
$120
$140
1Q09
2Q09
3Q09
4Q09
1Q10
2Q10
3Q10
4Q10
1Q11
2Q11
3Q11
4Q11
1Q12
2Q12
3Q12
4Q12
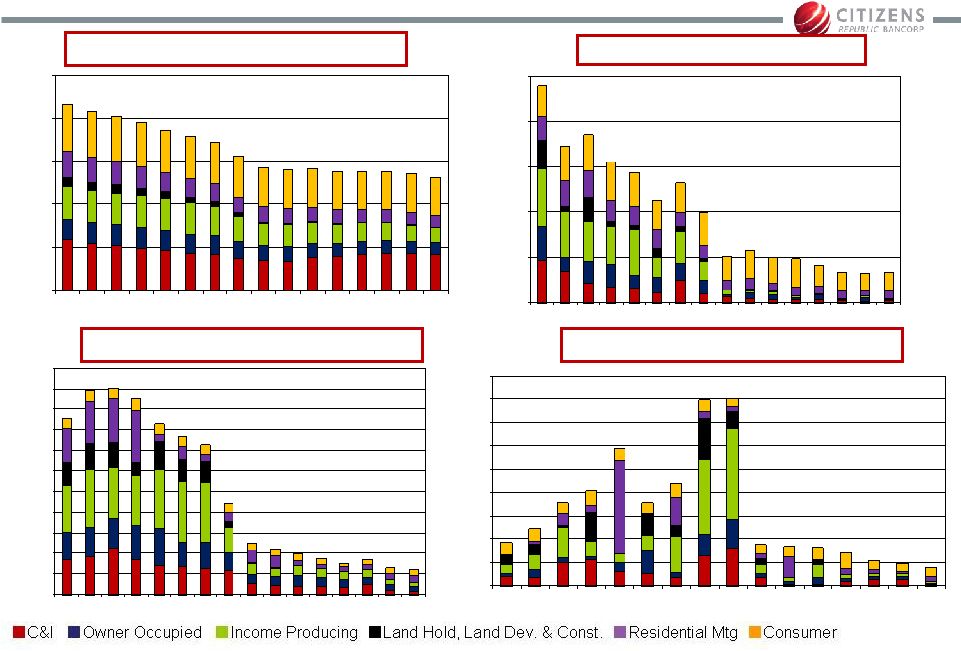
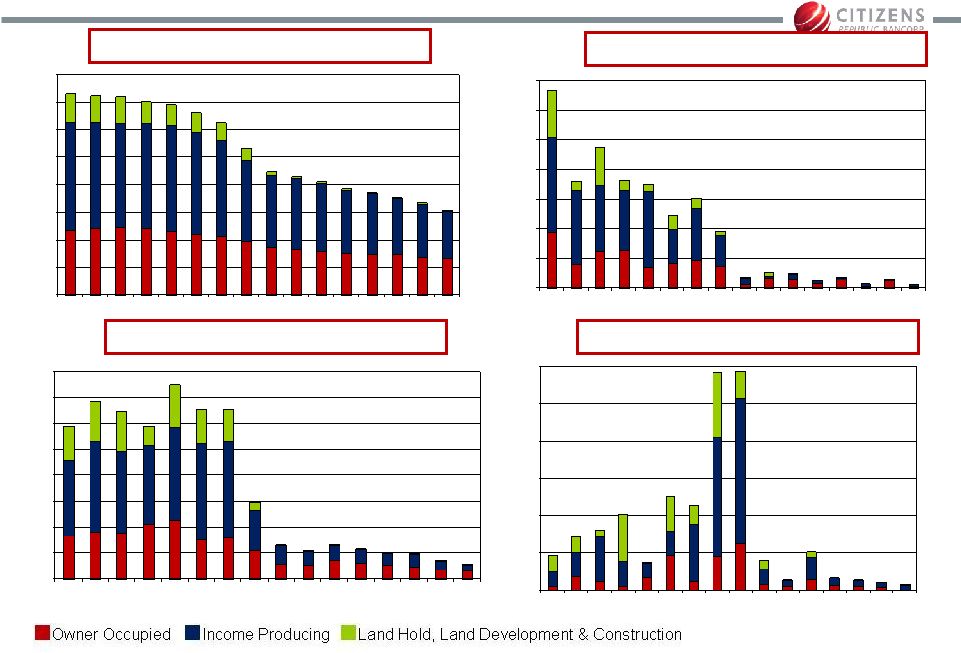
40
Commercial Real Estate Portfolio
$0
$400
$800
$1,200
$1,600
$2,000
$2,400
$2,800
$3,200
1Q09
2Q09
3Q09
4Q09
1Q10
2Q10
3Q10
4Q10
1Q11
2Q11
3Q11
4Q11
1Q12
2Q12
3Q12
4Q12
30-89 Day Past Due
Portfolio Balances
($ in millions)
Non-Performing Loans
$0
$20
$40
$60
$80
$100
$120
1Q09
2Q09
3Q09
4Q09
1Q10
2Q10
3Q10
4Q10
1Q11
2Q11
3Q11
4Q11
1Q12
2Q12
3Q12
4Q12
Net Charge-Offs |
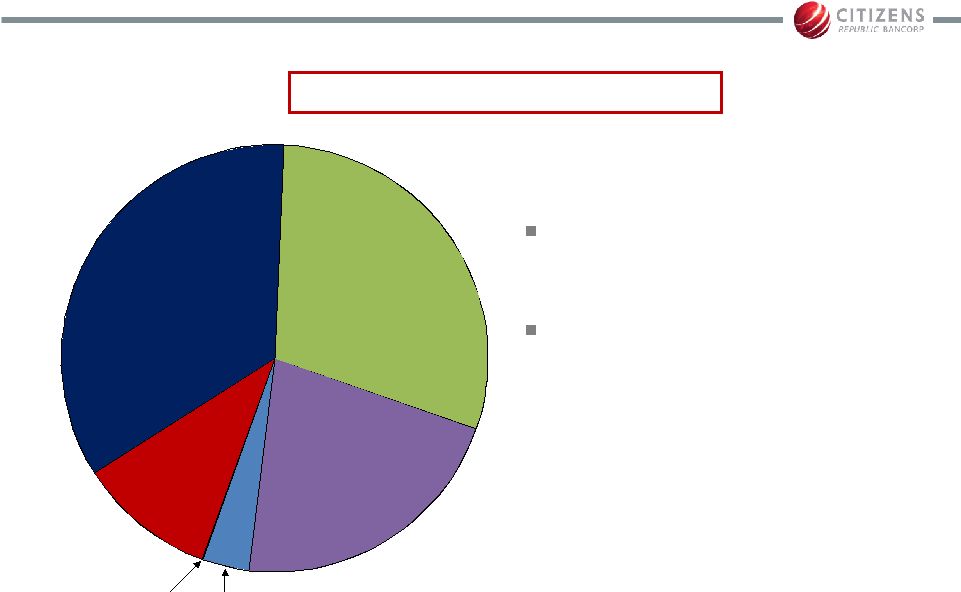
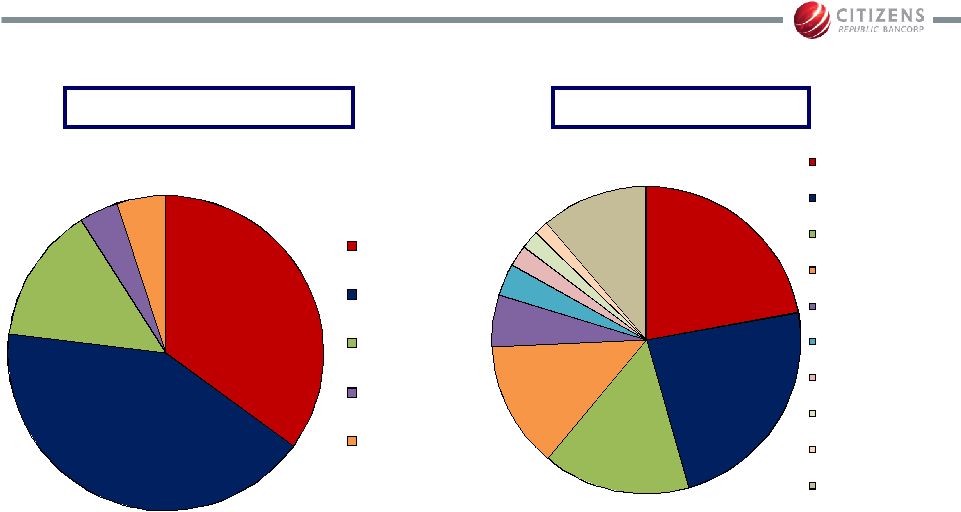 41
Commercial Real Estate Portfolio
35%
42%
14%
4%
5%
Southeast
Michigan
Greater
Michigan
Ohio
Wisconsin
Other
22%
23%
16%
13%
5%
3%
2%
2%
1%
11%
Retail
Medical
Warehouse/
Industrial
Office
Multi-Family
Hotel
Mixed Use
Gas Station/ C.Store
Residential
Other (<1%)
By Collateral
By Region |
 $0
$20
$40
$60
$80
$100
1Q09
2Q09
3Q09
4Q09
1Q10
2Q10
3Q10
4Q10
1Q11
2Q11
3Q11
4Q11
1Q12
2Q12
3Q12
4Q12
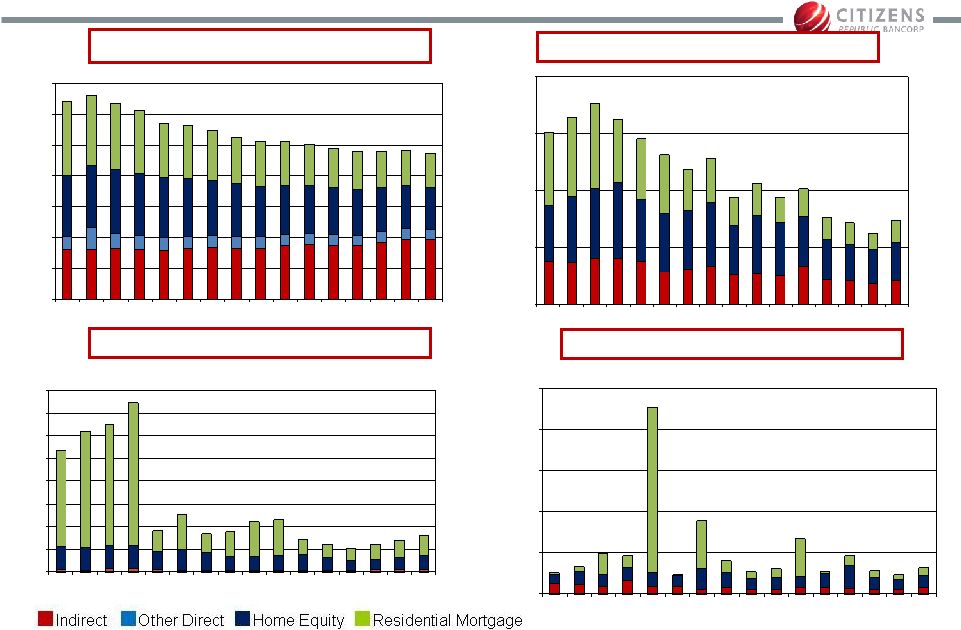
42
Consumer Portfolio
$0
$20
$40
$60
$80
1Q09
2Q09
3Q09
4Q09
1Q10
2Q10
3Q10
4Q10
1Q11
2Q11
3Q11
4Q11
1Q12
2Q12
3Q12
4Q12
30-89 Day Past Due *
Portfolio Balances
Non-Performing Loans *
Net Charge-Offs *
$0
$500
$1,000
$1,500
$2,000
$2,500
$3,000
$3,500
1Q09
2Q09
3Q09
4Q09
1Q10
2Q10
3Q10
4Q10
1Q11
2Q11
3Q11
4Q11
1Q12
2Q12
3Q12
4Q12
($ in millions)
$0
$20
$40
$60
$80
$100
$120
$140
$160
1Q09
2Q09
3Q09
4Q09
1Q10
2Q10
3Q10
4Q10
1Q11
2Q11
3Q11
4Q11
1Q12
2Q12
3Q12
4Q12
* Other direct included with Home Equity
|
 43
Consumer Portfolio Profiles
Home Equity
$35,900 avg
loan size
Indirect
(1)
$24,300 avg
loan size
(1) Indirect loans are RV and marine only (no auto)
Consumer Portfolio
Strong refreshed FICO scores
741 Home Equity
742 Indirect
728 Other Direct
45% of home equity is first lien position
Indirect NPLs have been less than
$2.6 million, or 0.33% of total,
throughout the cycle
Other
Direct
$19,500 avg
loan size
Residential Mortgage Portfolio
$162,000 average loan size
717 refreshed FICO score
67% average original LTV
Seasoned portfolio –
52% originated
2004 or earlier
Foreclosures are handled by PHH;
Michigan does not follow a judicial
foreclosure process
Michigan
84%
Ohio
6%
Wisconsin
4%
Other
6% |
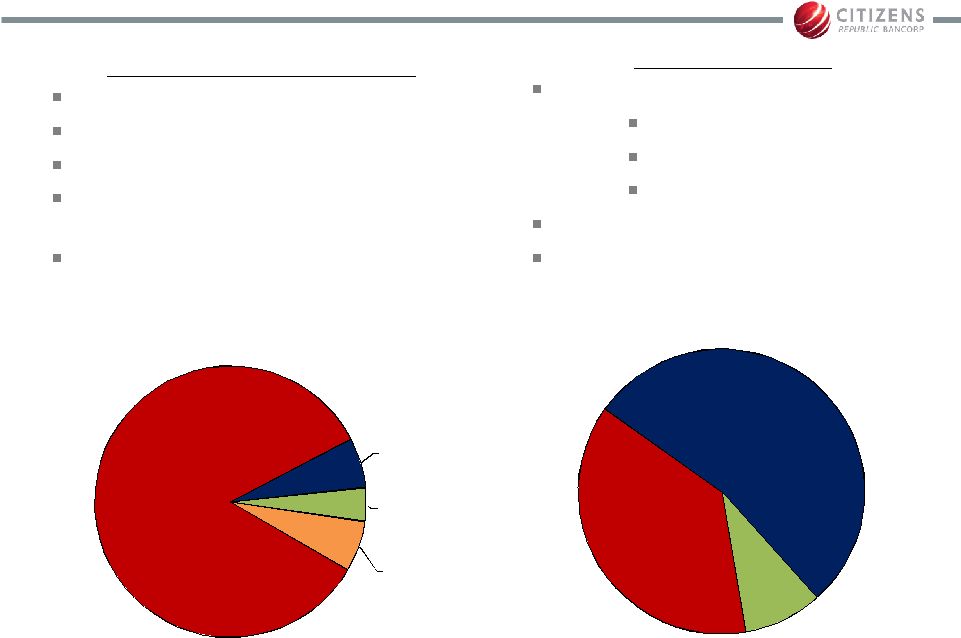
 44
Non-Performing Loans
Commercial
Real Estate
$20.5
34.7%
Commercial
$6.2
10.4%
Residential
Mortgage
$17.5
29.7%
($ in millions)
Direct
Consumer
$12.7
21.6%
$59.0 million or 1.12% of portfolio
Indirect
Consumer
$2.1
3.5%
Loans 90+
Accruing
$0.01
Loan loss reserve = $110.4
million
Allowance for loan losses to
NPLs = 187.2% |
 45
(in millions)
1Q12
2Q12
3Q12
4Q12
Beginning NPAs
$102.2
$90.6
$94.0
$86.2
Commercial:
Additions
14.0
23.8
4.6
4.8
Payments
(5.1)
(12.0)
(21.0)
(7.9)
Returned to accruing status
(3.9)
(0.5)
(1.3)
-
Charge-Offs/ OREO writedown
(13.1)
(6.0)
(6.2)
(5.8)
Consumer - net change
(3.9)
3.4
3.6
4.1
Held For Sale - net change
0.9
(2.4)
15.8
(13.5)
OREO - net change
(0.6)
(3.0)
(3.1)
0.1
Ending NPAs
$90.6
$94.0
$86.2
$68.0
Aggressive Non-Performing Asset Management
Quarterly Non-Performing Asset Activity
*
* 2Q12 inflows and 3Q12 outflows include a single $14 million relationship
* |
 46
Peer Groups
Company Name
Ticker
Company Name
Ticker
Associated Banc-Corp
ASBC
Huntington Bancshares Incorporated
HBAN
Comerica Incorporated
CMA
KeyCorp
KEY
Commerce Bancshares, Inc.
CBSH
MB Financial, Inc.
MBFI
Fifth Third Bancorp
FITB
Old National Bancorp
ONB
First Midwest Bancorp, Inc.
FMBI
PNC Financial Services Group, Inc.
PNC
FirstMerit Corporation
FMER
TCF Financial Corporation
TCB
Flagstar Bancorp, Inc.
FBC
Wintrust Financial Corporation
WTFC
Company Name
Ticker
Company Name
Ticker
Associated Banc-Corp
ASBC
MB Financial, Inc.
MBFI
BancorpSouth, Inc.
BXS
National Penn Bancshares, Inc.
NPBC
Chemical Financial Corporation
CHFC
Old National Bancorp
ONB
Commerce Bancshares, Inc.
CBSH
Park National Corporation
PRK
Cullen/Frost Bankers, Inc.
CFR
Sterling Financial Corporation
STSA
F.N.B. Corporation
FNB
Susquehanna Bancshares, Inc.
SUSQ
First Citizens BancShares, Inc.
FCNCA
TFS Financial Corporation (MHC)
TFSL
First Midwest Bancorp, Inc.
FMBI
Trustmark Corporation
TRMK
FirstMerit Corporation
FMER
UMB Financial Corporation
UMBF
Flagstar Bancorp, Inc.
FBC
Valley National Bancorp
VLY
Fulton Financial Corporation
FULT
Wintrust Financial Corporation
WTFC
Regional Peers
Selected Peers |
 www.citizensbanking.com |