Attached files
| file | filename |
|---|---|
| 8-K - FORM 8-K - People's United Financial, Inc. | d470101d8k.htm |
| EX-99.1 - EARNINGS PRESS RELEASE - People's United Financial, Inc. | d470101dex991.htm |
 4
th
Quarter
2012
Earnings
Conference
Call
January 17, 2013
Exhibit 99.2 |
 1
Certain statements contained in this release are forward-looking in nature. These include all
statements about People's United Financial's plans, objectives, expectations and other
statements that are not historical facts, and usually use words such as "expect,"
"anticipate," "believe," "should" and similar expressions. Such
statements represent management's current beliefs, based upon information available at the time
the statements are made, with regard to the matters addressed. All forward-looking statements
are
subject
to
risks
and
uncertainties
that
could
cause
People's
United
Financial's
actual
results
or
financial
condition
to
differ
materially
from
those
expressed
in
or
implied
by
such
statements.
Factors
of
particular importance to People’s United Financial include, but are not limited to: (1) changes
in general, national or regional economic conditions; (2) changes in interest rates; (3)
changes in loan default and charge-off rates; (4) changes in deposit levels; (5) changes in
levels of income and expense in non- interest income and expense related activities; (6)
residential mortgage and secondary market activity; (7) changes in accounting and regulatory
guidance applicable to banks; (8) price levels and conditions in the public securities markets
generally; (9) competition and its effect on pricing, spending, third-party relationships
and revenues; (10) the successful integration of acquisitions; and (11) changes in regulation
resulting from or relating to financial reform legislation. People's United Financial does not
undertake any obligation to update or revise any forward-looking statements, whether as a
result of new information, future events or otherwise.
Forward-Looking Statement |
 2
2012 Results
Overview / 2012 vs. 2011
Operating earnings grew 10% to $254 million
Operating EPS grew 14% to $0.75
Operating return on average assets was 90 basis points, up 1 basis point
Operating return on average tangible equity was 8.5%, up 130 basis points
Efficiency ratio improved to 62.4% from 64.0%
Asset quality remained strong
NPAs as a percentage of originated loans, REO and repossessed assets
improved to 1.48%
NCOs to average loans remained low at 21 basis points
Dividend yield of 5% in 2012*
* Using average stock price in 2012 |
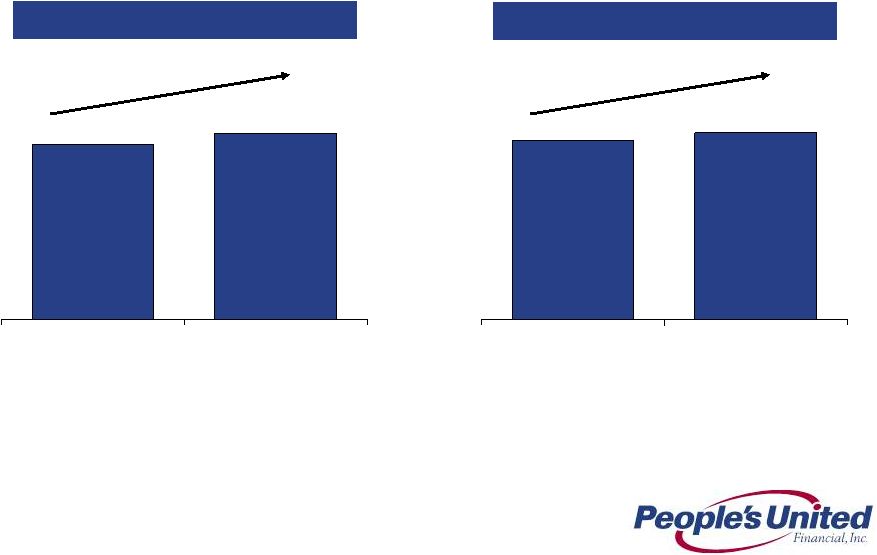 3
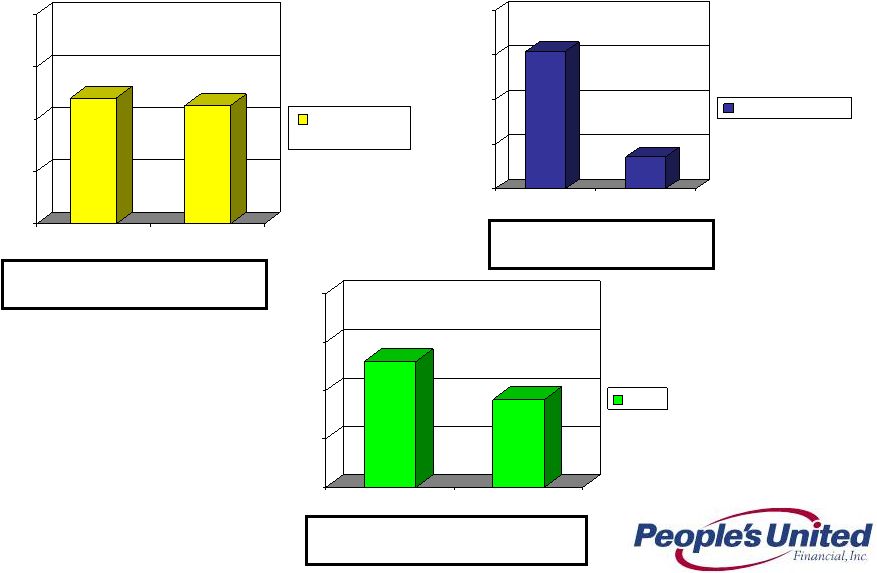
Balance Sheet Performance
2011 -
2012
$20.4
$21.7
2011
2012
Loans ($BN)
7%
$20.8
$21.8
2011
2012
Deposits ($BN)
4% |
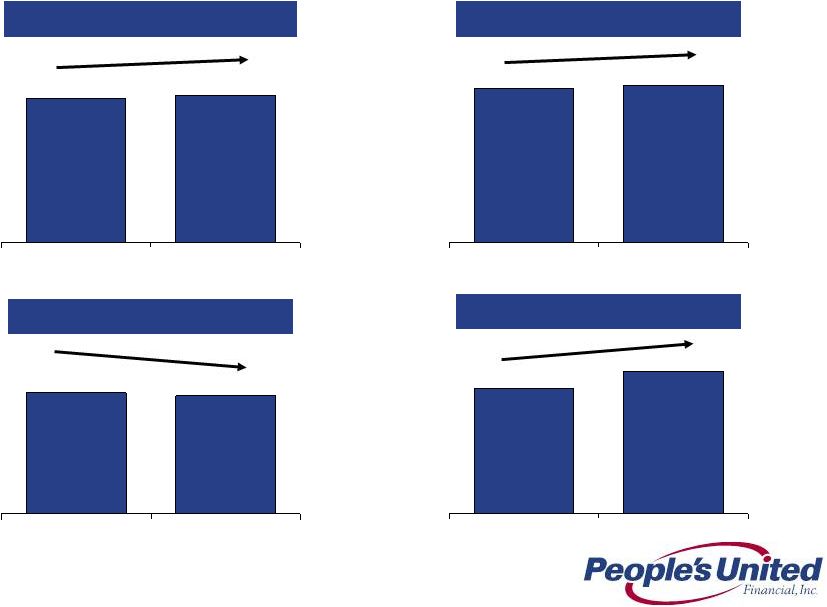 4
64.0%
62.4%
2011
2012
Income Statement Performance
2011 -
2012
$913
$929
2011
2012
Net Interest Income ($MM)
$1,221
$1,243
2011
2012
Revenue ($MM)
Efficiency Ratio (%)
$0.66
$0.75
2011
2012
Operating EPS |
 5
2013 Goals
Execution Driving Performance
Grow loans in the high single digits to mid-teens
Continued
momentum
from
current
initiatives
combined
with
slower
run-off
from the acquired loan portfolio
Increase deposits in the mid single digits
Net interest income target range of $900 to $940 million
Implies net interest margin in the 3.30-3.40% range
Fee income growth in the mid single digits
Full year operating expense target range of $815 to $825 million
Maintain a fortress balance sheet with continued excellent credit quality
and strong capital levels |
 6
Fourth Quarter 2012 Results
Overview / 4Q 2012 vs. 3Q 2012
Operating earnings of $63.2 million or $0.19 per share, versus $0.19 per share
in the prior quarter
Operating net interest margin of 3.63%, down 19 bps
Loan growth of $697 million, 13.3% annualized growth rate
Deposit growth of $388 million, 7.3% annualized growth rate
Non-interest income increased $2.9 million to $84.3 million
Efficiency ratio was 63.1% compared to 61.4% last quarter
Net charge-offs were 19bps in line with 18bps last quarter
Continued optimization of capital
Repurchased 4.7 million shares, or $56.3 million, at a weighted average
price of $11.95 per share
Announced 10% share repurchase authorization
Issued $500 million in senior notes at a coupon of 3.65%
TCE/TA ratio decreased to 10.2% from 11.2% as we continued to efficiently
deploy capital |
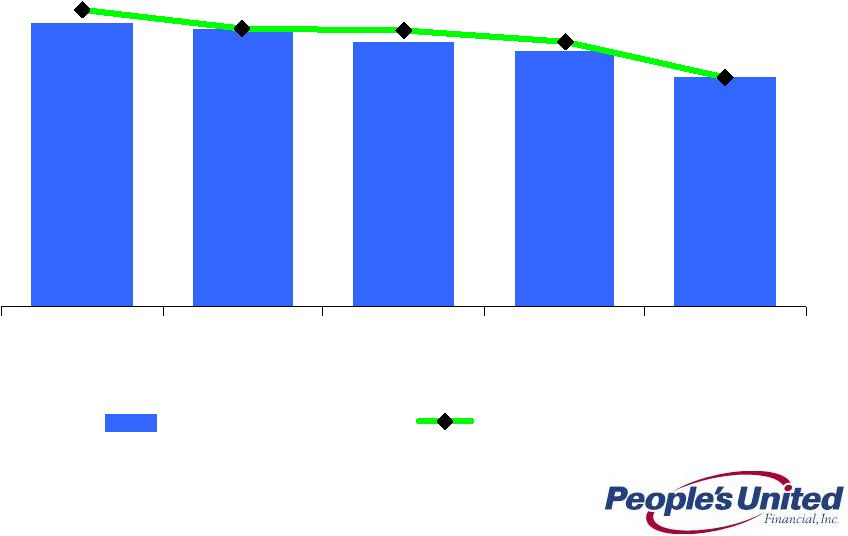 7
Net Interest Margin (%)
4.03
3.97
3.88
3.82
3.63
4.12
3.97
3.96
3.89
3.63
4Q 2011
1Q 2012
2Q 2012
3Q 2012
4Q 2012
Margin- Operating
Margin- GAAP |
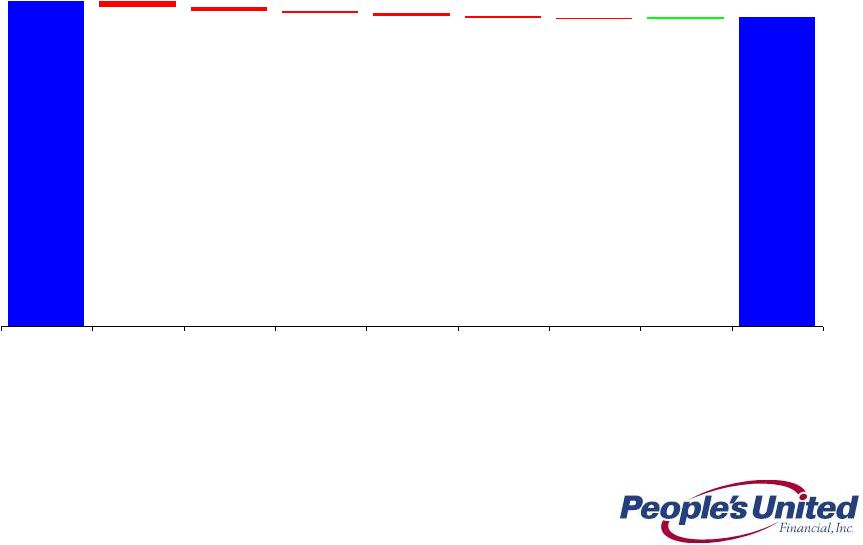 8
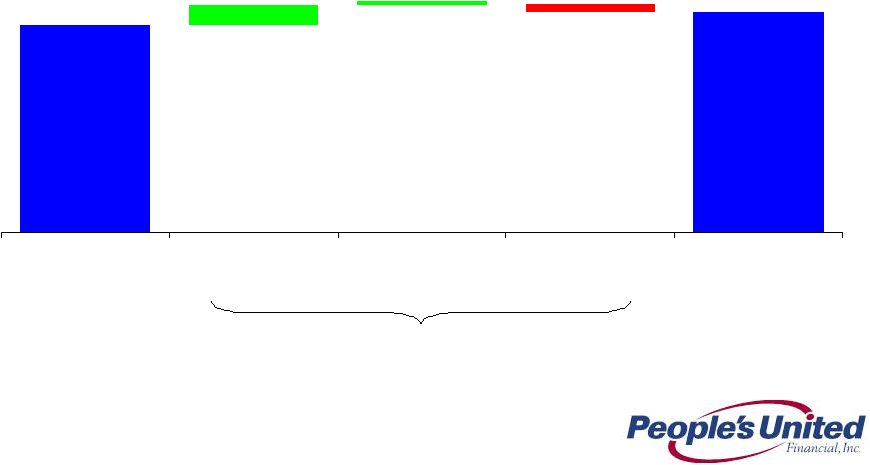
Operating Net Interest Margin (%) -
Decrease from 3Q 2012
3.82%
3.63%
(0.07%)
(0.02%)
0.03%
(0.02%)
(0.05%)
(0.04%)
(0.02%)
3Q 2012
Margin
New loan
volume
Acquired
loan
accretion
Loan
repricing/
amortization
Investments
Senior Notes
Danvers CD
FV Adj
Deposit
Rates/ Mix
4Q 2012
Margin |
 9
Acquired Loan Portfolio
Acquired loans initially recorded at fair value (inclusive of related credit mark)
without carryover of historical ALLL
Accounting model is cash-flow based:
Contractual
cash
flows
(principal
&
interest)
less
Expected
cash
flows
(principal
&
interest)
=
non-accretable
difference (effectively utilized to absorb actual portfolio losses)
Expected cash flows (principal & interest) less fair value = accretable
yield Expected cash flows are regularly reassessed and compared to actual cash
collections As of 12/31/2012
(in $ millions)
Carrying
Amount
a, b
Carrying Amount Component
b
NPLs
c
Non-Accretable
Difference/NPLs
Charge-offs
Incurred Since
Acquisition
Accretable
Yield
Non-Accretable
Difference
FinFed (2/18/10)
$150.5
$11.8
$7.7
$28.2
27%
$11.3
Butler (4/16/10)
60.4
22.6
13.7
8.0
171%
7.9
RiverBank (11/30/10)
237.8
98.2
10.5
22.9
46%
4.5
Smithtown (11/30/10)
768.5
428.6
117.3
74.7
157%
126.1
Danvers (7/1/11)
1,020.9
329.0
18.6
47.8
39%
17.5
Total
$2,238.1
$890.2
$167.8
$181.6
(a)
Initial carrying amounts of acquired portfolios are as follows: FinFed, $1.2BN;
Butler, $141MM; RiverBank, $518MM; Smithtown, $1.6BN; and Danvers,
$1.9BN. (b)
Carrying amount and related components reflect loan sale, settlement and payoff
activity which have occurred since acquisition. (c)
Represent contractual amounts; loans meet People’s United Financial’s
definition of a non-performing loan but are not subject to
classification as non-accrual in the same manner as originated loans. Rather,
these loans are considered to be accruing loans because their interest
income relates to the accretable yield recognized at the pool level and not to contractual interest payments
at the loan level. |
 10
Acquired Loan Portfolio
Amortization of Original Discount on Acquired Loan Portfolio
Note:
$ in millions, except per share data
Impact on Net Interest Margin
Impact on Earnings Per Share
4Q12 Total Accretion (All interest income on acquired loans)
42
Interest Income from Amortization of Original Discount on Acq. Loan
Portfolio 9.7
3Q12 Acquired Loan Portfolio Carrying Amount
2,634
4Q12 Effective Tax Rate
32%
4Q12 Acquired Loan Portfolio Carrying Amount
2,238
4Q12 Average Acquired Loan Portfolio
2,436
4Q12 Earnings from Amortiz. of Original Discount on Acq. Loan Portfolio
6.6
Effective Yield on Acquired Loan Portfolio
6.86%
4Q12 Weighted Average Shares Outstanding
331.4
Weighted Average Coupon on Acquired Loan Portfolio
1
5.27%
4Q12 EPS Impact from Amortiz. of Discount on Acq. Loan Portfolio
$0.02
Incremental Yield Attributable to Amortiz. of Discount on Acq. Loan Portfolio
1.59%
Incremental Interest Income from Amortiz. of Discount on Acq. Loan Portfolio
9.7
4Q12 Average Earning Assets
25,206
Add: Average unamortized loan discount
2
72
Adjusted 4Q12 Average Earning Assets
25,278
Impact on Overall Net Interest Margin (bps)
15
Operating Net Interest Margin
3.63%
Adjusted Net Interest Margin
3.48%
Amortization of Original Discount on Acquired Loan Portfolio
Amortization of Original Discount on Acquired Loan Portfolio
1.
Excluding FinFed, the weighted average coupon on the acquired loan portfolio is 4.98%
2.
Represents the difference between the outstanding balance of the acquired loan portfolio and the
carrying amount of the acquired loan portfolio
|
 11
Loans
Linked Quarter Change
(in $ millions)
Annualized Linked QTD change
13.3%
1,075
(396)
18
21,040
21,737
Sep 30, 2012
Commercial Banking
Retail
Acquired
Dec 31, 2012 |
 12
Deposits
Linked Quarter Change
(in $ millions)
Total
21,363
21,751
Commercial
Retail
Annualized linked QTD change
6.7%
8.8%
Annualized Linked QTD change- Total
7.3%
15,742
16,006
5,745
5,621
264
124
Sep 30, 2012
Retail
Commercial
Dec 31, 2012 |
 13
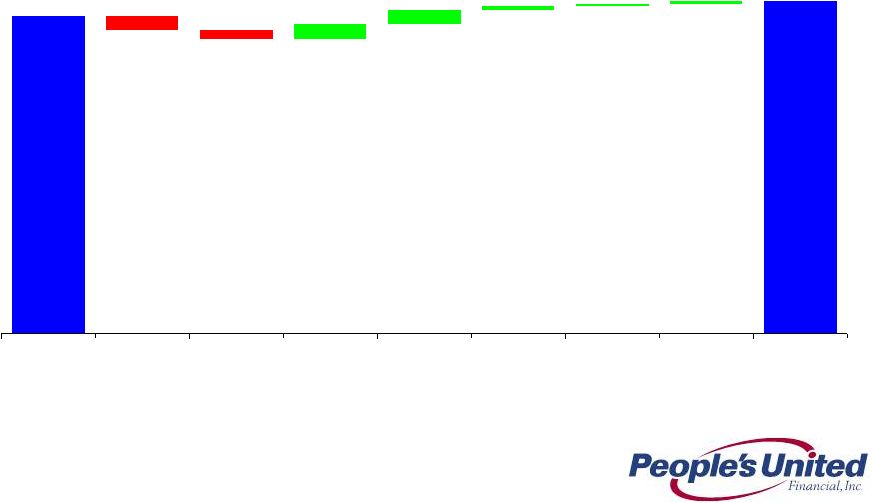
Non-Interest Income
Linked Quarter Change
(in $ millions)
81.4
84.3
(1.6)
(2.8)
0.8
0.3
0.7
2.7
2.8
3Q 2012
Insurance
Bank
Service
Charges
Gain on
Loan Sales
Loan
Prepayment
Fees
Gain on
Branch Sale
Trust &
Brokerage
Fees
Other
4Q 2012 |
 14
Non-Operating
Operating
Total
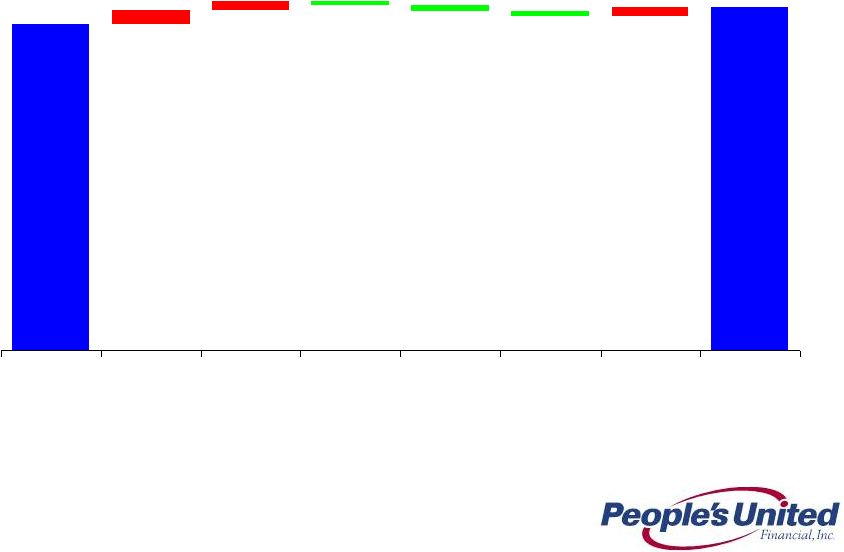
Non-Interest Expense
Linked Quarter Change
(in $ millions)
208.9
207.4
(0.3)
205.7
(2.4)
(1.8)
1.9
1.5
(0.4)
204.5
2.9
3.2
3Q 2012
Non-
Operating
REO
Expense
Vesting-
Initial
RRP/SOP
Grant
Occupancy
& Equip
Prof &
Outside Svc
Other
4Q 2012 |
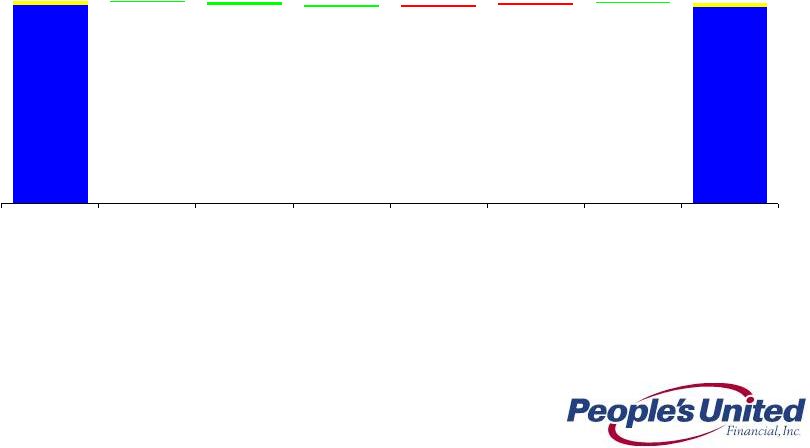
 15
0.9
63.1
(0.4)
(0.4)
0.8
1.4
(0.6)
61.4
3Q 2012
Acquired
Loan
Accretion
Cost
Recovery
Income
Other net
interest
income
Non
interest
income
Operating
expense
REO/
Gains/
other adjs
4Q 2012
Efficiency Ratio (%)
Linked Quarter Change
Notes:
1.
Expense
items
classified
as
“other”
and
deducted
from
non-interest
expense
for
purposes
of
calculating
the
efficiency ratio include, as applicable, certain franchise taxes, REO expenses,
contract termination costs and non-recurring expenses
Revenue
items
classified
as
“other”
and
added
to
(deducted
from)
total
revenues
for
purposes
of
calculating
the
efficiency ratio include, as applicable, asset write-offs and gains associated
with the sale of branch locations 1 |
 16
Efficiency Ratio (%)
Since 1Q 2010
76.1%
73.1%
72.4%
71.9%
66.0%
65.5%
62.4%
62.3%
63.6%
61.5%
61.4%
63.1%
1Q
2010
2Q
2010
3Q
2010
4Q
2010
1Q
2011
2Q
2011
3Q
2011
4Q
2011
1Q
2012
2Q
2012
3Q
2012
4Q
2012 |
 17
1.59
1.48
1.98
2.70
1.00
2.00
3.00
4.00
1Q 2010
2Q 2010
3Q 2010
4Q 2010
1Q 2011
2Q 2011
3Q 2011
4Q 2011
1Q 2012
2Q 2012
3Q 2012
4Q 2012
PBCT
Peer Group Median
Top 50 Banks by Assets
Since 1Q 2010
Asset Quality
NPAs / Loans & REO* (%)
*
Non-performing
assets
(excluding
acquired
non-performing
loans)
as
a
percentage
of
originated
loans
plus
all
REO
and
repossessed
assets;
acquired
non-performing
loans
excluded
as
risk
of
loss
has
been
considered
by
virtue
of
(i)
our
estimate
of acquisition-date fair value, (ii) the existence of an FDIC loss sharing
agreement, and/or (iii) allowance for loan losses established subsequent to
acquisition Source: SNL Financial and Company filings
|
 18
Since 1Q 2010
0.18
0.19
0.41
0.59
0.00
0.50
1.00
1.50
2.00
1Q 2010
2Q 2010
3Q 2010
4Q 2010
1Q 2011
2Q 2011
3Q 2011
4Q 2011
1Q 2012
2Q 2012
3Q 2012
4Q 2012
PBCT
Peer Group Median
Top 50 Banks
Asset Quality
Net Charge-Offs / Avg. Loans (%)
Source: SNL Financial and Company filings |
 19
Allowance for Loan Losses
Originated Portfolio Coverage Detail
(in $ millions)
1.20%
1.13%
0.00%
0.50%
1.00%
1.50%
2.00%
NPLs:Loans
ALLL:Loans
Commercial
Banking
1.54%
0.36%
0.00%
0.50%
1.00%
1.50%
2.00%
NPLs:Loans
ALLL:Loans
Retail Banking
Commercial ALLL -
$157.5 million
95% of Commercial NPLs
Retail ALLL -
$20.0 million
23% of Retail NPLs
Total ALLL -
$177.5 million
70% of Total NPLs
1.30%
0.91%
0.00%
0.50%
1.00%
1.50%
2.00%
NPLs:Loans
ALLL:Loans
Total |
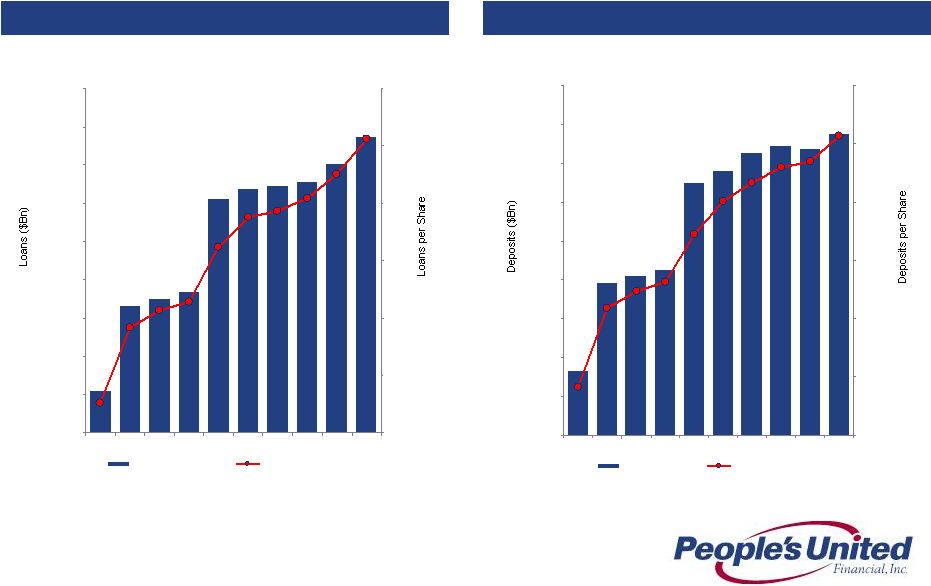 20
Loans
Deposits
Growing Future Earnings Per Share
Loans and Deposits per Share
$65.59
$14
$15
$16
$17
$18
$19
$20
$21
$22
$23
3Q10
4Q10
1Q11
2Q11
3Q11
4Q11
1Q12
2Q12
3Q12
4Q12
$40
$45
$50
$55
$60
$65
$70
Gross Loans ($BN)
Loans per Share
$65.64
$14
$15
$16
$17
$18
$19
$20
$21
$22
$23
3Q10
4Q10
1Q11
2Q11
3Q11
4Q11
1Q12
2Q12
3Q12
4Q12
$40
$45
$50
$55
$60
$65
$70
Deposits ($BN)
Deposits per Share |
 21
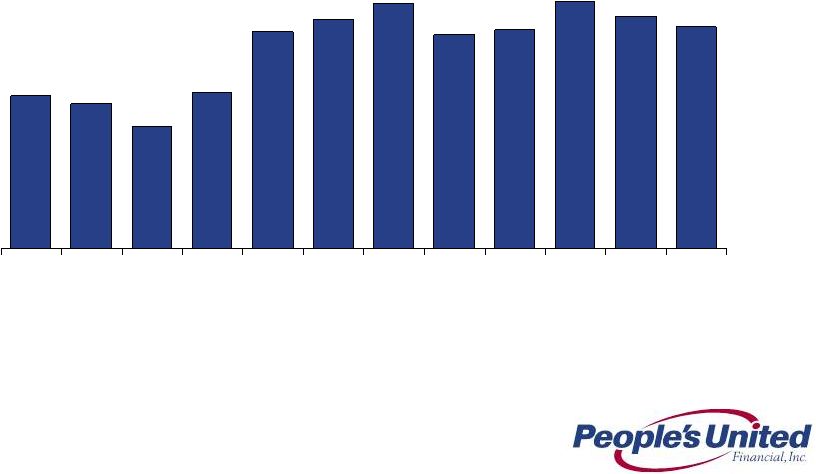
Operating ROAA Progress
Since 1Q 2010
0.60%
0.57%
0.48%
0.61%
0.85%
0.90%
0.96%
0.84%
0.86%
0.97%
0.91%
0.87%
1Q
2010
2Q
2010
3Q
2010
4Q
2010
1Q
2011
2Q
2011
3Q
2011
4Q
2011
1Q
2012
2Q
2012
3Q
2012
4Q
2012 |
 22
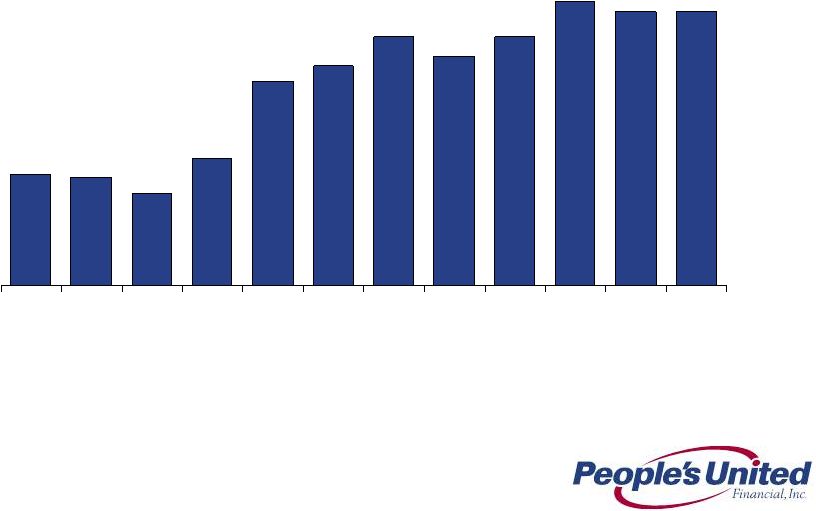
Operating ROATE Progress
Since 1Q 2010
3.5%
3.4%
2.9%
4.0%
6.4%
6.9%
7.8%
7.2%
7.8%
8.9%
8.6%
8.6%
1Q
2010
2Q
2010
3Q
2010
4Q
2010
1Q
2011
2Q
2011
3Q
2011
4Q
2011
1Q
2012
2Q
2012
3Q
2012
4Q
2012 |
 23
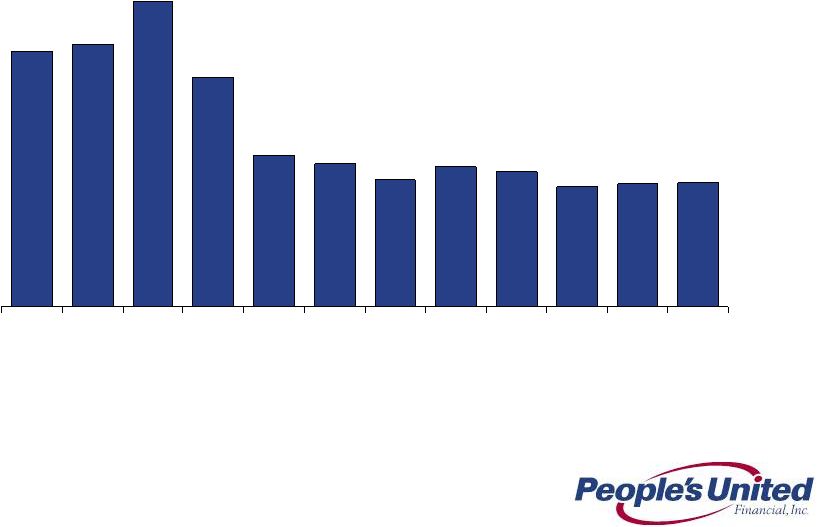
Operating Dividend Payout Ratio
Since 1Q 2010
175%
180%
209%
157%
104%
98%
87%
96%
93%
82%
84%
85%
1Q
2010
2Q
2010
3Q
2010
4Q
2010
1Q
2011
2Q
2011
3Q
2011
4Q
2011
1Q
2012
2Q
2012
3Q
2012
4Q
2012 |
 24
Capital Ratios
Since 1Q 2010
1Q 2010
1Q 2011
1Q 2012
2Q 2012
3Q 2012
4Q 2012
People’s United Financial
Tang. Com. Equity/Tang. Assets
18.7%
13.9%
11.7%
11.4%
11.2%
10.2%
Leverage Ratio
1, 5
19.2%
14.5%
12.1%
11.8%
11.5%
10.6%
Tier
1
Common
2
23.1%
17.1%
13.9%
13.6%
13.6%
12.7%
Tier 1 Risk-Based Capital
3, 5
23.9%
17.9%
14.4%
14.1%
14.1%
13.2%
Total Risk-Based Capital
4, 5
25.6%
19.4%
16.0%
15.6%
15.6%
14.7%
People’s United Bank
Leverage Ratio
1, 5
12.3%
11.4%
11.0%
10.9%
10.8%
9.8%
Tier 1 Risk-Based Capital
3, 5
15.4%
13.9%
13.1%
13.0%
13.2%
12.2%
Total Risk-Based Capital
4,5
16.3%
14.8%
14.0%
14.0%
14.1%
13.1%
Notes:
1.
Leverage (core) Capital represents Tier 1 Capital (total stockholder’s equity,
excluding: (i) after-tax net unrealized gains (losses) on certain securities classified as available
for sale; (ii) goodwill and other acquisition-related intangibles; and (iii) the amount recorded
in accumulated other comprehensive income (loss) relating to pension and other
postretirement benefits), divided by Adjusted Total Assets (period end total assets less goodwill and
other acquisition-related intangibles)
2.
Tier 1 Common represents total stockholder’s equity, excluding goodwill and other
acquisition-related intangibles, divided by Total Risk-Weighted Assets
3.
Tier 1 Risk-Based Capital represents Tier 1 Capital divided by Total
Risk-Weighted Assets
4.
Total Risk-Based Capital represents Tier 1 Capital plus subordinated notes and
debentures, up to certain limits, and the allowance for loan losses, up to 1.25% of total risk
weighted assets, divided by Total Risk-Weighted Assets
5.
Well capitalized limits for the Bank are: Leverage Ratio, 5%; Tier 1 Risk-Based
Capital, 6%; and Total Risk-Based Capital, 10%
|
 25
Summary
Sustainable Competitive Advantage
Premium brand built over 170 years
High quality Northeast footprint characterized by wealth, density and
commercial activity
Strong leadership team
Solid net interest margin
Superior asset quality
Focus on relationship-based banking
Growing loans
and
deposits
within
footprint
-
in
two
of
the
largest
MSAs
in
the country (New York City, #1 and Boston, #10)
Improving profitability
Returning capital to shareholders
Strong capital base as evidenced by robust Tier 1 Risk-Based and Tier 1
Common ratios |
 Appendix |
 27
For 3Q 2012 we were more than twice as asset sensitive as the estimated median of our
peer group
Currently for an immediate parallel increase of 100bps, our net interest income is
projected to increase by ~$48MM on an annualized basis
Yield curve twist scenarios confirm that we are reasonably well protected from bull
flattener (short rates are unchanged, long rates fall) and benefit
considerably from bear flattener environments (short rates rise, long rates
are unchanged) Notes:
1.
Analysis is as of 9/30/12 filings
2.
Data as of 9/30/12 SEC filings; where exact +100bps shock up scenario data was not
provided, PBCT interpolated based on data disclosed 3.
Data as of 9/30/12 SEC filings; where exact +200bps shock up scenario data was not
provided, PBCT interpolated based on data disclosed Current Asset
Sensitivity Net
Interest
Income
at
Risk
1
Analysis involves PBCT estimates, see notes below
Change in Net Interest Income
Scenario
Lowest
Amongst Peers
Highest
Amongst Peers
Peer Median
PBCT Multiple to
Peer Median
Shock Up
100bps
2
-3.6%
6.7%
2.7%
2.8x
Shock Up
200bps
3
-6.2%
13.4%
4.5%
3.4x |
 28
Peer Group
Firm
Ticker
City
State
1
Associated
ASBC
Green Bay
WI
2
BancorpSouth
BXS
Tupelo
MS
3
City National
CYN
Los Angeles
CA
4
Comerica
CMA
Dallas
TX
5
Commerce
CBSH
Kansas City
MO
6
Cullen/Frost
CFR
San Antonio
TX
7
East West
EWBC
Pasadena
CA
8
First Niagara
FNFG
Buffalo
NY
9
FirstMerit
FMER
Akron
OH
10
Fulton
FULT
Lancaster
PA
11
Huntington
HBAN
Columbus
OH
12
M&T
MTB
Buffalo
NY
13
New York Community
NYCB
Westbury
NY
14
Signature
SBNY
New York
NY
15
Susquehanna
SUSQ
Lititz
PA
16
Synovus
SNV
Columbus
GA
17
Valley National
VLY
Wayne
NJ
18
Webster
WBS
Waterbury
CT
19
Wintrust
WTFC
Lake Forest
IL
20
Zions
ZION
Salt Lake City
UT |
 For
more information, investors may contact: Peter Goulding, CFA
203-338-6799
peter.goulding@peoples.com |