Attached files
| file | filename |
|---|---|
| 8-K - WAFD 8-K_JAN 17 2013 - WASHINGTON FEDERAL INC | wafd8-k.htm |
| EX-99.2 - EXHIBIT 99.2_FACT SHEET - WASHINGTON FEDERAL INC | exhibit992dec2012factshe.htm |
| EX-99.1 - EXHIBIT 99.1_INCOME STATEMENT - WASHINGTON FEDERAL INC | exhibit991dec2012incomes.htm |
| EX-99.1 - EXHIBIT 99.1_BALANCE SHEET - WASHINGTON FEDERAL INC | exhibit991dec2012balance.htm |
| EX-99.1 - EXHIBIT 99.1_PRESS RELEASE VERBIAGE - WASHINGTON FEDERAL INC | exhibit991dec2012pressre.htm |
| EX-99.2 - EXHIBIT 99.2_AVERAGE BALANCE SHEET - WASHINGTON FEDERAL INC | exhibit992dec2012average.htm |

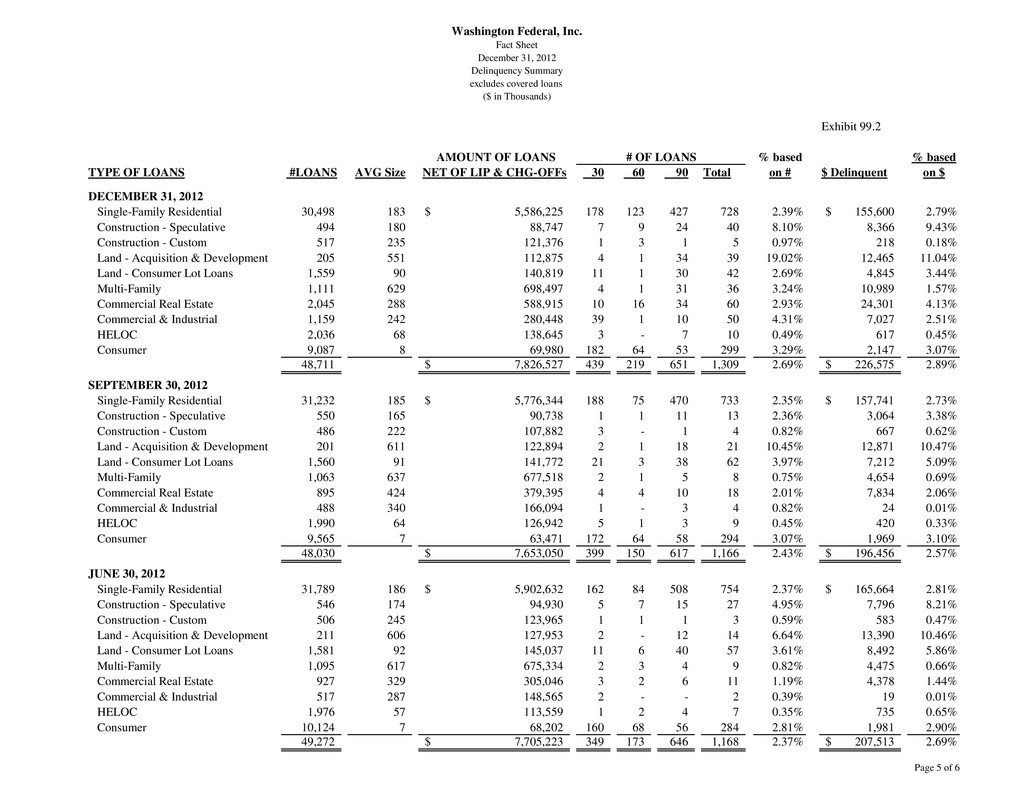
Washington Federal, Inc. Fact Sheet December 31, 2012 Delinquency Summary excludes covered loans ($ in Thousands) Exhibit 99.2 AMOUNT OF LOANS # OF LOANS % based % based TYPE OF LOANS #LOANS AVG Size NET OF LIP & CHG-OFFs 30 60 90 Total on # $ Delinquent on $ DECEMBER 31, 2012 Single-Family Residential 30,498 183 5,586,225$ 178 123 427 728 2.39% 155,600$ 2.79% Construction - Speculative 494 180 88,747 7 9 24 40 8.10% 8,366 9.43% Construction - Custom 517 235 121,376 1 3 1 5 0.97% 218 0.18% Land - Acquisition & Development 205 551 112,875 4 1 34 39 19.02% 12,465 11.04% Land - Consumer Lot Loans 1,559 90 140,819 11 1 30 42 2.69% 4,845 3.44% Multi-Family 1,111 629 698,497 4 1 31 36 3.24% 10,989 1.57% Commercial Real Estate 2,045 288 588,915 10 16 34 60 2.93% 24,301 4.13% Commercial & Industrial 1,159 242 280,448 39 1 10 50 4.31% 7,027 2.51% HELOC 2,036 68 138,645 3 - 7 10 0.49% 617 0.45% Consumer 9,087 8 69,980 182 64 53 299 3.29% 2,147 3.07% 48,711 7,826,527$ 439 219 651 1,309 2.69% 226,575$ 2.89% SEPTEMBER 30, 2012 Single-Family Residential 31,232 185 5,776,344$ 188 75 470 733 2.35% 157,741$ 2.73% Construction - Speculative 550 165 90,738 1 1 11 13 2.36% 3,064 3.38% Construction - Custom 486 222 107,882 3 - 1 4 0.82% 667 0.62% Land - Acquisition & Development 201 611 122,894 2 1 18 21 10.45% 12,871 10.47% Land - Consumer Lot Loans 1,560 91 141,772 21 3 38 62 3.97% 7,212 5.09% Multi-Family 1,063 637 677,518 2 1 5 8 0.75% 4,654 0.69% Commercial Real Estate 895 424 379,395 4 4 10 18 2.01% 7,834 2.06% Commercial & Industrial 488 340 166,094 1 - 3 4 0.82% 24 0.01% HELOC 1,990 64 126,942 5 1 3 9 0.45% 420 0.33% Consumer 9,565 7 63,471 172 64 58 294 3.07% 1,969 3.10% 48,030 7,653,050$ 399 150 617 1,166 2.43% 196,456$ 2.57% JUNE 30, 2012 Single-Family Residential 31,789 186 5,902,632$ 162 84 508 754 2.37% 165,664$ 2.81% Construction - Speculative 546 174 94,930 5 7 15 27 4.95% 7,796 8.21% Construction - Custom 506 245 123,965 1 1 1 3 0.59% 583 0.47% Land - Acquisition & Development 211 606 127,953 2 - 12 14 6.64% 13,390 10.46% Land - Consumer Lot Loans 1,581 92 145,037 11 6 40 57 3.61% 8,492 5.86% Multi-Family 1,095 617 675,334 2 3 4 9 0.82% 4,475 0.66% Commercial Real Estate 927 329 305,046 3 2 6 11 1.19% 4,378 1.44% Commercial & Industrial 517 287 148,565 2 - - 2 0.39% 19 0.01% HELOC 1,976 57 113,559 1 2 4 7 0.35% 735 0.65% Consumer 10,124 7 68,202 160 68 56 284 2.81% 1,981 2.90% 49,272 7,705,223$ 349 173 646 1,168 2.37% 207,513$ 2.69% Page 5 of 6
