Attached files
| file | filename |
|---|---|
| 8-K - FORM 8-K - PNC FINANCIAL SERVICES GROUP, INC. | d464806d8k.htm |
| EX-99.1 - FINANCIAL SUPPLEMENT (UNAUDITED) FOR FOURTH QUARTER AND FULL YEAR 2012 - PNC FINANCIAL SERVICES GROUP, INC. | d464806dex991.htm |
 The PNC
Financial Services Group, Inc. Fourth Quarter and Full Year 2012
Earnings Conference Call
January 17, 2013
Exhibit 99.2 |
 2
Cautionary Statement Regarding Forward-Looking
Information and Adjusted Information
This presentation includes “snapshot” information about PNC used by way of
illustration. It is not intended as a full business or financial review and
should be viewed in the context of all of the information made available by PNC in its SEC filings. The presentation also contains forward-
looking statements regarding our outlook for earnings, revenues, expenses, capital levels and
ratios, liquidity levels, asset levels, asset quality, financial position, and other
matters regarding or affecting PNC and its future business and operations. Forward-looking statements are
necessarily subject to numerous assumptions, risks and uncertainties, which change over
time. The forward-looking statements in this presentation are qualified by
the factors affecting forward-looking statements identified in the more detailed Cautionary Statement included in the
Appendix, which is included in the version of the presentation materials posted on our
corporate website at www.pnc.com/investorevents and in our SEC filings. We
provide greater detail regarding these as well as other factors in our 2011 Form 10-K, as amended by Amendment No. 1
thereto, and 2012 Form 10-Qs, including in the Risk Factors and Risk Management sections
and in the Legal Proceedings and Commitments and Guarantees Notes of the Notes to
Consolidated Financial Statements in those reports, and in our subsequent SEC filings. Our forward-looking
statements may also be subject to other risks and uncertainties, including those we may
discuss in this presentation or in SEC filings, accessible on the SEC’s website at
www.sec.gov and on PNC’s corporate website at www.pnc.com/secfilings. We have included web addresses in this
presentation as inactive textual references only. Information on these websites is not
part of this presentation. Future events or circumstances may change our outlook
and may also affect the nature of the assumptions, risks and uncertainties to which our forward-looking statements are
subject. Forward-looking statements in this presentation speak only as of the date
of this presentation. We do not assume any duty and do not undertake to update
those statements. Actual results or future events could differ, possibly materially, from those anticipated in forward-looking
statements, as well as from historical performance.
In this presentation, we may sometimes refer to adjusted results to help illustrate the impact
of certain types of items, such as provisions for residential mortgage repurchase
obligations, gains on sales of a portion of our VISA shares, non-cash charges related to redemptions of trust
preferred securities, expenses for residential mortgage foreclosure-related matters,
goodwill impairment charge and integration costs. This information supplements our
results as reported in accordance with GAAP and should not be viewed in isolation from, or as a substitute for, our
GAAP results. We believe that this additional information and the reconciliations we
provide may be useful to investors, analysts, regulators and others to help evaluate
the impact of these respective items on our operations. We may also provide information on the components of net
interest income (purchase accounting accretion and the core remainder) and the impact of
purchase accounting accretion on net interest margin. We believe that core net interest
margin (net interest margin less (annualized purchase accounting accretion divided by average interest-earning
assets)), a non-GAAP measure, is useful as a tool to help evaluate the impact of purchase
accounting accretion on net interest margin. Where applicable, we provide GAAP
reconciliations for such additional information, including in the slides, the Appendix and/or other slides and materials
on our corporate website at www.pnc.com/investorevents and in our SEC filings. In
certain discussions, we may also provide information on yields and margins for all
interest-earning assets calculated using net interest income on a taxable-equivalent basis by increasing the interest
income earned on tax-exempt assets to make it fully equivalent to interest income earned
on taxable investments. We believe this adjustment may be useful when comparing
yields and margins for all earning assets. We may also use annualized, proforma, estimated or third party
numbers for illustrative or comparative purposes only. These may not reflect actual
results. This presentation may also include discussion of other non-GAAP financial measures, which,
to the extent not so qualified therein or in the Appendix, is qualified by GAAP
reconciliation information available on our corporate website at www.pnc.com under “About PNC–Investor
Relations.”
|
 3
Significant 2012 Achievements
PNC Is Well-Positioned to Continue to Create Shareholder Value.
2012 financial
summary
Net income
Diluted EPS from
net income
Return on average
assets
$3.0 billion
$5.30
1.02%
1.31%
(adjusted)
(1)
Exceptional customer growth across our businesses resulted in strong loan, deposit and
revenue growth
Grew commercial and consumer loans
Investment in Southeast markets showing early cross-sales and fee income results
Overall credit quality improved
Expenses reflect overall business investments including Southeast expansion partially
offset by continuous improvement initiatives
Capital
and
liquidity
remained
strong
–
well
positioned
to
achieve
Basel
III
goals
2012 highlights
(1) Return on average assets adjusted for the following select items: provision for
residential mortgage repurchase obligations; gains on sales of VISA Class B
common shares; goodwill impairment charge for Residential Mortgage Banking segment; expenses for
residential mortgage foreclosure matters; noncash charges for unamortized discounts related to
redemption of trust preferred securities; and integration costs. Further
information provided in Appendix.
|
 4
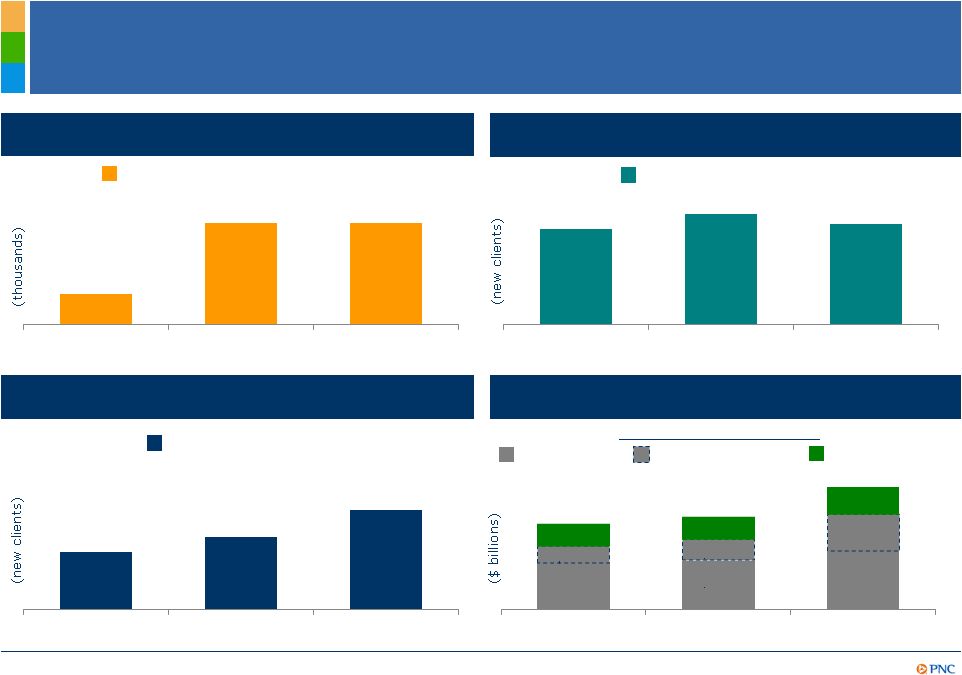
Growing Customers –
Long-Term Revenue Potential
Purchase
(4)
Net
organic
checking
relationships
(1)
New primary clients
(2)
New primary clients
(3)
Refinancing
Total
loan
originations
$10.5
$11.4
$15.2
HARP refinancing
75
255
254
2010
2011
2012
1,012
1,165
1,061
2010
2011
2012
1,220
1,541
2,117
2010
2011
2012
$5.7
$6.0
$7.2
$2.0
$2.6
$4.5
$2.8
$2.8
$3.5
2010
2011
2012
Retail Banking
Corporate Banking
Asset Management Group
Residential Mortgage
(1) Net organic checking relationship growth refers to new consumer and small business
accounts exclusive of accounts acquired through acquisition. (2) A Corporate Banking
primary client is defined as a corporate banking relationship with annual revenue generation of
$50,000 or more or, within corporate banking, a commercial banking client relationship with
annual revenue generation of $10,000 or more. (3) An Asset Management Group primary
client is defined as a client relationship with annual revenue generation of $10,000 or
more. (4) A mortgage with a borrower as part of a residential real estate purchase
transaction. |
 5
Financial Performance –
4Q12 Linked Quarter
Highlights
Continued strong loan growth including in asset-based lending, healthcare, public
finance, real estate and automobile lending
Reported revenues
stable -
increased by 5% excluding impact of residential
mortgage repurchase provision
(1)
–
NII increase of 1% supported by stable Core NII
–
Noninterest income grew 10% excluding impact of residential mortgage
repurchase provision
(2)
Provision elevated primarily due to a larger loan portfolio and reduced reserve
release in commercial lending
Higher noninterest expenses primarily related to residential mortgage-related
costs and other charges
(3)
Capital and liquidity remained strong
4Q12 financial
summary
Net income
Diluted EPS from
net income
EPS impact of
select items
Return on average
assets
$719 million
$1.24
$0.47
0.95%
1.28% (adjusted)
(5)
(4)
(1) Further information provided in Appendix. (2) Reported noninterest income declined
3%. Further information provided in Appendix. (3) See slide 9 for additional
detail. (4) Select items are listed in Note 1 of slide 3. Further details regarding select
items provided in Appendix. (5) Return on average assets adjusted for the select items
listed in Note 1 of slide 3. Further information provided in Appendix. |
 Loan Growth
Delivered Stable Core NII Highlights
Increase in average interest
earning assets driven by loan
growth
Loan growth supported NII
increase of 1%:
Five quarter trend
$2.2
$2.3
$2.5
$2.4
Core NII
(1)
PAA
Linked quarter:
Full Year 2012:
$2.4
First
Quarter
2013
Outlook
(3)
:
Expect NII to decline
approximately 2-3% when
compared to 4Q12 due to decline
in PAA
(2)
6
$1.9
$2.0
$2.2
$2.2
$2.2
$0.3
$0.3
$0.3
$0.2
$0.2
$228.4
$237.7
$250.1
$252.6
$253.6
4Q11
1Q12
2Q12
3Q12
4Q12
Avg. interest
earning assets
Core NII
1
increased 12% primarily
due to Southeast expansion,
organic loan growth and lower
funding costs
PAA
(2)
remained relatively stable
–
Core NII
(1)
remained stable
–
PAA
2
increased primarily as a
result of higher cash recoveries
on impaired loans
2
(1) Core net interest income is total net interest income, as reported, less related purchase
accounting accretion (scheduled and cash recoveries). (2) Purchase accounting accretion
(PAA) includes scheduled purchase accounting accretion and cash recoveries. Cash recoveries
reflect cash received in excess of recorded investment from sales or payoffs of impaired
commercial loans. See Appendix for additional details regarding Core NII and PAA.
(3) Refer to Cautionary Statement in the Appendix, including economic and other assumptions. |
 Client Growth
and Sales Driving Noninterest Income Growth
Highlights
Noninterest income increased 10%
excluding impact of residential
mortgage repurchase provision
(4)
Noninterest income to total
revenue adjusted increased to
42%
(3)
Linked quarter:
(millions)
4Q12
3Q12
FY12
FY11
Asset management
(1)
$302
$305
$1,169
$1,088
Consumer services
294
288
1,136
1,243
Corporate services
349
295
1,166
898
Residential mortgage banking
(2)
254
264
1,045
815
Deposit service charges
150
152
573
534
Net gains on sales of securities
less net OTTI
30
16
93
97
Other
520
406
1,451
1,053
Noninterest income other
than repurchase obligation
provision
$1,899
$1,726
$6,633
$5,728
Provision for residential
mortgage repurchase
obligations
(254)
(37)
(761)
(102)
Total noninterest income
$1,645
$1,689
$5,872
$5,626
Full Year 2012:
Noninterest income increased 4%
Noninterest income increased 11%
excluding impact of residential
mortgage repurchase provisions
and VISA gains
(5)
38%
(3)
42%
(3)
40%
(3)
Noninterest income to total revenue
7
38%
39%
30%
41%
40%
4Q11
1Q12
2Q12
3Q12
4Q12
(1) Asset management includes the Asset Management Group and BlackRock. (2) Residential
mortgage banking is Residential mortgage other than provision for residential mortgage
repurchase obligations. (3) Noninterest income and total revenue each adjusted for impact of
residential mortgage repurchase provision and gain on sale of VISA shares, as applicable.
Further information provided in Appendix. (4) Noninterest income declined 3% on a
reported basis. (5) Further information provided in Appendix. Provision for
residential mortgage repurchase obligations of $254
million in 4Q12
Partially offset by increases in
Corporate and Consumer services
and higher other income including
commercial mortgage banking
activity |
 8
Residential Mortgage Repurchase Obligations
Summary of Changes in Residential Mortgage Repurchase Reserve
($ millions)
4Q12
3Q12
2Q12
1Q12
4Q11
Beginning Reserve
$421
$462
$101
$83
$85
Provision
254
37
438
32
36
RBC Bank (USA)
-
-
-
26
-
Losses
(61)
(78)
(77)
(40)
(38)
Ending Balance
$614
$421
$462
$101
$83
Expected elevated levels of GSE-
related repurchase demands
As a result, PNC added provision of
approximately $254 million to
residential mortgage repurchase
reserves in 4Q12
Key Statistics
Total
Portfolio
GSEs
($ billions)
Total
Portfolio
‘06-‘08
Vintages
‘04-‘05
Vintages
Original UPB
$388
$217
$57
$60
Remaining UPB
92
58
12
12
Life-to-date demands
4.2
2.6
1.9
0.3
Life-to-date
repurchases
2.5
1.5
1.1
0.2
Life-to-date losses
1.4
0.8
0.5
0.1
Future expected losses
0.6
0.5
0.3
0.2
Total expected losses
$2.0
$1.3
$0.8
$0.3
4Q12 highlights
Primarily 2004-2005 vintages
Reserve harmonizes GSE-
related repurchase demands
Reserved to cover expected
total lifetime losses of $2.0
billion |
 9
Focused on Expense Management While Investing for
Growth
(millions)
4Q12
3Q12
FY12
FY11
Personnel
$1,216
$1,171
$4,617
$3,966
Occupancy
226
212
827
738
Equipment
194
185
735
661
Marketing
70
74
279
249
Other
1,123
1,008
4,124
3,491
Total noninterest expense
$2,829
$2,650
$10,582
$9,105
Residential mortgage foreclosure-
related matters
(91)
(53)
(225)
(324)
Goodwill impairment charge
(45)
-
(45)
-
Integration costs
(35)
(35)
(267)
(42)
Trust preferred securities
redemption-related charges
(70)
(95)
(295)
(198)
Noninterest expense, adjusted
$2,588
$2,467
$9,750
$8,541
Noninterest expense increased
$179 million due to:
Highlights
Linked quarter:
Full Year 2012:
Noninterest expense increase of
16% reflects:
2012
Continuous
Improvement
Initiatives
financial
impact
(1)
First
Quarter
2013
Outlook
(2)
:
Expect noninterest expense to
decline approximately $300 million
or 11% when compared to 4Q12
+
$0
$250
$500
1Q12
1H12
FY12
$101
$246
$550
Residential mortgage-related
charges (higher foreclosure-
related charges and goodwill
charge)
Adjustments to accruals
primarily for deferred loan
origination costs
Contribution to PNC Foundation
RBC Bank (USA) acquisition
Higher integration, trust
preferred securities
redemption-related charges
and overall business
investments
(1) Continuous improvement cost save initiatives related to legacy PNC’s efficiency
initiatives and RBC Bank (USA). (2) Refer to Cautionary Statement in the Appendix,
including economic and other assumptions. Does not take into account the impact of potential legal and
regulatory contingencies.
|
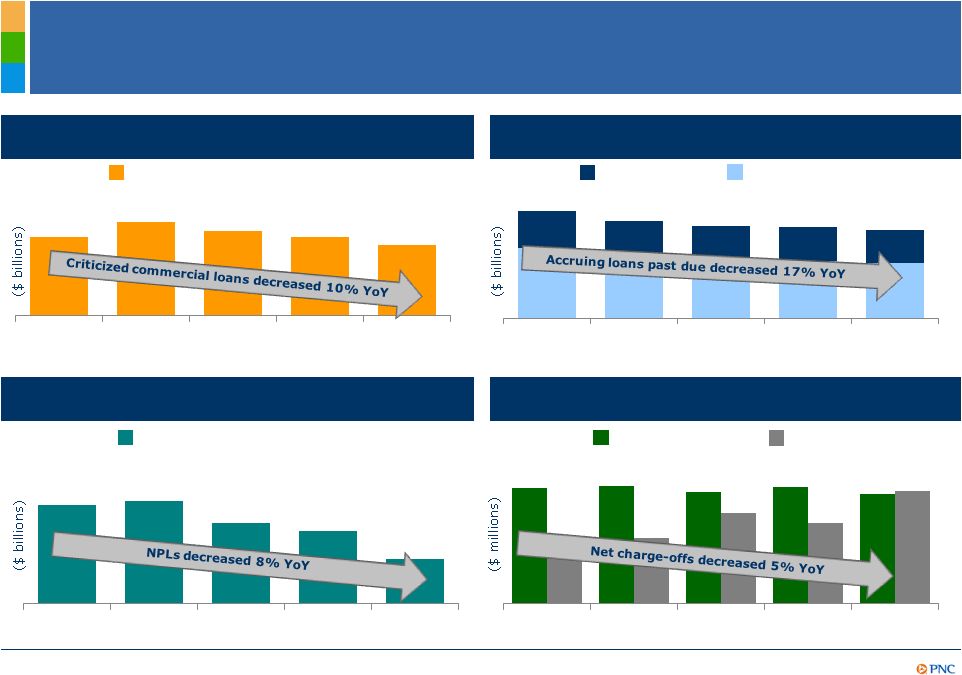 10
Credit Trends Continue to Improve
30-89 Days
90 Days +
Criticized Commercial loans
(1)
Total nonperforming loans
Provision
Net charge-offs
Criticized commercial loans
Accruing
loans
past
due
(2,3)
Nonperforming
loans
(2,4)
Provision and net charge-offs
$9.9
$11.8
$10.7
$9.9
$8.9
4Q11
1Q12
2Q12
3Q12
4Q12
$3.0
$2.6
$2.5
$2.5
$2.4
$1.6
$1.5
$1.4
$1.4
$1.4
4Q11
1Q12
2Q12
3Q12
4Q12
$3.6
$3.6
$3.5
$3.4
$3.3
4Q11
1Q12
2Q12
3Q12
4Q12
$327
$333
$315
$331
$310
$190
$185
$256
$228
$318
4Q11
1Q12
2Q12
3Q12
4Q12
As of quarter end except net charge-offs and provision, which are for the quarter. (1)
Criticized loans are ones that we consider “special mention,”
“substandard’” or “doubtful”. (2) Loans acquired from National City or RBC Bank (USA) that were impaired are not included as they
were recorded at estimated fair value when acquired and are currently considered performing
loans due to the accretion of interest in purchase accounting. (3) Includes loans that
are government guaranteed/insured, primarily residential mortgages. These loans totaled $2.7 billion in
4Q12. (4) Does not include loans held for sale or foreclosed and other assets. Effective in
2011, excludes residential real estate loans accounted for under the fair value option.
|
 11
Strong Capital and Liquidity Position
Basel I Tier 1 common capital ratio of 9.6%
(1)
–
Increased 10 bps due to retained earnings growth
Basel III Tier 1 estimated pro forma common capital ratio was 7.3% as of
December
31,
2012
without
benefit
of
phase-ins
(2)
(goal
is
to
be
within
a
range
of
8.0-8.5% by year-end 2013)
Capital priorities:
–
Build capital to support client growth and business investment
–
Improve the quality of capital
–
Maintain appropriate capital in light of economic uncertainty
–
Return excess capital to shareholders, subject to regulatory approval
–
Lower cost of equity by effectively managing risk and capital
Strong liquidity position
–
Parent company two year liquidity coverage
(3)
of 180%
–
Well-positioned for Basel liquidity coverage ratio rules
4Q12 highlights
(1) Estimated at December 31, 2012. (2) Based on current understanding of Basel III NPRs and
estimates of Basel II (with proposed modifications) risk-weighted assets. Includes
application of Basel II.5. Subject to further regulatory clarity and development,
validation and regulatory approval of Basel models. (3) Parent company liquidity coverage defined as liquid assets
divided by funding obligations within a two year period.
|
 12
Cautionary Statement Regarding Forward-Looking
Information
•
Our businesses, financial results and balance sheet values are affected by business and
economic conditions, including the following:
o
Changes in interest rates and valuations in debt, equity and other financial markets.
o
Disruptions in the liquidity and other functioning of U.S. and global financial markets.
o
The impact on financial markets and the economy of any changes in the credit ratings of U.S.
Treasury obligations and other U.S. government- backed debt, as well as issues
surrounding the level of U.S. and European government debt and concerns regarding the creditworthiness of
certain sovereign governments, supranationals and financial institutions in Europe.
o
Actions by Federal Reserve, U.S. Treasury and other government agencies, including those that
impact money supply and market interest rates.
o
Changes in customers’, suppliers’ and other counterparties’ performance and
creditworthiness.
o
Slowing or failure of the current moderate economic expansion.
o
Continued effects of aftermath of recessionary conditions and uneven spread of positive
impacts of recovery on the economy and our counterparties, including adverse impacts on
levels of unemployment, loan utilization rates, delinquencies, defaults and counterparty ability to
meet credit and other obligations.
o
Changes in customer preferences and behavior, whether due to changing business and economic
conditions, legislative and regulatory initiatives, or other factors. This
presentation includes “snapshot” information about PNC used by way of illustration and is not intended as a full business or financial review. It
should not be viewed in isolation but rather in the context of all of the information made
available by PNC in its SEC filings. We also make statements in this presentation, and
we may from time to time make other statements, regarding our outlook for earnings, revenues,
expenses, capital levels and ratios, liquidity levels, asset levels, asset quality, financial
position, and other matters regarding or affecting PNC and its future business and
operations that are forward-looking statements within the meaning of the Private Securities Litigation Reform Act. Forward-looking
statements are typically identified by words such as “believe,” “plan,”
“expect,” “anticipate,” “see,” “look,” “intend,” “outlook,” “project,” “forecast,”
“estimate,” “goal,” “will,” “should” and other similar
words and expressions. Forward-looking statements are subject to numerous assumptions, risks
and uncertainties, which change over time.
Forward-looking statements speak only as of the date made. We do not assume any duty
and do not undertake to update forward-looking statements. Actual results or
future events could differ, possibly materially, from those anticipated in forward-looking statements, as well as from historical
performance.
Our forward-looking statements are subject to the following principal risks and
uncertainties. •
Our forward-looking financial statements are subject to the risk that
economic and financial market conditions will be substantially different than we are
currently expecting. These statements are based on our current view that the moderate economic expansion will persist and interest rates
will remain very low in 2013, despite drags from Federal fiscal restraint and a European
recession. These forward-looking statements also do not, unless otherwise
indicated, take into account the impact of potential legal and regulatory contingencies.
•
PNC’s regulatory capital ratios in the future will depend on, among other things, the
company’s financial performance, the scope and terms of final capital regulations
then in effect (particularly those implementing the Basel Capital Accords), and management actions affecting the composition of
PNC’s balance sheet. In addition, PNC’s ability to determine, evaluate and
forecast regulatory capital ratios, and to take actions (such as capital distributions)
based on actual or forecasted capital ratios, will be dependent on the ongoing development, validation and regulatory approval of
related models.
Appendix |
 13
Cautionary Statement Regarding Forward-Looking
Information (continued)
Appendix
•
Legal and regulatory developments could have an impact on our ability to operate our
businesses, financial condition, results of operations, competitive position,
reputation, or pursuit of attractive acquisition opportunities. Reputational impacts could affect matters such as business
generation and retention, liquidity, funding, and ability to attract and retain
management. These developments could include:
o
Changes resulting from legislative and regulatory reforms, including major reform of the
regulatory oversight structure of the financial services industry and changes to laws
and regulations involving tax, pension, bankruptcy, consumer protection, and other industry
aspects, and changes in accounting policies and principles. We will be impacted by
extensive reforms provided for in the Dodd-Frank Wall Street Reform and Consumer
Protection Act (the “Dodd-Frank Act”) and otherwise growing out of the recent financial crisis, the
precise nature, extent and timing of which, and their impact on us, remains uncertain.
o
Changes to regulations governing bank capital and liquidity standards, including due to the
Dodd-Frank Act and to Basel-related initiatives.
o
Unfavorable resolution of legal proceedings or other claims and regulatory and other
governmental investigations or other inquiries. In addition to matters relating
to PNC’s business and activities, such matters may include proceedings, claims, investigations, or
inquiries relating to pre-acquisition business and activities of acquired companies, such
as National City. These matters may result in monetary judgments or settlements
or other remedies, including fines, penalties, restitution or alterations in our business practices,
and in additional expenses and collateral costs, and may cause reputational harm to PNC.
o
Results of the regulatory examination and supervision process, including our failure to
satisfy requirements of agreements with governmental agencies.
o
Impact on business and operating results of any costs associated with obtaining rights in
intellectual property claimed by others and of adequacy of our intellectual property
protection in general.
•
Business and operating results are affected by our ability to identify and effectively manage
risks inherent in our businesses, including, where appropriate, through effective use
of third-party insurance, derivatives, and capital management techniques, and to meet evolving
regulatory capital standards. In particular, our results currently depend on our ability
to manage elevated levels of impaired assets.
•
Business and operating results also include impacts relating to our equity interest in
BlackRock, Inc. and rely to a significant extent on information provided to us by
BlackRock. Risks and uncertainties that could affect BlackRock are discussed in more detail by BlackRock in its
SEC filings.
•
Our 2012 acquisition of RBC Bank (USA) presents us with risks and uncertainties related to the
integration of the acquired businesses into PNC, including:
o
Anticipated benefits of the transaction, including cost savings and strategic gains, may be
significantly harder or take longer to achieve than expected or may not be achieved in
their entirety as a result of unexpected factors or events.
o
Our ability to achieve anticipated results from this transaction is dependent also on the
extent of credit losses in the acquired loan portfolios and the extent of deposit
attrition, in part related to the state of economic and financial markets. Also, litigation and
regulatory and other governmental investigations that may be filed or commenced relating to
the pre-acquisition business and activities of RBC Bank (USA) could impact the
timing or realization of anticipated benefits to PNC.
o
Integration of RBC Bank (USA)’s business and operations into PNC may take longer than
anticipated or be substantially more costly than anticipated or have unanticipated
adverse results relating to RBC Bank (USA)’s or PNC’s existing businesses. PNC’s ability to
integrate RBC Bank (USA) successfully may be adversely affected by the fact that this
transaction results in PNC entering several geographic markets where PNC did not
previously have any meaningful retail presence.
|
 14
Cautionary Statement Regarding Forward-Looking
Information (continued)
Appendix
•
In addition to the RBC Bank (USA) transaction, we grow our business in part by acquiring from
time to time other financial services companies, financial services assets and related
deposits and other liabilities. These other acquisitions often present risks and
uncertainties analogous to those presented by the RBC Bank (USA) transaction.
Acquisition risks include those presented by the nature of the business acquired as
well as risks and uncertainties related to the acquisition transactions themselves, regulatory issues, and the
integration of the acquired businesses into PNC after closing.
•
Competition can have an impact on customer acquisition, growth and retention and on credit
spreads and product pricing, which can affect market share, deposits and
revenues. Industry restructuring in the current environment could also impact our business and
financial performance through changes in counterparty creditworthiness and performance and in
the competitive and regulatory landscape. Our ability to anticipate and respond
to technological changes can also impact our ability to respond to customer needs and
meet competitive demands.
•
Business and operating results can also be affected by widespread natural and other disasters,
dislocations, terrorist activities or international hostilities through impacts on the
economy and financial markets generally or on us or our counterparties specifically.
We provide greater detail regarding these as well as other factors in our 2011 Form 10-K,
as amended by Amendment No. 1 thereto, and our 2012 Form 10-Qs, including in the
Risk Factors and Risk Management sections and the Legal Proceedings and Commitments and
Guarantees Notes of the Notes to Consolidated Financial Statements in those reports, and in our subsequent SEC filings. Our
forward-looking statements may also be subject to other risks and uncertainties, including
those we may discuss elsewhere in this presentation or in SEC filings, accessible on
the SEC’s website at www.sec.gov and on our corporate website at www.pnc.com/secfilings.
We have included these web addresses as inactive textual references only. Information on
these websites is not part of this document. Any annualized, proforma, estimated, third party or consensus numbers in this presentation are
used for illustrative or comparative purposes only and may not reflect actual
results. Any consensus earnings estimates are calculated based on the earnings projections
made by analysts who cover that company. The analysts’ opinions, estimates or
forecasts (and therefore the consensus earnings estimates) are theirs alone, are not
those of PNC or its management, and may not reflect PNC’s or other company’s actual or
anticipated results.
|
 15
Non-GAAP to GAAP Reconcilement
In millions
Adjustments,
pretax
Income taxes
(benefit) (a)
Net income
Average Assets
Return on Avg.
Assets
Net income and return on avg. assets, as reported
$719
$302,131
0.95%
Adjustments:
Gain on sale of Visa Class B common shares
$(130)
$(45)
($85)
Residential mortgage repurchase obligations
$254
$89
$165
Trust preferred securities redemption charge
$70
$24
$46
Residential Mortgage foreclosure-related matters
$91
$31
$60
Goodwill impairment charge for Residential Mortgage
$45
$0
$45
Integration costs
$35
$12
$23
Net income and return on avg. assets, as adjusted
$973
$302,131
1.28%
In millions
Adjustments,
pretax
Income taxes
(benefit) (a)
Net income
Average Assets
Return on Avg.
Assets
Net income and return on avg. assets, as reported
$3,001
$295,025
1.02%
Adjustments:
Gains on sales of Visa Class B common shares
$(267)
$(93)
($174)
Residential mortgage repurchase obligations
$761
$266
$495
Trust preferred securities redemption charge
$295
$103
$192
Residential Mortgage foreclosure-related matters
$225
$79
$146
Goodwill impairment charge for Residential Mortgage
$45
$0
$45
Integration costs
$267
$93
$174
Net income and return on avg. assets, as adjusted
$3,879
$295,025
1.31%
For the three months ended Dec. 31, 2012
For the twelve months ended Dec. 31, 2012
PNC believes that information adjusted for the impact of certain items may be useful to help
evaluate the impact of these respective items on our operations.
(a) Income taxes calculated using a statutory federal income tax rate of 35%, excluding the
goodwill impairment charge which was considered non-deductible for tax purposes.
Appendix |
 16
Non-GAAP to GAAP Reconcilement
For the three months ended
In millions
Jun. 30, 2012
Sep. 30, 2012
Dec. 31, 2012
Total noninterest income, as reported
$1,097
$1,689
$1,645
Total revenue, as reported
$3,623
$4,088
$4,069
Adjustments:
Provision for residential mortgage repurchase obligations
438
37
254
Gain on sale of Visa Class B common shares
-
(137)
(130)
Total noninterest income, as adjusted
$1,535
$1,589
$1,769
Total revenue, as adjusted
$4,061
$3,988
$4,193
Total noninterest income to total revenue, as reported
30%
41%
40%
Total noninterest income to total revenue, as adjusted
38%
40%
42%
PNC believes that information adjusted for the impact of certain items may be useful to help
evaluate the impact of those items on our operations.
In millions
Dec. 31, 2012
Sep. 30, 2012
% change
Total revenue, as reported
$4,069
$4,088
0%
Adjustments:
Provision for residential mortgage repurchase obligations
254
37
Total revenue, as adjusted
$4,323
$4,125
5%
For the three months ended
PNC believes that information adjusted for the impact of certain items may be useful to help
evaluate the impact of those items on our operations.
In millions
Dec. 31, 2012
Sep. 30, 2012
Jun. 30, 2012
Mar. 31, 2012
Dec. 31, 2011
Dec. 31, 2012
Dec. 31, 2011
% change
Core NII
$2,151
$2,154
$2,183
$2,028
$1,943
$8,516
$7,581
12%
Purchase accounting accretion
273
245
343
263
256
1,124
1,119
Total NII
$2,424
$2,399
$2,526
$2,291
$2,199
$9,640
$8,700
11%
PNC believes core net interest income and purchase accounting accretion are useful in
evaluating the components of net interest income. For the three months ended
For the twelve months ended
Appendix |
 17
Non-GAAP to GAAP Reconcilement
In millions
Dec. 31, 2012
Sep. 30, 2012
% change
Total noninterest income, as reported
$1,645
$1,689
-3%
Adjustments:
Provision for residential mortgage repurchase obligations
254
37
Total noninterest income, as adjusted
$1,899
$1,726
10%
In millions
Dec. 31, 2012
Sep. 30, 2012
% change
Total noninterest income, as reported
$1,645
$1,689
-3%
Adjustments:
Provision for residential mortgage repurchase obligations
254
37
Gain on sale of Visa Class B common shares
(130)
(137)
Total noninterest income, as adjusted
$1,769
$1,589
11%
In millions
Dec. 31, 2012
Dec. 31, 2011
% change
Total noninterest income, as reported
$5,872
$5,626
4%
Adjustments:
Provision for residential mortgage repurchase obligations
761
102
Gain on sale of Visa Class B common shares
(267)
-
Total noninterest income, as adjusted
$6,366
$5,728
11%
For the three months ended
For the twelve months ended
PNC believes that information adjusted for the impact of certain items may be useful to help
evaluate the impact of those items on our operations.
PNC believes that information adjusted for the impact of certain items may be useful to help
evaluate the impact of those items on our operations.
For the three months ended
PNC believes that information adjusted for the impact of certain items may be useful to help
evaluate the impact of those items on our operations.
Appendix |
 18
Non-GAAP to GAAP Reconcilement
For the year ended
In millions, except per share data
Dec. 31, 2012
Sep. 30, 2012
Jun. 30, 2012
Mar. 31, 2012
Dec. 31, 2011
Dec. 31, 2012
Dec. 31, 2011
Noninterest Income
Provision for residential mortgage repurchase
obligations (Pre-tax)
$254
$37
$438
$32
$36
$761
$102
After-tax
$165
$24
$284
$21
$23
$495
$66
Impact on diluted earnings per share
($0.31)
($0.05)
($0.54)
($0.04)
($0.04)
($0.93)
($0.13)
Gains on sales of Visa Class B
common
shares (Pre-tax)
$130
$137
$267
After-tax
$85
$89
$174
Impact on diluted earnings per share
$0.16
$0.17
$0.33
Noninterest Expense
Goodwill impairment charge for Residential Mortgage
Banking segment (Pre-tax)
$45
$45
After-tax
$45
$45
Impact on diluted earnings per share
($0.08)
($0.08)
Expenses for residential
mortgage
foreclosure-related matters (Pre-tax)
$91
$53
$43
$38
$240
$225
$324
After-tax
$60
$34
$28
$25
$156
$146
$210
Impact on diluted earnings per share
($0.11)
($0.06)
($0.05)
($0.05)
($0.30)
($0.28)
($0.40)
Noncash charges for unamortized discounts related
to redemption of trust preferred securities (Pre-tax)
$70
$95
$130
$198
$295
$198
After-tax
$46
$61
$85
$129
$192
$129
Impact on diluted earnings per share
($0.09)
($0.12)
($0.16)
($0.24)
($0.36)
($0.24)
Integration costs (Pre-tax)
$35
$35
$52
$145
$28
$267
$42
After-tax
$23
$23
$34
$94
$18
$174
$27
Impact on diluted earnings per share
($0.04)
($0.04)
($0.06)
($0.18)
($0.04)
($0.33)
($0.05)
Total impact of selected items on diluted
earnings per share
($0.47)
($0.10)
($0.81)
($0.27)
($0.62)
($1.65)
($0.82)
For the three months ended
(1) In calculating impact on diluted earnings per share in the table above, after-tax
amounts for the income statement items were calculated using a statutory federal income
tax rate of 35%, excluding the goodwill impairment charge which was considered nondeductible for income tax purposes.
Appendix |