Attached files
| file | filename |
|---|---|
| 8-K - FORM 8-K - MOSAIC CO | d467549d8k.htm |
Exhibit 99.1
Exhibit 99.1
A Tale of Two Regions
Market Mosaic is a newsletter published for our customers, suppliers and stakeholders by the Market and Strategic Analysis group of The Mosaic Company. This issue recaps our assessment of the near term outlook for agricultural and crop nutrient markets.
Michael R. Rahm
Vice President Market and Strategic Analysis
Luis F. Dowling
Sr. Market Analyst
Josh Paula
Sr. Market Analyst
Mathew Philippi
Market Analyst
Recent statistics provide a first read of the application seasons that ended just a few weeks ago. The numbers tell a tale of two very different regions. Phosphate (P) and potash (K) demand in the Americas is booming in response to high agricultural commodity prices and highly profitable farm economics. Demand in Asia, however, is lagging mainly due to subsidy policies in India.
The erosion of P&K prices during the last few months indicates that uncertainties in Asia and continued cautious sentiment have trumped record shipments in the Americas – at least for now. Looking ahead, plant nutrient demand drivers are expected to remain constructive and some uncertainties such as first half Chinese potash contracts now are resolved and others will get resolved in the weeks ahead.
While we have lowered our 2013 forecasts due to less than expected Indian demand, we still project that global P&K shipments will increase to record levels this year. Demand will begin to pick up shortly following the seasonal slowdown this winter and, with the exception of India, we expect that future statistics will tell a more consistent tale of strong demand around the globe this year.
Outstanding Demand Drivers
The world will consume more grains and oilseeds than it harvested in 2012/13. In fact, this will be the third year in a row that use will exceed production and the 42 million tonne drawdown of global inventories this year will rank as the largest since massive drops in 2002/03 and 2003/04.
Despite severe droughts in the United States and the former Soviet Union, this year’s smaller than expected global harvest still registered as the second largest ever. In addition, the projected inventory drawdown assumes nearly flat global use in 2012/13. That bucks a trend of steady growth and likely will result in an unleashing of pent up demand in 2013/14.
Farmers have responded to high agricultural commodity prices by planting record area, but yields have stagnated at about 3.0 tonnes per hectare during the last four years due to extreme weather in several regions. As a result, production has not kept pace with demand growth and global grain and oilseed stocks have declined more than 75 million tonnes during the last three crop years.
Record New Crop Prices
This trend is not sustainable and it is no surprise that futures markets are signaling farmers to continue to plant more area and boost yields by applying more technology such as better seed varieties and more plant nutrients to their crops. In fact, new crop prices for corn, soybeans and hard red winter wheat have traded at the highest levels ever during the last few months when farmers were beginning to make decisions about 2013 crops.
– continued inside
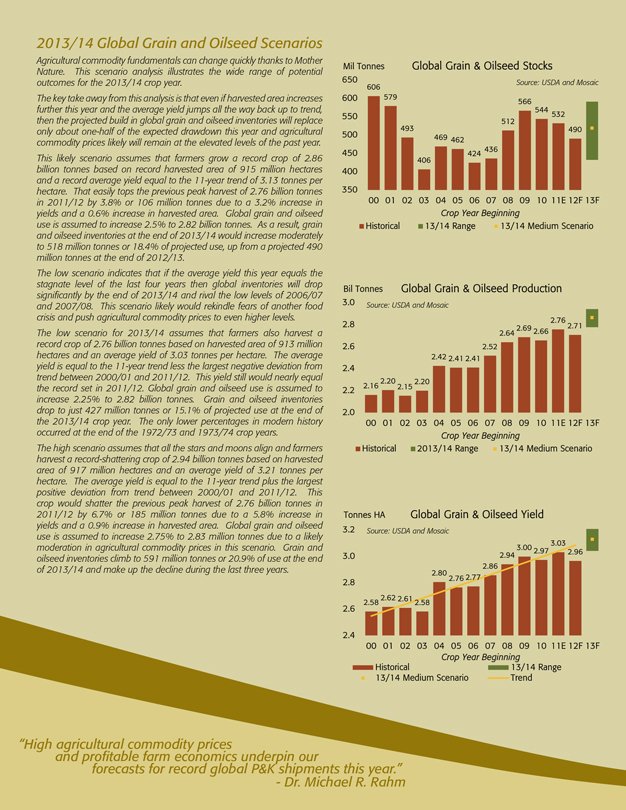
2013/14 Global Grain and Oilseed Scenarios
Agricultural commodity fundamentals can change quickly thanks to Mother Nature. This scenario analysis illustrates the wide range of potential outcomes for the 2013/14 crop year.
The key take away from this analysis is that even if harvested area increases further this year and the average yield jumps all the way back up to trend, then the projected build in global grain and oilseed inventories will replace only about one-half of the expected drawdown this year and agricultural commodity prices likely will remain at the elevated levels of the past year. This likely scenario assumes that farmers grow a record crop of 2.86 billion tonnes based on record harvested area of 915 million hectares and a record average yield equal to the 11-year trend of 3.13 tonnes per hectare. That easily tops the previous peak harvest of 2.76 billion tonnes in 2011/12 by 3.8% or 106 million tonnes due to a 3.2% increase in yields and a 0.6% increase in harvested area. Global grain and oilseed use is assumed to increase 2.5% to 2.82 billion tonnes. As a result, grain and oilseed inventories at the end of 2013/14 would increase moderately to 518 million tonnes or 18.4% of projected use, up from a projected 490 million tonnes at the end of 2012/13.
The low scenario indicates that if the average yield this year equals the stagnate level of the last four years then global inventories will drop significantly by the end of 2013/14 and rival the low levels of 2006/07 and 2007/08. This scenario likely would rekindle fears of another food crisis and push agricultural commodity prices to even higher levels. The low scenario for 2013/14 assumes that farmers also harvest a record crop of 2.76 billion tonnes based on harvested area of 913 million hectares and an average yield of 3.03 tonnes per hectare. The average yield is equal to the 11-year trend less the largest negative deviation from trend between 2000/01 and 2011/12. This yield still would nearly equal the record set in 2011/12. Global grain and oilseed use is assumed to increase 2.25% to 2.82 billion tonnes. Grain and oilseed inventories drop to just 427 million tonnes or 15.1% of projected use at the end of the 2013/14 crop year. The only lower percentages in modern history occurred at the end of the 1972/73 and 1973/74 crop years.
The high scenario assumes that all the stars and moons align and farmers harvest a record-shattering crop of 2.94 billion tonnes based on harvested area of 917 million hectares and an average yield of 3.21 tonnes per hectare. The average yield is equal to the 11-year trend plus the largest positive deviation from trend between 2000/01 and 2011/12. This crop would shatter the previous peak harvest of 2.76 billion tonnes in 2011/12 by 6.7% or 185 million tonnes due to a 5.8% increase in yields and a 0.9% increase in harvested area. Global grain and oilseed use is assumed to increase 2.75% to 2.83 million tonnes due to a likely moderation in agricultural commodity prices in this scenario. Grain and oilseed inventories climb to 591 million tonnes or 20.9% of use at the end of 2013/14 and make up the decline during the last three years.
Global Grain & Oilseed Stocks
Mil Tonnes
Source: USDA and Mosaic
650 600 550 500 450 400 350
606 579 493 406 469 462 424 436 512 566 544 532 490
00 01 02 03 04 05 06 07 08 09 10 11E 12F 13F
Crop Year Beginning
Historical
13/14 Range
13/14 Medium Scenario
Bil Tonnes Global Grain & Oilseed Production
Source: USDA and Mosaic
3.0 2.8 2.6 2.4 2.2 2.0
2.16 2.20 2.15 2.20 2.42 2.41 2.41 2.52 2.64 2.69 2.66 2.76 2.71
00 01 02 03 04 05 06 07 08 09 10 11E 12F 13F
Crop Year Beginning
Historical
2013/14 Range
13/14 Medium Scenario
Tonnes HA Global Grain & Oilseed Yield
Source: USDA and Mosaic
3.2
3.0
2.8
2.6
2.4
2.58 2.62 2.61 2.58 2.80 2.76 2.77 2.86 2.94 3.00 2.97 3.03 2.96
00 01 02 03 04 05 06 07 08 09 10 11E 12F 13F
Crop Year Beginning
Historical
13/14 Medium Scenario
13/14 Range Trend
“High and agricultural profitable commodity farm economics prices underpin our forecasts for record global P&K shipments this year.”
- Dr. Michael R. Rahm
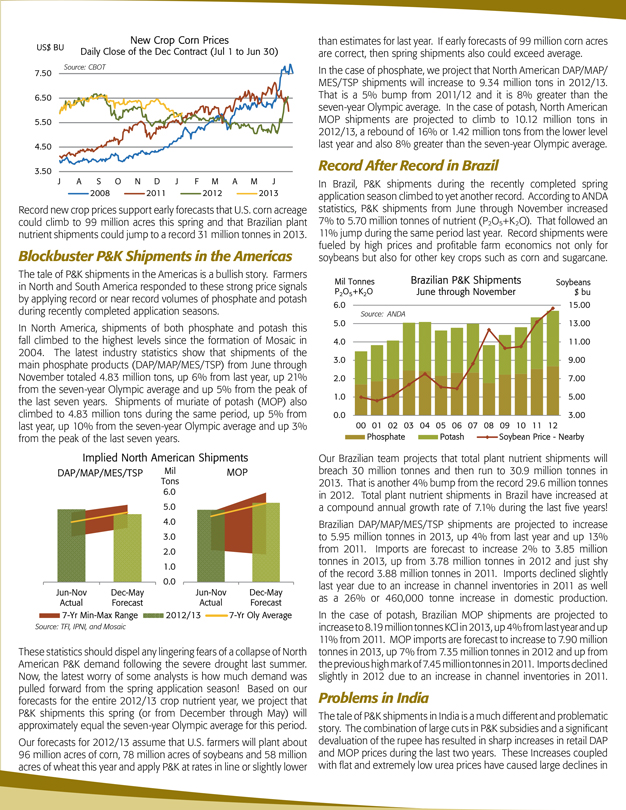
US$ BU
New Crop Corn Prices
Daily Close of the Dec Contract (Jul 1 to Jun 30)
Source: CBOT
7.50 6.50 5.50 4.50 3.50
J A S O N D J F M A M J
2008 2011 2012 2013
Record new crop prices support early forecasts that U.S. corn acreage could climb to 99 million acres this spring and that Brazilian plant nutrient shipments could jump to a record 31 million tonnes in 2013.
Blockbuster P&K Shipments in the Americas
The tale of P&K shipments in the Americas is a bullish story. Farmers in North and South America responded to these strong price signals by applying record or near record volumes of phosphate and potash during recently completed application seasons.
In North America, shipments of both phosphate and potash this fall climbed to the highest levels since the formation of Mosaic in 2004. The latest industry statistics show that shipments of the main phosphate products (DAP/MAP/MES/TSP) from June through November totaled 4.83 million tons, up 6% from last year, up 21% from the seven-year Olympic average and up 5% from the peak of the last seven years. Shipments of muriate of potash (MOP) also climbed to 4.83 million tons during the same period, up 5% from last year, up 10% from the seven-year Olympic average and up 3% from the peak of the last seven years.
Implied North American Shipments
DAP/MAP/MES/TSP
Mil Tons 6.0 5.0 4.0 3.0 2.0 1.0 0.0
MOP
Jun-Nov Dec-May Actual Forecast
Jun-Nov Dec-May Actual Forecast
7-Yr Min-Max Range
2012/13
7-Yr Oly Average
Source: TFI, IPNI, and Mosaic
These statistics should dispel any lingering fears of a collapse of North American P&K demand following the severe drought last summer. Now, the latest worry of some analysts is how much demand was pulled forward from the spring application season! Based on our forecasts for the entire 2012/13 crop nutrient year, we project that P&K shipments this spring (or from December through May) will approximately equal the seven-year Olympic average for this period.
Our forecasts for 2012/13 assume that U.S. farmers will plant about 96 million acres of corn, 78 million acres of soybeans and 58 million acres of wheat this year and apply P&K at rates in line or slightly lower than estimates for last year. If early forecasts of 99 million corn acres are correct, then spring shipments also could exceed average.
In the case of phosphate, we project that North American DAP/MAP/ MES/TSP shipments will increase to 9.34 million tons in 2012/13. That is a 5% bump from 2011/12 and it is 8% greater than the seven-year Olympic average. In the case of potash, North American MOP shipments are projected to climb to 10.12 million tons in 2012/13, a rebound of 16% or 1.42 million tons from the lower level last year and also 8% greater than the seven-year Olympic average.
Record After Record in Brazil
In Brazil, P&K shipments during the recently completed spring application season climbed to yet another record. According to ANDA statistics, P&K shipments from June through November increased 7% to 5.70 million tonnes of nutrient (P2O5+K2O). That followed an 11% jump during the same period last year. Record shipments were fueled by high prices and profitable farm economics not only for soybeans but also for other key crops such as corn and sugarcane.
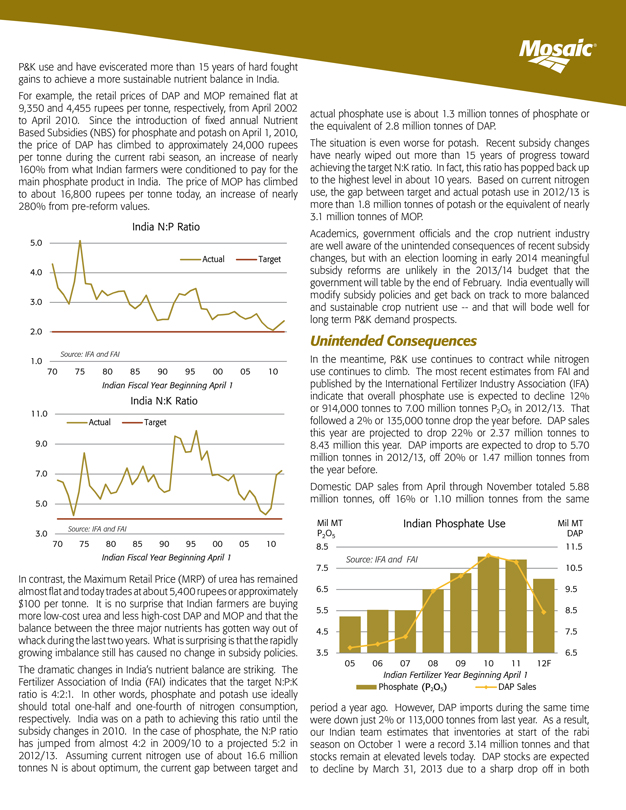
Mil Tonnes P2O5+K2O
Brazilian P&K Shipments
June through November
Soybeans $ bu
6.0 5.0 4.0 3.0 2.0 1.0 0.0
Source: ANDA
00 01 02 03 04 05 06 07 08 09 10 11 12
15.00 13.00 11.00 9.00 7.00 5.00 3.00
Phosphate Soybean Potash Price - Nearby
Our Brazilian team projects that total plant nutrient shipments will breach 30 million tonnes and then run to 30.9 million tonnes in 2013. That is another 4% bump from the record 29.6 million tonnes in 2012. Total plant nutrient shipments in Brazil have increased at a compound annual growth rate of 7.1% during the last five years!
Brazilian DAP/MAP/MES/TSP shipments are projected to increase to 5.95 million tonnes in 2013, up 4% from last year and up 13% from 2011. Imports are forecast to increase 2% to 3.85 million tonnes in 2013, up from 3.78 million tonnes in 2012 and just shy of the record 3.88 million tonnes in 2011. Imports declined slightly last year due to an increase in channel inventories in 2011 as well as a 26% or 460,000 tonne increase in domestic production.
In the case of potash, Brazilian MOP shipments are projected to increase to 8.19 million tonnes KCl in 2013, up 4% from last year and up 11% from 2011. MOP imports are forecast to increase to 7.90 million tonnes in 2013, up 7% from 7.35 million tonnes in 2012 and up from the previous high mark of 7.45 million tonnes in 2011. Imports declined slightly in 2012 due to an increase in channel inventories in 2011.
Problems in India
The tale of P&K shipments in India is a much different and problematic story. The combination of large cuts in P&K subsidies and a significant devaluation of the rupee has resulted in sharp increases in retail DAP and MOP prices during the last two years. These Increases coupled with flat and extremely low urea prices have caused large declines in
P&K use and have eviscerated more than 15 years of hard fought gains to achieve a more sustainable nutrient balance in India. For example, the retail prices of DAP and MOP remained flat at 9,350 and 4,455 rupees per tonne, respectively, from April 2002 to April 2010. Since the introduction of fixed annual Nutrient Based Subsidies (NBS) for phosphate and potash on April 1, 2010, the price of DAP has climbed to approximately 24,000 rupees per tonne during the current rabi season, an increase of nearly 160% from what Indian farmers were conditioned to pay for the main phosphate product in India. The price of MOP has climbed to about 16,800 rupees per tonne today, an increase of nearly 280% from pre-reform values.
India N:P Ratio
5.0 4.0 3.0 2.0 1.0
Actual
Target
70 75 80 85 90 95 00 05 10
Indian Fiscal Year Beginning April 1
India N:K Ratio
11.0 9.0 7.0 5.0 3.0
Actual Target
Source: IFA and FAI
70 75 80 85 90 95 00 05 10
Indian Fiscal Year Beginning April 1
In contrast, the Maximum Retail Price (MRP) of urea has remained almost flat and today trades at about 5,400 rupees or approximately $100 per tonne. It is no surprise that Indian farmers are buying more low-cost urea and less high-cost DAP and MOP and that the balance between the three major nutrients has gotten way out of whack during the last two years. What is surprising is that the rapidly growing imbalance still has caused no change in subsidy policies.
The dramatic changes in India’s nutrient balance are striking. The Fertilizer Association of India (FAI) indicates that the target N:P:K ratio is 4:2:1. In other words, phosphate and potash use ideally should total one-half and one-fourth of nitrogen consumption, respectively. India was on a path to achieving this ratio until the subsidy changes in 2010. In the case of phosphate, the N:P ratio has jumped from almost 4:2 in 2009/10 to a projected 5:2 in 2012/13. Assuming current nitrogen use of about 16.6 million tonnes N is about optimum, the current gap between target and actual phosphate use is about 1.3 million tonnes of phosphate or the equivalent of 2.8 million tonnes of DAP.
The situation is even worse for potash. Recent subsidy changes have nearly wiped out more than 15 years of progress toward achieving the target N:K ratio. In fact, this ratio has popped back up to the highest level in about 10 years. Based on current nitrogen use, the gap between target and actual potash use in 2012/13 is more than 1.8 million tonnes of potash or the equivalent of nearly 3.1 million tonnes of MOP.
Academics, government officials and the crop nutrient industry are well aware of the unintended consequences of recent subsidy changes, but with an election looming in early 2014 meaningful subsidy reforms are unlikely in the 2013/14 budget that the government will table by the end of February. India eventually will modify subsidy policies and get back on track to more balanced and sustainable crop nutrient use — and that will bode well for long term P&K demand prospects.
Unintended Consequences
In the meantime, P&K use continues to contract while nitrogen use continues to climb. The most recent estimates from FAI and published by the International Fertilizer Industry Association (IFA) indicate that overall phosphate use is expected to decline 12% or 914,000 tonnes to 7.00 million tonnes P2O5 in 2012/13. That followed a 2% or 135,000 tonne drop the year before. DAP sales this year are projected to drop 22% or 2.37 million tonnes to 8.43 million this year. DAP imports are expected to drop to 5.70 million tonnes in 2012/13, off 20% or 1.47 million tonnes from the year before.
Domestic DAP sales from April through November totaled 5.88 million tonnes, off 16% or 1.10 million tonnes from the same
Indian Phosphate Use
Mil MT P2O5
8.5 7.5 6.5 5.5 4.5 3.5
Source: IFA and FAI
Mil MT
DAP
11.5 10.5 9.5 8.5 7.5 6.5
05 06 07 08 09 10 11 12F
Indian Fertilizer Year Beginning April 1
Phosphate (P2O5)
DAP Sales
period a year ago. However, DAP imports during the same time were down just 2% or 113,000 tonnes from last year. As a result, our Indian team estimates that inventories at start of the rabi season on October 1 were a record 3.14 million tonnes and that stocks remain at elevated levels today. DAP stocks are expected to decline by March 31, 2013 due to a sharp drop off in both
imports and domestic production, but inventories at the start of the 2013/14 fiscal year likely will exceed levels of last year by 20% to 25%. As a consequence, we do not expect India to return to the phosphate market until the second quarter of 2013. In the case of potash, overall use plummeted 28% or 990,000 tonnes in 2011/12 and is projected to decline another 9% or 225,000 tonnes to 2.30 million tonnes K2O in 2012/13, the lowest level since 2004/05. MOP imports are projected to plunge 39% or 1.69 million tonnes to 2.61 million tonnes KCl this year. Imports dropped 32% or 2.05 million tonnes to 4.31 million tonnes KCl in 2011/12. Indian imports peaked at nearly 6.4 million tonnes KCl in 2010/11.
Mil MT K2O
Indian Potash Use Mil MT
MOP
4.0 3.0 2.0 1.0 0.0
Source: IFA and FAI
8.0 6.0 4.0 2.0 0.0
05 06 07 08 09 10 11 12F
Indian Fertilizer Year Beginning April 1
Potash (K2O)
MOP Sales
Domestic MOP imports from April through November totaled 2.51 million tonnes KCl, off just 3% or less than 80,000 tonnes from the same period a year ago. However, unlike last year when imports totaled 1.72 million tonnes from December through March, India is not expected to import any meaningful tonnage during the same period this year. As a result, MOP inventories are expected to get pulled down to very low levels by the end of the rabi season on March 31, 2013. Our Indian team estimates that MOP inventories will drop 37% from a year ago and 43% from two years ago. As a consequence, we expect that Indian importers will step back into the market during the first quarter of 2013 and begin to line up supplies for the kharif season. Despite the sharp jumps in retail P&K prices, Indian farm economics remain profitable due to significant increases in Minimum Support Prices (MSP) for most crops. For example, the government just raised the MSP for wheat by 5.1% to 1,350 rupees per 100 kg or the equivalent of about $6.70 per bushel. Rapeseed prices were increased 20% for the current rabi season. Higher MSP prices coupled with subsidized plant nutrient costs equals profitable farm economics. Nevertheless, Indian farmers are suffering from a bad case of sticker shock and have opted to buy lower cost urea instead of DAP and MOP. At some point, they are expected to recalibrate profit calculations using both higher crop prices and input costs as well as take into account the benefits of balanced nutrient use.
Record Global P&K Shipments
Although recent tales of the Americas and Asia are much different, high agricultural commodity prices and profitable farm economics underpin our forecasts for record global P&K shipments this year. However, we have lowered our estimates for 2012 as well as our forecasts for 2013 due mainly to larger than expected declines in India that have more than offset slightly better than expected movements in the Americas.
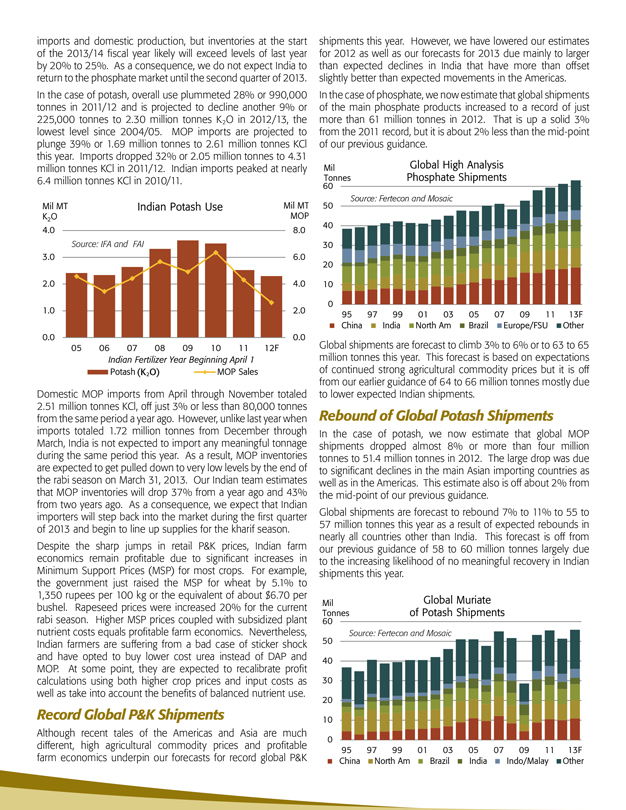
In the case of phosphate, we now estimate that global shipments of the main phosphate products increased to a record of just more than 61 million tonnes in 2012. That is up a solid 3% from the 2011 record, but it is about 2% less than the mid-point of our previous guidance.
Mil Global High Analysis Tonnes Phosphate Shipments
Source: Fertecon and Mosaic
60 50 40 30 20 10 0
95 97 99 01 03 05 07 09 11 13F
China India North Am Brazil Europe/FSU Other
Global shipments are forecast to climb 3% to 6% or to 63 to 65 million tonnes this year. This forecast is based on expectations of continued strong agricultural commodity prices but it is off from our earlier guidance of 64 to 66 million tonnes mostly due to lower expected Indian shipments.
Rebound of Global Potash Shipments
In the case of potash, we now estimate that global MOP shipments dropped almost 8% or more than four million tonnes to 51.4 million tonnes in 2012. The large drop was due to significant declines in the main Asian importing countries as well as in the Americas. This estimate also is off about 2% from the mid-point of our previous guidance.
Global shipments are forecast to rebound 7% to 11% to 55 to 57 million tonnes this year as a result of expected rebounds in nearly all countries other than India. This forecast is off from our previous guidance of 58 to 60 million tonnes largely due to the increasing likelihood of no meaningful recovery in Indian shipments this year.
Mil Global Muriate Tonnes of Potash Shipments
60 50 40 30 20 10 0
Source: Fertecon and Mosaic
95 97 99 01 03 05 07 09 11 13F
China North Am Brazil India Indo/Malay Other
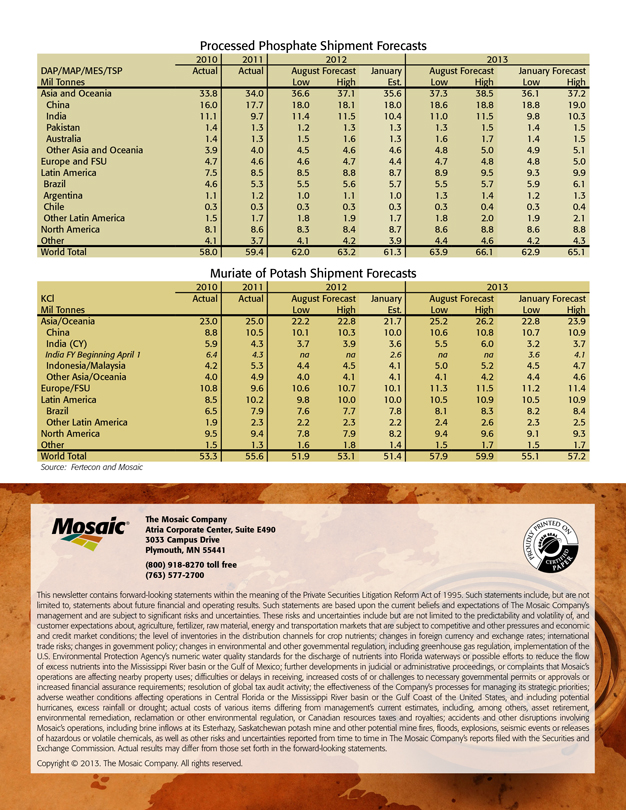
Processed Phosphate Shipment Forecasts
2010 2011 2012 2013
DAP/MAP/MES/TSP Actual Actual August Forecast January August Forecast January Forecast
Mil Tonnes Low High Est. Low High Low High
Asia and Oceania 33.8 34.0 36.6 37.1 35.6 37.3 38.5 36.1 37.2
China 16.0 17.7 18.0 18.1 18.0 18.6 18.8 18.8 19.0
India 11.1 9.7 11.4 11.5 10.4 11.0 11.5 9.8 10.3
Pakistan 1.4 1.3 1.2 1.3 1.3 1.3 1.5 1.4 1.5
Australia 1.4 1.3 1.5 1.6 1.3 1.6 1.7 1.4 1.5
Other Asia and Oceania 3.9 4.0 4.5 4.6 4.6 4.8 5.0 4.9 5.1
Europe and FSU 4.7 4.6 4.6 4.7 4.4 4.7 4.8 4.8 5.0
Latin America 7.5 8.5 8.5 8.8 8.7 8.9 9.5 9.3 9.9
Brazil 4.6 5.3 5.5 5.6 5.7 5.5 5.7 5.9 6.1
Argentina 1.1 1.2 1.0 1.1 1.0 1.3 1.4 1.2 1.3
Chile 0.3 0.3 0.3 0.3 0.3 0.3 0.4 0.3 0.4
Other Latin America 1.5 1.7 1.8 1.9 1.7 1.8 2.0 1.9 2.1
North America 8.1 8.6 8.3 8.4 8.7 8.6 8.8 8.6 8.8
Other 4.1 3.7 4.1 4.2 3.9 4.4 4.6 4.2 4.3
World Total 58.0 59.4 62.0 63.2 61.3 63.9 66.1 62.9 65.1
Muriate of Potash Shipment Forecasts
2010 2011 2012 2013
KCl Actual Actual August Forecast January August Forecast January Forecast
Mil Tonnes Low High Est. Low High Low High
Asia/Oceania 23.0 25.0 22.2 22.8 21.7 25.2 26.2 22.8 23.9
China 8.8 10.5 10.1 10.3 10.0 10.6 10.8 10.7 10.9
India (CY) 5.9 4.3 3.7 3.9 3.6 5.5 6.0 3.2 3.7
India FY Beginning April 1 6.4 4.3 na na 2.6 na na 3.6 4.1
Indonesia/Malaysia 4.2 5.3 4.4 4.5 4.1 5.0 5.2 4.5 4.7
Other Asia/Oceania 4.0 4.9 4.0 4.1 4.1 4.1 4.2 4.4 4.6
Europe/FSU 10.8 9.6 10.6 10.7 10.1 11.3 11.5 11.2 11.4
Latin America 8.5 10.2 9.8 10.0 10.0 10.5 10.9 10.5 10.9
Brazil 6.5 7.9 7.6 7.7 7.8 8.1 8.3 8.2 8.4
Other Latin America 1.9 2.3 2.2 2.3 2.2 2.4 2.6 2.3 2.5
North America 9.5 9.4 7.8 7.9 8.2 9.4 9.6 9.1 9.3
Other 1.5 1.3 1.6 1.8 1.4 1.5 1.7 1.5 1.7
World Total 53.3 55.6 51.9 53.1 51.4 57.9 59.9 55.1 57.2
Source: Fertecon and Mosaic
The Mosaic Company
Atria Corporate Center, Suite E490 3033 Campus Drive Plymouth, MN 55441 (800) 918-8270 toll free (763) 577-2700
This newsletter contains forward-looking statements within the meaning of the Private Securities Litigation Reform Act of 1995. Such statements include, but are not limited to, statements about future financial and operating results. Such statements are based upon the current beliefs and expectations of The Mosaic Company’s management and are subject to significant risks and uncertainties. These risks and uncertainties include but are not limited to the predictability and volatility of, and customer expectations about, agriculture, fertilizer, raw material, energy and transportation markets that are subject to competitive and other pressures and economic and credit market conditions; the level of inventories in the distribution channels for crop nutrients; changes in foreign currency and exchange rates; international trade risks; changes in government policy; changes in environmental and other governmental regulation, including greenhouse gas regulation, implementation of the U.S. Environmental Protection Agency’s numeric water quality standards for the discharge of nutrients into Florida waterways or possible efforts to reduce the flow of excess nutrients into the Mississippi River basin or the Gulf of Mexico; further developments in judicial or administrative proceedings, or complaints that Mosaic’s operations are affecting nearby property uses; difficulties or delays in receiving, increased costs of or challenges to necessary governmental permits or approvals or increased financial assurance requirements; resolution of global tax audit activity; the effectiveness of the Company’s processes for managing its strategic priorities; adverse weather conditions affecting operations in Central Florida or the Mississippi River basin or the Gulf Coast of the United States, and including potential hurricanes, excess rainfall or drought; actual costs of various items differing from management’s current estimates, including, among others, asset retirement, environmental remediation, reclamation or other environmental regulation, or Canadian resources taxes and royalties; accidents and other disruptions involving Mosaic’s operations, including brine inflows at its Esterhazy, Saskatchewan potash mine and other potential mine fires, floods, explosions, seismic events or releases of hazardous or volatile chemicals, as well as other risks and uncertainties reported from time to time in The Mosaic Company’s reports filed with the Securities and Exchange Commission. Actual results may differ from those set forth in the forward-looking statements.
Copyright © 2013. The Mosaic Company. All rights reserved.