Attached files
| file | filename |
|---|---|
| 8-K - 8-K - FASTENAL CO | fast1231128k.htm |
EXHIBIT 99.1
Fastenal Company Reports 2012 Fourth Quarter and Annual Earnings
WINONA, Minn., January 17, 2013 (GLOBE NEWSWIRE) -- Fastenal Company of Winona, MN (Nasdaq:FAST) reported the results of the quarter and year ended December 31, 2012. Except for per share information, or as otherwise noted below, dollar amounts are stated in thousands. Share and per share information in this document has been adjusted to give effect to the two-for-one split of our common stock in May 2011.
Net sales, pre-tax earnings, net earnings, and net earnings per share were as follows for the periods ended December 31:
Twelve-month period | Three-month period | ||||||||||||||||
2012 | 2011 | Change | 2012 | 2011 | Change | ||||||||||||
Net sales | $ | 3,133,577 | 2,766,859 | 13.3% | $ | 757,235 | 697,804 | 8.5% | |||||||||
Pre-tax earnings | $ | 674,155 | 575,081 | 17.2% | $ | 158,151 | 140,769 | 12.3% | |||||||||
% of sales | 21.5 | % | 20.8 | % | 20.9 | % | 20.2 | % | |||||||||
Net earnings | $ | 420,536 | 357,929 | 17.5% | $ | 98,716 | 87,472 | 12.9% | |||||||||
Net earnings per share (basic) | $ | 1.42 | 1.21 | 17.4% | $ | 0.33 | 0.30 | 10.0% | |||||||||
On a sequential basis in 2012, the first, second, third, and fourth quarters had 64, 64, 63, and 63 business days, respectively; and our daily sales average was $12,014, $12,576, $12,739, and $12,020, respectively.
On December 31, 2012, we had 2,652 stores. During 2012, we opened 80 new stores, an increase of 3.1% since December 2011 (we opened 122 new stores in 2011). On December 31, 2012, we operated 21,095 FAST SolutionsSM (industrial vending) machines. During 2012 we installed 13,642 new machines, an increase of 183.0% since December 2011 (we installed 5,528 machines in 2011). On December 31, 2012, we had 15,145 employees, a decrease of 0.2% since December 2011; however, our average full-time equivalent employee number increased by 4.4% from the fourth quarter of 2011 to 2012 (as discussed later in this document).
Similar to previous quarters, we have included comments regarding several aspects of our business:
1. | Monthly sales changes, sequential trends, and end market performance – a recap of our recent sales trends and some insight into the activities with different end markets. |
2. | Growth drivers of our business – a recap of how we grow our business. |
3. | Profit drivers of our business – a recap of how we increase our profits. |
4. | Statement of earnings information – a recap of the components of our income statement. |
5. | Operational working capital, balance sheet, and cash flow – a recap of the operational working capital utilized in our business, and the related cash flow. |
While reading these items, it is helpful to appreciate several aspects of our marketplace: (1) it's big, the North American marketplace for industrial supplies is estimated to be in excess of $160 billion per year (and we have expanded beyond North America), (2) no company has a significant portion of this market, (3) many of the products we sell are individually inexpensive, (4) when our customer needs something quickly or unexpectedly our local store is a quick source, (5) the cost to manage and procure these products can be significant, and (6) the cost to move these products, many of which are bulky, can also be significant.
Our motto is Growth through Customer Service. This is important given the points noted above. We believe in efficient markets – to us, this means we can grow our market share if we provide the greatest value to the customer. We believe our ability to grow is amplified if we can service our customer at the closest economic point of contact.
The concept of growth is simple, find more customers every day and increase your activity with them. However, execution is hard work. First, we recruit service minded individuals to support our customers and their business. Second, we operate in a decentralized fashion to help identify the greatest value for our customers. Third, we build a great machine behind the store to operate efficiently and to help identify new business solutions. Fourth, we do these things every day. Finally, we strive to generate strong profits; these profits produce the cash flow necessary to fund the growth and to support the needs of our customers.
1
MONTHLY SALES CHANGES, SEQUENTIAL TRENDS, AND END MARKET PERFORMANCE
Note – Daily sales are defined as the sales for the period divided by the number of business days (in the United States) in the period.
This section focuses on three distinct views of our business – monthly sales changes, sequential trends, and end market performance. The first discussion regarding monthly sales changes provides a good mechanical view of our business based on the age of our stores. The second discussion provides a framework for understanding the sequential trends (that is, comparing a period to the immediately preceding period) in our business. Finally, we believe the third discussion regarding end market performance provides insight into activities with our various types of customers.
MONTHLY SALES CHANGES:
All company sales – During the months in 2012, 2011, and 2010, all of our selling locations, when combined, had daily sales growth rates of (compared to the comparable month in the preceding year):
Jan. | Feb. | Mar. | Apr. | May | June | July | Aug. | Sept. | Oct. | Nov. | Dec. | ||||||||||||||||||||||||
2012 | 21.3 | % | 20.0 | % | 19.3 | % | 17.3 | % | 13.1 | % | 14.0 | % | 12.1 | % | 12.0 | % | 12.9 | % | 6.8 | % | 8.2 | % | 9.7 | % | |||||||||||
2011 | 18.8 | % | 21.5 | % | 22.8 | % | 23.2 | % | 22.6 | % | 22.5 | % | 22.4 | % | 20.0 | % | 18.8 | % | 21.4 | % | 22.2 | % | 21.2 | % | |||||||||||
2010 | 2.4 | % | 4.4 | % | 12.1 | % | 18.6 | % | 21.1 | % | 21.1 | % | 24.4 | % | 22.1 | % | 23.5 | % | 22.4 | % | 17.9 | % | 20.9 | % | |||||||||||
The growth in the first three and a half months of 2012 generally continued the relative strength we saw in 2011 and in most of 2010. During 2012 there were two distinct economic slowdowns. The first occurred in the late April/May time frame, and then moderated until September. The second occurred in the October/November time frame. This was exaggerated by an unusual business day comparison in October (23 days in 2012 versus 21 days in 2011 - the maintenance portion of our business is often linked to monthly spend patterns, which are not as business day dependent, this can dilute the daily growth picture given the change in business day divisor) and the impact of Hurricane Sandy. The change in currencies in foreign countries (primarily Canada) relative to the United States dollar lowered our daily sales growth rate by 0.1% during 2012 (this lowered our growth in the first, second, and third quarters by 0.1%, 0.4%, 0.2%, respectively and increased our growth in the fourth quarter by 0.2%). This was a sharp contrast to 2011 and 2010, when changes in foreign currencies increased our growth by 0.7% and 0.6%, respectively.
Stores opened greater than two years – Our stores opened greater than two years (store sites opened as follows: 2012 group – opened 2010 and earlier, 2011 group – opened 2009 and earlier, and 2010 group – opened 2008 and earlier) represent a consistent 'same-store' view of our business. During the months in 2012, 2011, and 2010, the stores opened greater than two years had daily sales growth rates of (compared to the comparable month in the preceding year):
Jan. | Feb. | Mar. | Apr. | May | June | July | Aug. | Sept. | Oct. | Nov. | Dec. | ||||||||||||||||||||||||
2012 | 18.8 | % | 17.1 | % | 16.8 | % | 14.5 | % | 10.1 | % | 11.1 | % | 9.1 | % | 8.6 | % | 9.8 | % | 3.8 | % | 5.1 | % | 6.6 | % | |||||||||||
2011 | 16.0 | % | 18.4 | % | 19.4 | % | 19.6 | % | 19.2 | % | 19.1 | % | 18.7 | % | 16.5 | % | 15.2 | % | 18.0 | % | 18.5 | % | 17.5 | % | |||||||||||
2010 | 0.6 | % | 2.3 | % | 9.6 | % | 16.3 | % | 18.5 | % | 18.3 | % | 21.3 | % | 19.2 | % | 19.8 | % | 18.8 | % | 14.1 | % | 16.8 | % | |||||||||||
Stores opened greater than five years – The impact of the economy, over time, is best reflected in the growth performance of our stores opened greater than five years (store sites opened as follows: 2012 group – opened 2007 and earlier, 2011 group – opened 2006 and earlier, and 2010 group – opened 2005 and earlier). This group is more cyclical due to the increased market share they enjoy in their local markets. During the months in 2012, 2011, and 2010, the stores opened greater than five years had daily sales growth rates of (compared to the comparable month in the preceding year):
Jan. | Feb. | Mar. | Apr. | May | June | July | Aug. | Sept. | Oct. | Nov. | Dec. | ||||||||||||||||||||||||
2012 | 17.4 | % | 15.8 | % | 15.7 | % | 13.7 | % | 9.0 | % | 10.2 | % | 8.3 | % | 7.9 | % | 8.5 | % | 2.6 | % | 4.6 | % | 5.6 | % | |||||||||||
2011 | 15.3 | % | 17.9 | % | 19.2 | % | 19.1 | % | 17.9 | % | 18.2 | % | 17.3 | % | 15.2 | % | 14.5 | % | 17.0 | % | 17.4 | % | 16.9 | % | |||||||||||
2010 | -2.1 | % | -0.5 | % | 7.4 | % | 14.9 | % | 17.3 | % | 16.2 | % | 19.8 | % | 18.2 | % | 18.9 | % | 17.9 | % | 13.2 | % | 16.0 | % | |||||||||||
2
SEQUENTIAL TRENDS:
We find it helpful to think about the monthly sequential changes in our business using the analogy of climbing a stairway – This stairway has several predictable landings where there is a pause in the sequential gain (i.e. April, July, and October to December), but generally speaking, climbs from January to October. The October landing then establishes the benchmark for the start of the next year.
History has identified these landings in our business cycle. They generally relate to months with impaired business days (certain holidays). The first landing centers on Easter, which alternates between March and April (Easter occurred in April in 2012, 2011, and 2010), the second landing centers on July 4th, and the third landing centers on the approach of winter with its seasonal impact on primarily our construction business and with the Christmas / New Year holidays. The holidays we noted impact the trends because they either move from month-to-month or because they move around during the week.
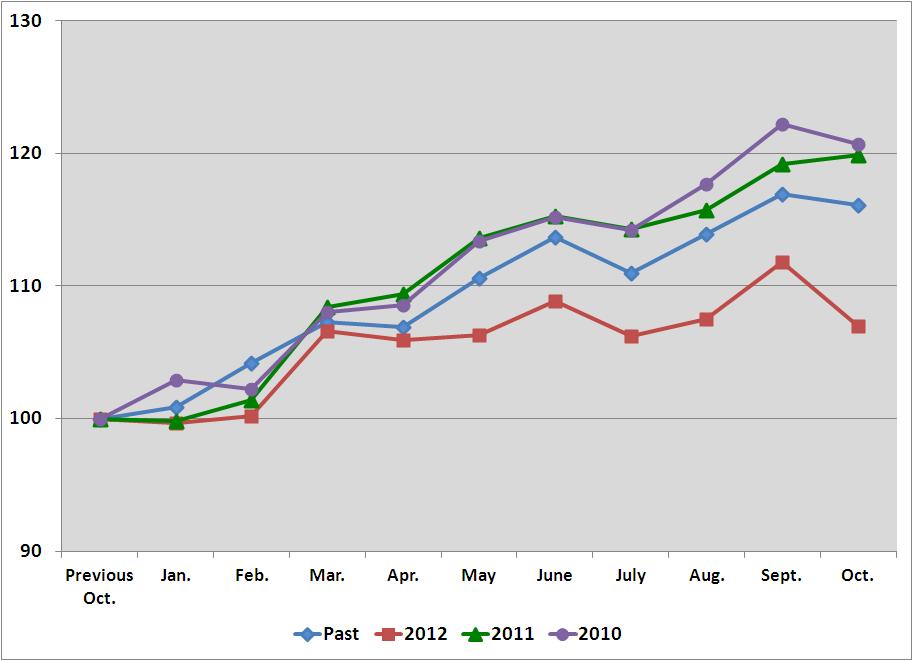
The table below shows the pattern to our sequential change in our daily sales. The line labeled 'Past' is an historical average of our sequential daily sales change for the period 1998 to 2003. We chose this time frame because it had similar characteristics, a weaker industrial economy in North America, and could serve as a benchmark for a possible trend line. The '2012', '2011', and '2010' lines represent our actual sequential daily sales changes. The '12Delta', '11Delta', and '10Delta' lines indicate the difference between the 'Past' and the actual results in the respective year.
Jan.(1) | Feb. | Mar. | Apr. | May | June | July | Aug. | Sept. | Oct. | Cumulative change from Jan. to Oct. | ||||||||||||||||||||||
Past | 0.9 | % | 3.3 | % | 2.9 | % | -0.3 | % | 3.4 | % | 2.8 | % | -2.3 | % | 2.6 | % | 2.6 | % | -0.7 | % | 15.9 | % | ||||||||||
2012 | -0.3 | % | 0.5 | % | 6.4 | % | -0.8 | % | 0.5 | % | 2.5 | % | -2.7 | % | 1.3 | % | 4.3 | % | -4.8 | % | 7.1 | % | ||||||||||
12Delta | -1.2 | % | -2.8 | % | 3.5 | % | -0.5 | % | -2.9 | % | -0.3 | % | -0.4 | % | -1.3 | % | 1.7 | % | -4.1 | % | -8.8 | % | ||||||||||
2011 | -0.2 | % | 1.6 | % | 7.0 | % | 0.9 | % | 4.3 | % | 1.7 | % | -1.0 | % | 1.4 | % | 3.4 | % | 0.7 | % | 21.7 | % | ||||||||||
11Delta | -1.1 | % | -1.7 | % | 4.1 | % | 1.2 | % | 0.9 | % | -1.1 | % | 1.3 | % | -1.2 | % | 0.8 | % | 1.4 | % | 5.8 | % | ||||||||||
2010 | 2.9 | % | -0.7 | % | 5.9 | % | 0.6 | % | 4.8 | % | 1.7 | % | -1.0 | % | 3.5 | % | 4.5 | % | -1.5 | % | 19.0 | % | ||||||||||
10Delta | 2.0 | % | -4.0 | % | 3.0 | % | 0.9 | % | 1.4 | % | -1.1 | % | 1.3 | % | 0.9 | % | 1.9 | % | -0.8 | % | 3.1 | % | ||||||||||
(1) | The January figures represent the percentage change from the previous October, whereas the remaining figures represent the percentage change from the previous month. |
A graph of the sequential daily sales change pattern discussed above, starting with a base of '100' in the previous October and ending with the next October, would be as follows:
3
Several observations stand out while viewing the 2012 sequential pattern: (1) The direction of the historical sequential pattern (increased daily sales on a sequential basis in February, March, May, June, August, and September and decreased daily sales on a sequential basis in April and July) has played out each month; however, the cumulative growth in the daily sales from January to October has fallen short of the benchmark figure and of the actual results in 2011 and 2010. (2) The magnitude of the February and May '12Delta' of approximately -2.8% was similar. This fact, as well as the choppiness of the year in general, caused us to approach the year with a conservative tone. (3) The weakness in 2012 was amplified in the first three quarters of the year by changes in foreign currencies (primarily Canada) relative to the U.S. dollar as indicated earlier.
END MARKET PERFORMANCE:
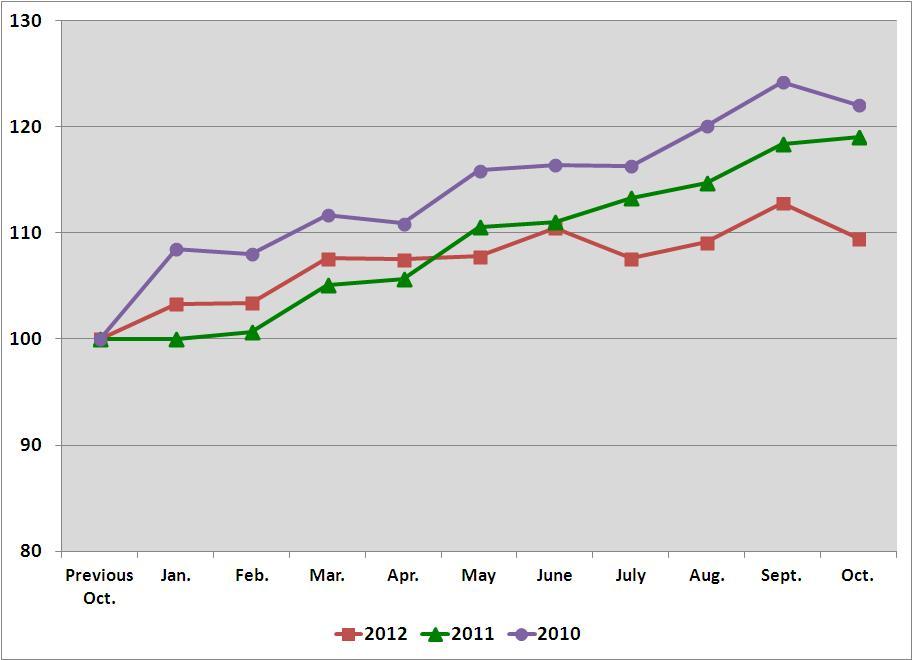
Fluctuations in end market business – The sequential trends noted above were directly linked to fluctuations in our end markets. To place this in perspective – approximately 50% of our business has historically been with customers engaged in some type of manufacturing. The daily sales to these customers grew in the first, second, third, and fourth quarters (when compared to the same quarter in the previous year), and for the year, as follows:
Q1 | Q2 | Q3 | Q4 | Annual | ||||||||||
2012 | 20.3 | % | 15.8 | % | 14.0 | % | 9.7 | % | 14.9 | % | ||||
2011 | 15.5 | % | 18.5 | % | 18.3 | % | 21.0 | % | 20.0 | % | ||||
2010 | 15.7 | % | 29.8 | % | 30.6 | % | 17.7 | % | 22.4 | % | ||||
Our manufacturing business consists of two subsets: the industrial production business (this is business where we supply products that become part of the finished goods produced by our customers) and the maintenance portion (this is business where we supply products that maintain the facility or the equipment of our customers engaged in manufacturing). The industrial business is more fastener centered, while the maintenance portion is represented by all product categories.
In the second, third, and fourth quarters of 2012, the decrease in the rate of growth was more pronounced in our industrial production business. This is in sharp contrast to the first quarter of 2012 where the growth was more pronounced in the industrial production business, a trend that had also existed in 2011 and 2010. The first quarter and prior quarters were a direct counter to the 2009 contraction, which was more severe in our industrial production business and less severe in the maintenance portion of our manufacturing business.
The best way to understand the change in our industrial production business is to examine the results in our fastener product line. In the first three months of 2012, the daily sales growth in our fastener product line was approximately 15.4%. This growth dropped to 10.5%, 6.1%, and 8.6% in April, May, and June, respectively, and then averaged 6.0% and 2.6% in the third and fourth quarters, respectively. By contrast, the best way to understand the change in the maintenance portion of the manufacturing business is to examine the results in our non-fastener product lines. In the first three months of 2012, the daily sales growth in our non-fastener business was approximately 25.1%. This dropped to 24.4%, 19.0%, and 19.6% in April, May, and June, respectively, and averaged 18.0% and 13.6% in the third and fourth quarters, respectively. The non-fastener business has demonstrated relative resilience in 2012, when compared to our fastener business and to the distribution industry in general, due to our strong FAST SolutionsSM (industrial vending) program; this is discussed in greater detail later in this document.
The patterns related to the industrial production business, as noted above, are influenced by the movements noted in the Purchasing Manufacturers Index ('PMI') published by the Institute for Supply Management (http://www.ism.ws/), which is a composite index of economic activity in the United States manufacturing sector. The PMI in 2012, 2011, and 2010 was as follows:
Jan. | Feb. | Mar. | Apr. | May | June | July | Aug. | Sept. | Oct. | Nov. | Dec. | ||||||||||||||||||||||||
2012 | 54.1 | 52.4 | 53.4 | 54.8 | 53.5 | 49.7 | 49.8 | 49.6 | 51.5 | 51.7 | 49.5 | 50.7 | |||||||||||||||||||||||
2011 | 59.9 | 59.8 | 59.7 | 59.7 | 54.2 | 55.8 | 51.4 | 52.5 | 52.5 | 51.8 | 52.2 | 53.1 | |||||||||||||||||||||||
2010 | 56.7 | 55.8 | 59.3 | 59.0 | 58.8 | 56.0 | 55.7 | 57.4 | 56.4 | 57.0 | 58.0 | 57.3 | |||||||||||||||||||||||
For background to readers not familiar with the PMI index, it is a monthly indicator of the economic health of the manufacturing sector. Five major indicators that influence the PMI index are new orders, inventory levels, productions, supplier deliveries, and the employment environment. When a PMI of 50 or higher is reported, this indicates expansion in the manufacturing industry compared to the previous month. If the PMI is below 50, this represents a contraction in the manufacturing sector.
4
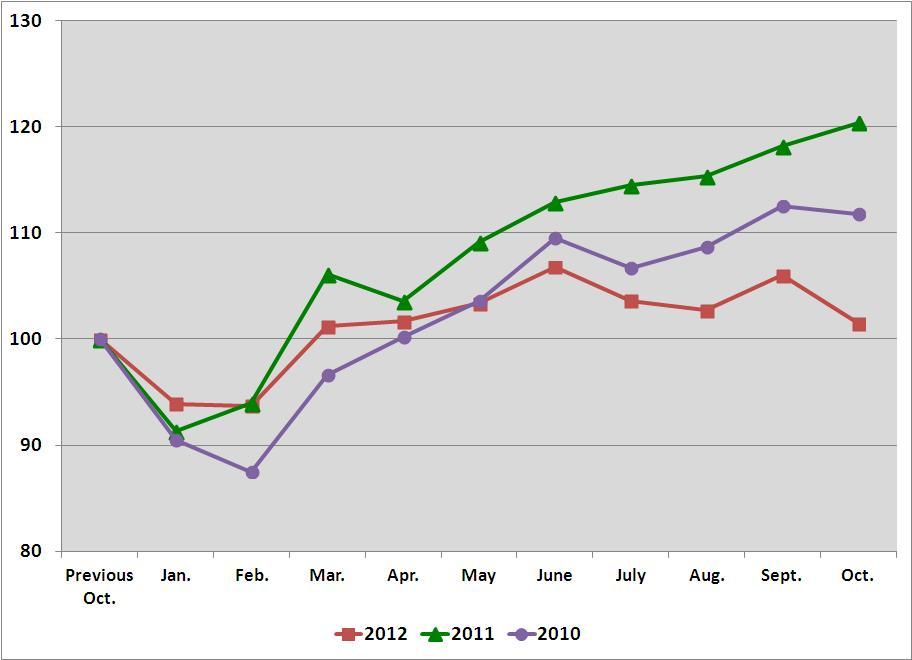
Our non-residential construction customers have historically represented 20% to 25% of our business. The daily sales to these customers grew or contracted in the first, second, third, and fourth quarters (when compared to the same quarter in the previous year), and for the year, as follows:
Q1 | Q2 | Q3 | Q4 | Annual | ||||||||||
2012 | 17.1 | % | 12.7 | % | 8.2 | % | 4.2 | % | 10.3 | % | ||||
2011 | 17.7 | % | 15.8 | % | 15.8 | % | 17.4 | % | 17.1 | % | ||||
2010 | -14.7 | % | 0.5 | % | 6.3 | % | 10.3 | % | -0.3 | % | ||||
We believe the weakness in the economy in the fourth quarter of 2012, particularly in the non-residential construction market, was amplified by the political uncertainty in the United States.
A graph of the sequential daily sales trends to these two end markets in 2012, 2011, and 2010, starting with a base of '100' in the previous October and ending with the next October, would be as follows:
Manufacturing
Non-Residential Construction
5
GROWTH DRIVERS OF OUR BUSINESS
We grow by continuously adding customers and by increasing the activity with each customer. We believe this growth is enhanced by our close proximity to our customers, which allows us to provide a range of services and product availability that our competitors can't easily match. Historically, we expanded our reach by opening stores at a very fast pace. These openings were initially in the United States, but expanded beyond the United States beginning in the mid 1990's.
In our first ten years of being public (1987 to 1997), we opened stores at a rate approaching 30% per year. In the next ten years, we opened stores at an annual rate of approximately 10% to 15% and, over the last five years, at a rate of approximately 3% to 8% (we currently expect to open approximately 65 to 80 stores in 2013, or approximately 2.5% to 3.0%). As we gained proximity to more customers, we continued to diversify our growth drivers. This was done to provide existing store personnel with more tools to grow their business organically, and the results of this are reflected in our earlier discussion on sales growth at stores opened greater than five years. In the early 1990's, we began to expand our product lines, and we added new product knowledge to our bench. This was our first big effort to diversify our growth drivers. The next step began in the mid to late 1990's when we began to add sales personnel with certain specialties or focus. This began with our National Accounts group in 1995, and, over time, has expanded to include individuals dedicated to: (1) sales related to our internal manufacturing division, (2) government sales, (3) internet sales, (4) specific products (most recently metal working), and (5) FAST SolutionsSM (industrial vending). Another step occurred at our sales locations (this includes Fastenal stores as well as strategic account stores and in-plant locations) and at our distribution centers, and began with a targeted merchandising and inventory placement strategy that included our 'Customer Service Project' approximately ten years ago and our 'Master Stocking Hub' initiative approximately five years ago. This strategy allowed us to better target where to stock certain products (local store, regional distribution center, master stocking hub, or supplier) and allowed us to improve our fulfillment, lower our freight costs, and improve our ability to serve a broader range of customers.
Our FAST SolutionsSM (industrial vending) operation is a rapidly expanding component of our business. We believe industrial vending is the next logical chapter in the Fastenal story; we also believe it has the potential to be transformative to industrial distribution, and that we have a 'first mover' advantage. We are investing aggressively to maximize this advantage. At our investor day in May 2011, we discussed our progress with industrial vending. In addition to our discussion regarding progress, we discussed our goals with the rollout of the industrial vending machines. One of the goals we identified related to our rate of 'machine signings' (the first category below) – our goal was simple, sign 2,500+ machines per quarter (or an annualized run rate of 10,000 machines). In 2012, we hit our annual goal of 10,000 machines during July, and the momentum has continued as we finished the year. We intend to continue our aggressive push with FAST SolutionsSM (industrial vending) and, to this end, have established an internal goal to sign 30,000 machines in 2013, or 2,500 per month rather than per quarter. This is an aggressive goal, but we believe we can hit this run rate during 2013. In addition, during 2012 we developed plans to (1) reinvigorate our fastener growth and to (2) improve the performance (i.e. sales growth) at under-performing locations. These plans centered on expanding our sales team for industrial production business, improving our delivery systems for other fastener business, and expanding the team that supports under-performing stores and districts.
6
The following table includes some statistics regarding our industrial vending business (note - we added the third category of information this quarter to highlight the mix change in the machines deployed as our business expands beyond the flagship FAST 5000 machine):
Q1 | Q2 | Q3 | Q4 | Annual | |||||||||||
Number of vending machines in | 2012 | 4,568 | 4,669 | 5,334 | 5,591 | 20,162 | |||||||||
contracts signed during the period1 | 2011 | 1,405 | 2,107 | 2,246 | 2,084 | 7,842 | |||||||||
2010 | 257 | 420 | 440 | 792 | 1,909 | ||||||||||
Cumulative machines installed2 | 2012 | 9,798 | 13,036 | 17,013 | 21,095 | ||||||||||
2011 | 2,659 | 3,867 | 5,642 | 7,453 | |||||||||||
2010 | 892 | 1,184 | 1,515 | 1,925 | |||||||||||
Percent of installed machines that are a FAST 5000 | 2012 | 69.7 | % | 65.9 | % | 60.6 | % | 58.0 | % | ||||||
(our most common helix vending machine) | 2011 | 82.6 | % | 77.5 | % | 75.0 | % | 72.5 | % | ||||||
2010 | 99.5 | % | 97.3 | % | 92.4 | % | 87.8 | % | |||||||
Percent of total net sales to | 2012 | 17.8 | % | 20.8 | % | 23.2 | % | 25.8 | % | ||||||
customers with vending machines3 | 2011 | 8.9 | % | 10.5 | % | 13.1 | % | 15.7 | % | ||||||
2010 | 3.4 | % | 4.6 | % | 6.1 | % | 7.5 | % | |||||||
Daily sales growth to customers | 2012 | 33.9 | % | 34.3 | % | 32.9 | % | 28.6 | % | ||||||
with vending machines4 | 2011 | 50.6 | % | 43.9 | % | 42.5 | % | 40.7 | % | ||||||
2010 | 37.4 | % | 54.0 | % | 56.4 | % | 60.2 | % | |||||||
1 | This represents the gross number of machines signed during the quarter, not the number of contracts. |
2 | This represents the number of machines installed and dispensing product on the last day of the quarter. |
3 | The percentage of total sales (vended and traditional) to customers currently using a vending solution. |
4 | The growth in total sales (vended and traditional) to customers currently using a vending solution compared to the comparable period in the preceding year. |
7
PROFIT DRIVERS OF OUR BUSINESS
We grow our profits by continuously working to grow sales and to improve our relative profitability. We also grow our profits by allowing our inherent profitability to shine through – we refer to this as the 'pathway to profit'. The distinction is important.
We achieve improvements in our relative profitability by increasing our gross margin, by structurally lowering our operating expenses, or both. We advance on the 'pathway to profit' by increasing the average store size (measured in terms of monthly sales), and by allowing the changing store mix to improve our profits. This is best explained by comparing the varying profitability of our 'traditional' stores in the table below. The average store size for the group, and the average age, number of stores, and pre-tax earnings data by store size for the fourth quarter of 2012, 2011, and 2010, respectively, were as follows:
Sales per Month | Average Age (Years) | Number of Stores | Percentage of Stores | Pre-Tax Earnings Percentage | ||||||||
Three months ended December 31, 2012 | Average store sales = $83,098 | |||||||||||
$0 to $30,000 | 4.7 | 304 | 11.5 | % | -14.4 | % | ||||||
$30,001 to $60,000 | 7.6 | 830 | 31.3 | % | 12.2 | % | ||||||
$60,001 to $100,000 | 10.0 | 759 | 28.6 | % | 21.3 | % | ||||||
$100,001 to $150,000 | 12.9 | 375 | 14.1 | % | 26.0 | % | ||||||
Over $150,000 | 14.9 | 272 | 10.3 | % | 28.8 | % | ||||||
Strategic Account/Overseas Store | 112 | 4.2 | % | |||||||||
Company Total | 2,652 | 100.0 | % | 20.9 | % | |||||||
Three months ended December 31, 2011 | Average store sales = $78,781 | |||||||||||
$0 to $30,000 | 3.8 | 353 | 13.7 | % | -13.7 | % | ||||||
$30,001 to $60,000 | 7.2 | 882 | 34.1 | % | 11.7 | % | ||||||
$60,001 to $100,000 | 9.4 | 680 | 26.3 | % | 21.3 | % | ||||||
$100,001 to $150,000 | 12.0 | 352 | 13.6 | % | 25.9 | % | ||||||
Over $150,000 | 15.1 | 227 | 8.8 | % | 27.4 | % | ||||||
Strategic Account/Overseas Store | 91 | 3.5 | % | |||||||||
Company Total | 2,585 | 100.0 | % | 20.2 | % | |||||||
Three months ended December 31, 2010 | Average store sales = $67,643 | |||||||||||
$0 to $30,000 | 3.8 | 462 | 18.6 | % | -13.2 | % | ||||||
$30,001 to $60,000 | 6.8 | 952 | 38.2 | % | 12.7 | % | ||||||
$60,001 to $100,000 | 9.7 | 573 | 23.0 | % | 22.0 | % | ||||||
$100,001 to $150,000 | 12.2 | 276 | 11.1 | % | 25.2 | % | ||||||
Over $150,000 | 15.2 | 152 | 6.1 | % | 27.1 | % | ||||||
Strategic Account/Overseas Store | 75 | 3.0 | % | |||||||||
Company Total | 2,490 | 100.0 | % | 18.7 | % | |||||||
Note – Amounts may not foot due to rounding difference.
When we originally announced the 'pathway to profit' strategy in 2007, our goal was to increase our pre-tax earnings, as a percentage of sales, from 18% to 23%. This goal was to be accomplished by slowly moving the mix from the first three categories ($0 to $30,000, $30,001 to $60,000, and $60,001 to $100,000, these groups represented 76.5% of our store base in the first three months of 2007, the last quarter before we announced the 'pathway to profit') to the last three categories ($60,001 to $100,000, $100,001 to $150,000, and over $150,000, these groups represented 53.0% of our store base in the fourth quarter of 2012) and by increasing the average store sales to approximately $125,000 per month. The weak economic environment in 2009 caused our average store size to decrease, and consequently lowered our level of profitability; however, subsequent to 2009 we improved our gross margin and structurally lowered our operating expenses. This improvement allowed us to amplify the 'pathway to profit' and effectively lowered the average store size required to hit our 23% goal. Today we believe we can accomplish our 'pathway to profit' goal with average store sales of approximately $100,000 to $110,000 per month. In the second quarter of 2012 we achieved a pre-tax earnings percentage of 22.2% with average store sales of $89,169 per month.
Note – Dollar amounts in this section are presented in whole dollars, not thousands.
8
Store Count and Full-Time Equivalent (FTE) Headcount – The table that follows highlights certain impacts on our business of the 'pathway to profit' since its introduction in 2007. Under the 'pathway to profit' we increased both our store count and our store FTE headcount during 2007 and 2008. However, the rate of increase in store locations slowed and our FTE headcount for all types of personnel was reduced when the economy weakened late in 2008. In the table that follows, we refer to our 'store' net sales, locations, and personnel. When we discuss 'store' net sales, locations, and personnel, we are referring to (1) 'Fastenal' stores and (2) strategic account stores. 'Fastenal' stores are either a 'traditional' store, the typical format in the United States or Canada, or an 'overseas' store, which is the typical format outside the United States and Canada. This is discussed in greater detail in our 2011 annual report on Form 10-K. Strategic account stores are stores that are focused on selling to a group of large customers in a limited geographic market. The sales, outside of our 'store' group, relate to either (1) our in-plant locations, (2) the portion of our internally manufactured product that is sold directly to a customer and not through a store (including our Holo-Krome business acquired in December 2009), or (3) our direct import business.
The breakdown of our sales, the average monthly sales per store, the number of stores at quarter end, the average headcount at our stores during a quarter, the average FTE headcount during a quarter, and the percentage change were as follows for the first quarter of 2007 (the last completed quarter before we began the 'pathway to profit'), for the third quarter of 2008 (our peak quarter before the economy weakened), and for each of the last five quarters:
Q1 2007 | Q3 2008 | Q4 2011 | Q1 2012 | Q2 2012 | Q3 2012 | Q4 2012 | ||||||||||||||
Total net sales reported | $489,157 | $625,037 | $697,804 | $768,875 | $804,890 | $802,577 | $757,235 | |||||||||||||
Less: Non-store sales (approximate) | 40,891 | 57,267 | 86,737 | 92,459 | 98,735 | 100,124 | 95,951 | |||||||||||||
Store net sales (approximate) | $448,266 | $567,770 | $611,067 | $676,416 | $706,155 | $702,453 | $661,284 | |||||||||||||
% change since Q1 2007 | 26.7 | % | 36.3 | % | 50.9 | % | 57.5 | % | 56.7 | % | 47.5 | % | ||||||||
% change (twelve months) | 17.5 | % | 21.0 | % | 20.2 | % | 14.6 | % | 10.1 | % | 8.2 | % | ||||||||
Percentage of sales through a store | 92 | % | 91 | % | 88 | % | 88 | % | 88 | % | 88 | % | 87 | % | ||||||
Average monthly sales per store | $72 | $82 | $79 | $86 | $89 | $88 | $83 | |||||||||||||
(using ending store count) | ||||||||||||||||||||
% change since Q1 2007 | 13.9 | % | 9.7 | % | 19.4 | % | 23.6 | % | 22.2 | % | 15.3 | % | ||||||||
% change (twelve months) | 9.3 | % | 16.2 | % | 16.2 | % | 11.3 | % | 6.0 | % | 5.1 | % | ||||||||
9
Q1 2007 | Q3 2008 | Q4 2011 | Q1 2012 | Q2 2012 | Q3 2012 | Q4 2012 | ||||||||||||||
Store locations - quarter end count | 2,073 | 2,300 | 2,585 | 2,611 | 2,635 | 2,650 | 2,652 | |||||||||||||
% change since Q1 2007 | 11.0 | % | 24.7 | % | 26.0 | % | 27.1 | % | 27.8 | % | 27.9 | % | ||||||||
% change (twelve months) | 7.2 | % | 3.8 | % | 3.5 | % | 3.0 | % | 3.3 | % | 2.6 | % | ||||||||
Store personnel - absolute headcount | 6,849 | 9,123 | 10,328 | 10,486 | 10,637 | 10,604 | 10,347 | |||||||||||||
% change since Q1 2007 | 33.2 | % | 50.8 | % | 53.1 | % | 55.3 | % | 54.8 | % | 51.1 | % | ||||||||
% change (twelve months) | 17.9 | % | 14.1 | % | 12.2 | % | 9.3 | % | 5.4 | % | 0.2 | % | ||||||||
Store personnel - FTE | 6,383 | 8,280 | 8,684 | 8,900 | 9,126 | 9,244 | 9,035 | |||||||||||||
Non-store selling personnel - FTE | 616 | 599 | 953 | 998 | 1,054 | 1,066 | 1,070 | |||||||||||||
Sub-total of all sales personnel - FTE | 6,999 | 8,879 | 9,637 | 9,898 | 10,180 | 10,310 | 10,105 | |||||||||||||
Distribution personnel-FTE | 1,646 | 1,904 | 1,820 | 1,815 | 1,881 | 1,887 | 1,872 | |||||||||||||
Manufacturing personnel - FTE 1 | 316 | 340 | 516 | 527 | 545 | 544 | 544 | |||||||||||||
Administrative personnel-FTE | 767 | 805 | 796 | 796 | 794 | 808 | 811 | |||||||||||||
Sub-total of non-sales personnel - FTE | 2,729 | 3,049 | 3,132 | 3,138 | 3,220 | 3,239 | 3,227 | |||||||||||||
Total - average FTE headcount | 9,728 | 11,928 | 12,769 | 13,036 | 13,400 | 13,549 | 13,332 | |||||||||||||
% change since Q1 2007 | ||||||||||||||||||||
Store personnel - FTE | 29.7 | % | 36.0 | % | 39.4 | % | 43.0 | % | 44.8 | % | 41.5 | % | ||||||||
Non-store selling personnel - FTE | -2.8 | % | 54.7 | % | 62.0 | % | 71.1 | % | 73.1 | % | 73.7 | % | ||||||||
Sub-total of all sales personnel - FTE | 26.9 | % | 37.7 | % | 41.4 | % | 45.4 | % | 47.3 | % | 44.4 | % | ||||||||
Distribution personnel-FTE | 15.7 | % | 10.6 | % | 10.3 | % | 14.3 | % | 14.6 | % | 13.7 | % | ||||||||
Manufacturing personnel-FTE 1 | 7.6 | % | 63.3 | % | 66.8 | % | 72.5 | % | 72.2 | % | 72.2 | % | ||||||||
Administrative personnel-FTE | 5.0 | % | 3.8 | % | 3.8 | % | 3.5 | % | 5.3 | % | 5.7 | % | ||||||||
Sub-total of non-sales personnel - FTE | 11.7 | % | 14.8 | % | 15.0 | % | 18.0 | % | 18.7 | % | 18.2 | % | ||||||||
Total - average FTE headcount | 22.6 | % | 31.3 | % | 34.0 | % | 37.7 | % | 39.3 | % | 37.0 | % | ||||||||
% change (twelve months) | ||||||||||||||||||||
Store personnel - FTE | 15.2 | % | 14.1 | % | 13.7 | % | 10.6 | % | 7.1 | % | 4.0 | % | ||||||||
Non-store selling personnel - FTE | -2.4 | % | 33.8 | % | 28.1 | % | 24.0 | % | 15.9 | % | 12.3 | % | ||||||||
Sub-total of all sales personnel - FTE | 13.8 | % | 15.8 | % | 15.0 | % | 11.8 | % | 8.0 | % | 4.9 | % | ||||||||
Distribution personnel-FTE | 6.0 | % | 14.1 | % | 12.9 | % | 7.1 | % | 3.1 | % | 2.9 | % | ||||||||
Manufacturing personnel - FTE 1 | 1.8 | % | 16.2 | % | 14.3 | % | 10.8 | % | 6.0 | % | 5.4 | % | ||||||||
Administrative personnel - FTE | 7.9 | % | 7.0 | % | 4.7 | % | 1.4 | % | -0.4 | % | 1.9 | % | ||||||||
Sub-total of non-sales personnel - FTE | 6.0 | % | 12.5 | % | 10.9 | % | 6.2 | % | 2.7 | % | 3.0 | % | ||||||||
Total - average FTE headcount | 11.7 | % | 15.0 | % | 14.0 | % | 10.4 | % | 6.7 | % | 4.4 | % | ||||||||
1 | The distribution and manufacturing headcount was impacted by the addition of 92 employees with the acquisition of Holo-Krome in December 2009. |
10
STATEMENT OF EARNINGS INFORMATION (percentage of net sales) for the periods ended December 31: | |||||||||
Twelve-month period | |||||||||
2012 | 2011 | 2010 | |||||||
Net sales | 100.0 | % | 100.0 | % | 100.0 | % | |||
Gross profit | 51.5 | % | 51.8 | % | 51.8 | % | |||
Operating and administrative expenses | 30.0 | % | 31.1 | % | 32.8 | % | |||
(Gain) loss on sale of property and equipment | 0.0 | % | 0.0 | % | 0.0 | % | |||
Operating income | 21.5 | % | 20.8 | % | 19.0 | % | |||
Interest income | 0.0 | % | 0.0 | % | 0.0 | % | |||
Earnings before income taxes | 21.5 | % | 20.8 | % | 19.0 | % | |||
Note – Amounts may not foot due to rounding difference. | |||||||||
Gross profit – percentage for 2012 decreased from 2011, but stabilized in the second, third, and fourth quarters of 2012.
The gross profit percentage in the first, second, third, and fourth quarters was as follows:
Q1 | Q2 | Q3 | Q4 | |||||||||
2012 | 51.3 | % | 51.6 | % | 51.6 | % | 51.6 | % | ||||
2011 | 52.0 | % | 52.2 | % | 51.9 | % | 51.2 | % | ||||
2010 | 51.1 | % | 52.1 | % | 51.8 | % | 52.0 | % | ||||
The fluctuations in our gross profit percentages are typically driven by changes in: (1) transactional gross profit, (2) organizational gross profit, and (3) vendor incentive gross profit. The transactional gross profit represents the gross profit realized from the day-to-day fluctuations in customer pricing relative to product and freight costs. The organizational gross profit represents the component of gross profit we attribute to buying scale and efficiency gains. The third component relates to vendor volume allowances. In the short-term, periods of inflation or deflation can influence the first two categories, while sudden changes in business volume can influence the third.
We believe a normal gross profit percentage range for our business is 51% to 53%. This is based on our current mix of products, geographies, end markets, and end market uses (such as industrial production business versus maintenance business). Our business operated below our expected gross profit range at the end of 2009, and expanded into the low end of this range during 2010. In the second quarter of 2010, we moved into the middle of the range as the three components of gross profit improved, the contribution being split fairly evenly between the three components. We remained in the middle of the range until the fourth quarter of 2011. In the fourth quarter of 2011, our gross margin felt pressure and dropped to the lower end of the range. This drop was primarily due to changes in our transactional margin (primarily due to changes in product and customer mix), lower vendor incentive gross profit, and lower freight utilization. The latter two items created half of the gross margin drop and are more of a seasonal issue. In the first quarter of 2012, our gross margin improved nominally over the previous quarter. This was primarily caused by the seasonal improvement of vendor volume allowances as rising fuel prices offset our improvements in freight utilization. In the second, third, and fourth quarters of 2012, our gross margin improved when compared to the first quarter. Most of this improvement related to improvements in our transactional gross margin. The improvement was partially offset by the weakening of our selling prices in certain foreign markets due to changes in the exchange rate. One item of note, in the fourth quarter of 2012 we experienced a drop off in the freight component of our gross margin due to lower freight utilization, a typical pattern due to the seasonal drop off in business; this gross margin decline was offset by an improvement in the remaining portion of our transactional gross margin that centers on product gross margin.
Operating and administrative expenses - improved relative to sales in both 2012 as a whole and the fourth quarter of 2012 versus 2011 as a whole and the fourth quarter of 2011.
Historically, our two largest components of operating and administrative expenses have consisted of employee related expenses (approximately 65% to 70%) and occupancy related expenses (approximately 15% to 20%). The remaining expenses cover a variety of items with selling transportation typically being the largest.
11
The three largest components of operating and administrative expenses grew as follows for the periods ended December 31 (compared to the comparable periods in the preceding year):
Twelve-month period | |||||||||
2012 | 2011 | 2010 | |||||||
Employee related expenses | 10.1 | % | 19.7 | % | 14.6 | % | |||
Occupancy related expenses | 4.8 | % | 7.4 | % | 5.7 | % | |||
Selling transportation costs | 10.1 | % | 26.5 | % | -0.2 | % | |||
Employee related expenses include: (1) payroll (which includes cash compensation, stock option expense, and profit sharing), (2) health care, (3) personnel development, and (4) social taxes. The increase in 2012 was driven by the following factors: (1) average employee headcount, measured on a full-time equivalent basis, grew 8.7%, (2) sales commissions grew, (3) bonus amounts related to our growth drivers grew (this includes items such as industrial vending bonuses and manager minimum pay adjustments), and (4) our profit sharing contribution grew. The increase in 2011 was driven by the following factors: (1) employee headcount, measured on a full-time equivalent basis, grew 15.0%, (2) sales commissions grew (this increase was amplified by stronger sales growth relative to 2010, which had a meaningful impact on the commission earned, and higher gross profit margins), (3) total bonuses earned increased due to our profit growth, (4) hours worked per employee grew, and (5) our profit sharing contribution grew.
Occupancy related expenses include: (1) building rent and depreciation, (2) building utility costs, (3) equipment related to our stores and distribution locations, and (4) FAST SolutionsSM (industrial vending) equipment (we consider the vending equipment to be a logical extension of our store operation and classify the expense as occupancy). The increase in 2012 was driven by (1) a dramatic increase in the amount of FAST SolutionsSM (industrial vending) equipment as discussed earlier in this document, (2) an increase in the number of locations, and (3) increased investment in our distribution infrastructure over the last several years. Almost all of our occupancy increase in 2012 related to item (4) a dramatic increase in the amount of FAST SolutionsSM (industrial vending) equipment, as our energy savings offset most of the increase relating to items (1) and (3). The energy savings were driven by our efforts to lower energy consumption, a mild winter, and a drop in natural gas prices during the heating season. The increase in 2011 was driven by the same factors noted above with one exception; in 2011 approximately 50% of the increase was due to rising utility costs.
Our selling transportation costs consist primarily of our store fleet as most of the distribution fleet costs are included in the cost of sales. Selling transportation costs included in operating and administrative expenses increased in 2012; however, they increased at a rate less than sales growth. The increase in 2012 was primarily due to elevated fuel prices in the first quarter, and, in the case of the first, second, and third quarters, the impact of the 2011 expansion of our fleet related to additions to our non-store sales personnel, particularly our industrial vending vehicles. The increase in 2011 was primarily related to the increase in per gallon fuel costs discussed below and the expansion of our fleet related to additions to our non-store sales personnel, particularly our industrial vending vehicles. Our selling and transportation costs in the fourth quarter of 2012 were comparable to those in the fourth quarter of 2011 because the per gallon fuel costs only grew nominally and the number of our industrial vending vehicles had normalized. Conversely, the increase in the fourth quarter of 2011 from the fourth quarter of 2010 was driven by the dramatic increase in per gallon fuel costs and the ramp up in the number of our industrial vending vehicles.
12
The last several years have seen meaningful swings in the cost of diesel fuel and gasoline – During the first, second, third, and fourth quarters of 2012, our total vehicle fuel costs were approximately $10.6, $10.8, $10.8, and $10.3 million, respectively. During the first, second, third, and fourth quarters of 2011, our total vehicle fuel costs were approximately $8.6, $10.5, $9.8, and $9.8 million, respectively. The changes resulted from variations in fuel costs, variations in the service levels provided to our stores from our distribution centers, changes in the number of vehicles at our store locations, and changes in the number of other sales centered vehicles as a result of store openings and the expansion of our non-store sales force. These fuel costs include the fuel utilized in our distribution vehicles (semi-tractors, straight trucks, and sprinter trucks) which is recorded in cost of sales and the fuel utilized in our store delivery and other sales centered vehicles which is included in operating and administrative expenses (the split in the last several years has been approximately 50:50 between distribution and store and other sales centered use).
The average per gallon fuel costs (in actual dollars) and the percentage change (on a year-over-year basis) for the last three years was as follows:
Per gallon average price | Q1 | Q2 | Q3 | Q4 | Annual Average1 | |||||||||||
2012 price | ||||||||||||||||
Diesel fuel | $ | 3.92 | 3.98 | 3.88 | 4.05 | 3.96 | ||||||||||
Gasoline | $ | 3.53 | 3.73 | 3.61 | 3.53 | 3.60 | ||||||||||
2011 price | ||||||||||||||||
Diesel fuel | $ | 3.60 | 4.04 | 3.90 | 3.87 | 3.85 | ||||||||||
Gasoline | $ | 3.22 | 3.78 | 3.62 | 3.37 | 3.50 | ||||||||||
2010 price | ||||||||||||||||
Diesel fuel | $ | 2.89 | 3.06 | 2.96 | 3.14 | 3.01 | ||||||||||
Gasoline | $ | 2.68 | 2.80 | 2.71 | 2.84 | 2.76 | ||||||||||
Per gallon price change | Q1 | Q2 | Q3 | Q4 | Annual1 | |||||||||||
2012 change | ||||||||||||||||
Diesel fuel | 8.9 | % | -1.5 | % | -0.5 | % | 4.7 | % | 2.9 | % | ||||||
Gasoline | 9.6 | % | -1.3 | % | -0.3 | % | 4.7 | % | 2.9 | % | ||||||
2011 change | ||||||||||||||||
Diesel fuel | 24.6 | % | 32.0 | % | 31.8 | % | 23.2 | % | 27.9 | % | ||||||
Gasoline | 20.1 | % | 35.0 | % | 33.6 | % | 18.7 | % | 26.8 | % | ||||||
1 | Average of the four quarterly figures contained in the table. |
Income taxes – Incomes taxes, as a percentage of earnings before income taxes, were approximately 37.6% and 37.8% for 2012 and 2011, respectively. As our international business and profits grow over time, the lower income tax rates in those jurisdictions, relative to the United States, have begun to lower our effective tax rate.
13
OPERATIONAL WORKING CAPITAL:
The year-over-year comparison and the related dollar and percentage changes related to accounts receivable and inventories were as follows:
Balance at December 31: | Twelve Month Dollar Change | Twelve Month Percentage Change | ||||||||||||||||||||
2012 | 2011 | 2010 | 2012 | 2011 | 2012 | 2011 | ||||||||||||||||
Accounts receivable, net | $ | 372,159 | 338,594 | 270,133 | 33,565 | 68,461 | 9.9 | % | 25.3 | % | ||||||||||||
Inventories | $ | 715,383 | 646,152 | 557,369 | 69,231 | 88,783 | 10.7 | % | 15.9 | % | ||||||||||||
Operational working capital1 | $ | 1,087,542 | 984,746 | 827,502 | 102,796 | 157,244 | 10.4 | % | 19.0 | % | ||||||||||||
Sales in last two months | $ | 468,696 | 451,069 | 370,582 | 17,627 | 80,487 | 3.9 | % | 21.7 | % | ||||||||||||
The growth in accounts receivable noted above was driven by our sales growth in the final two months of the period. The strong growth in recent years with our international business and with large customer accounts has created some difficulty with managing the growth of accounts receivable relative to the growth in sales. This was exaggerated by the short month in December 2012 versus 2011 (19 business days versus 21 days) and due to a drop off in payment activity due to Christmas Day and New Year's Day falling on a Tuesday resulting in a number of our customers being shut down for the last full week of December. We saw a similar short month impact in September 2012. Also as indicated above, our sales in the last two months of the year grew from 2011 to 2012 by 3.9%; however, our daily sales growth in the last two months of 2012 was 9.1% which resulted in increased year end receivables.
Our growth in inventory balances over time does not have as direct a relationship to our monthly sales patterns as does our growth in accounts receivable. This is impacted by other aspects of our business. For example, the dramatic economic slowdown in late 2008 and early 2009 caused our inventory to spike. This occurred because the lead time for inventory procurement is typically longer than the visibility we have into future monthly sales patterns. Over the last decade, we increased our relative inventory levels due to the following: (1) new store openings, (2) expanded stocking breadth at individual stores, (3) expanded stocking breadth at our distributions centers (for example, our master stocking hub in Indianapolis expanded its product breadth over six fold from 2005 to 2011), (4) expanded direct sourcing, (5) expanded exclusive brands (private label), and (6) expanded FAST SolutionsSM (industrial vending) solutions. Items (4), (5), and (6), plus the impact of strong growth with national accounts and international expansion, created most of our inventory growth in both 2012 and 2011.
1 For purposes of this discussion, we are defining operational working capital as accounts receivable, net and inventories.
BALANCE SHEET AND CASH FLOW:
Our balance sheet continues to be very strong and our operations have good cash generating characteristics. During the fourth quarter of 2012, we generated $107,196 (or 108.6% of net earnings) of operating cash flow. During all of 2012, we generated $396,292 (or 94.2% of net earnings) of operating cash flow. Our first quarter typically has stronger cash flow characteristics due to the timing of tax payments; this benefit reverses itself in the second, third, and fourth quarters as income tax payments go out in April, June, September, and December. The remaining amounts of cash flow from operating activities are largely linked to the pure dynamics of a distribution business and its strong correlation to working capital as discussed above.
Our strong free cash flow (operating cash flow less net capital expenditures) during 2012 and 2011 allowed us to increase our regular dividends, which we began paying quarterly in 2011. Our dividends (per share basis) were as follows in 2012 and 2011:
2012 | 2011 | |||||
First quarter | $ | 0.17 | 0.25 | |||
Second quarter | $ | 0.17 | 0.13 | |||
Third quarter | $ | 0.19 | 0.13 | |||
Fourth quarter | $ | 0.21 | 0.14 | |||
Supplemental | $ | 0.50 | 0.00 | |||
Total | $ | 1.24 | 0.65 | |||
14
We paid a supplemental dividend late in 2012 due to uncertainties surrounding possible changes in the taxation of dividends. We had previously paid supplemental dividends in 2010 and 2008. We expect to pay a smaller quarterly dividend in the initial quarters of 2013 due to the large payout in late 2012. Our board intends to reassess our dividend payments each quarter as we progress through 2013 with the goal of returning to a quarterly dividend more in-line with the typical quarterly dividend pattern in 2012; this decision will be influenced by (1) the state of the economy, (2) the strength of our free cash flow (defined as operating cash flow less capital expenditures), (3) changes to the taxation of dividends, and (4) other factors deemed relevant by our board of directors.
STOCK REPURCHASE:
We did not purchase any stock in 2012 or 2011. We currently have authority to purchase up to 1,800,000 shares.
FUTURE CASH FLOW:
We remain optimistic about our ability to expand our FAST SolutionsSM (industrial vending), and our ability to dramatically increase the use of automation in our distribution centers. We anticipate these activities will require considerable cash in 2013; because of this, and the large dividend payout late in 2012, we established a $125,000,000 line of credit facility in December 2012 to provide additional cash flow in that month and in 2013 and 2014.
CONFERENCE CALL TO DISCUSS QUARTERLY EARNINGS:
As we previously disclosed, we will host a conference call today to review the quarterly results, as well as current operations. This conference call will be broadcast live over the Internet at 9:00 a.m., central time. To access the webcast, please go to the Fastenal Company Investor Relations Website at http://investor.fastenal.com/events.cfm.
The Fastenal Company logo is available at http://www.globenewswire.com/newsroom/prs/?pkgid=6432.
ADDITIONAL INFORMATION:
This press release contains statements that are not historical in nature and that are intended to be, and are hereby identified as, "forward looking statements" as defined in the Private Securities Litigation Reform Act of 1995, including statements regarding (1) the goals of our long‑term growth strategy, 'pathway to profit', including the growth in average store sales and profitability expected to result from that strategy (including our belief that we can achieve targeted profitability due to an improvement in our gross margins and a lowering of our operating expenses even if our average store sales do not grow as originally expected), (2) the expected rate of new store openings, (3) our belief in the transformative nature of FAST SolutionsSM (industrial vending) and our advantage as a first mover in this area, and our expectations regarding expansion of that business, including our goals regarding our rate of 'machine signings', (4) our plans to reinvigorate our fastener growth and improve sales growth at our under-performing locations, (5) our expected gross profit range, (6) our expected future dividend practices, and (7) our ability to dramatically increase the use of automation at our distribution centers. The following factors are among those that could cause our actual results to differ materially from those predicted in such forward looking statements: (1) a downturn or continued weakness in the economy or in the manufacturing or commercial construction industries, changes in the expected rate of new store openings, difficulties in successfully attracting and retaining additional qualified sales personnel, an inability to realize or sustain improvements in our gross margins and savings from lowering our operating expenses, and difficulties in changing our sales process could adversely impact our ability to achieve the goals of our 'pathway to profit' initiative and the expected time frame for achieving those goals, (2) a downturn or continued weakness in the economy or in the manufacturing or commercial construction industries, a change from that projected in the number of North American markets able to support stores, or an inability to recruit and retain qualified employees could cause the rate of new store openings to change from that expected, (3) a weaker level of industry acceptance or adoption of the vending technology from what we are currently experiencing could cause us to alter our plans to introduce new vending machines or cause us to fail to meet our goals regarding our rate of 'machine signings' or cause industrial vending to be less transformative than expected, (4) our competitors could choose, over time, to open additional locations and to develop their own vending platform which could allow our competitors to replicate our local storefront combined with industrial vending business model mitigating our first mover advantage, (5) difficulties in hiring, relocating, or training qualified sales personnel could adversely impact our ability to reinvigorate our fastener growth and improve sales growth at our under-performing locations, (6) changes in our current mix of products, geographies, end markets, and end market uses could impact our expected gross profit range, (7) changes in our financial condition or results of operations could cause us to modify our expected future dividend practices, (8) changes in tax law and regulations could cause us to change future dividend practices, (9) high expenses involved in procuring the technology necessary for automation could impact our ability to increase the use of automation at our distribution centers, and (10) unpredictable activity by the national government in the United States could cause unusual economic patterns and could impact our business. We assume no obligation to update any forward looking statement or any discussion of risks and uncertainties related to such forward looking statements. A discussion of other risks and uncertainties which could cause our operating results to vary from anticipated results or which could materially adversely affect our business, financial
15
condition, or operating results is included in our 2011 annual report on Form 10-K under the sections captioned Certain Risks and Uncertainties and Item 1A – Risk Factors. FAST-E
16
FASTENAL COMPANY AND SUBSIDIARIES | |||||||
Consolidated Balance Sheets | |||||||
(Amounts in thousands except share information) | |||||||
(Unaudited) | |||||||
Assets | December 31, 2012 | December 31, 2011 | |||||
Current assets: | |||||||
Cash and cash equivalents | $ | 79,611 | 117,676 | ||||
Marketable securities | 354 | 27,165 | |||||
Trade accounts receivable, net of allowance for doubtful accounts of $6,728 and $5,647, respectively | 372,159 | 338,594 | |||||
Inventories | 715,383 | 646,152 | |||||
Deferred income tax assets | 14,420 | 16,718 | |||||
Other current assets | 97,361 | 89,833 | |||||
Prepaid income taxes | 7,368 | — | |||||
Total current assets | 1,286,656 | 1,236,138 | |||||
Property and equipment, less accumulated depreciation | 516,427 | 435,601 | |||||
Other assets, net | 12,749 | 13,209 | |||||
Total assets | $ | 1,815,832 | 1,684,948 | ||||
Liabilities and Stockholders' Equity | |||||||
Current liabilities: | |||||||
Accounts payable | $ | 78,019 | 73,779 | ||||
Accrued expenses | 126,155 | 111,962 | |||||
Income taxes payable | — | 2,077 | |||||
Total current liabilities | 204,174 | 187,818 | |||||
Deferred income tax liabilities | 51,298 | 38,154 | |||||
Stockholders' equity: | |||||||
Preferred stock, 5,000,000 shares authorized | — | — | |||||
Common stock, 400,000,000 shares authorized, 296,564,382 and 295,258,674 shares issued and outstanding, respectively | 2,966 | 2,953 | |||||
Additional paid-in capital | 61,436 | 16,856 | |||||
Retained earnings | 1,477,601 | 1,424,371 | |||||
Accumulated other comprehensive income | 18,357 | 14,796 | |||||
Total stockholders' equity | 1,560,360 | 1,458,976 | |||||
Total liabilities and stockholders' equity | $ | 1,815,832 | 1,684,948 | ||||
17
FASTENAL COMPANY AND SUBSIDIARIES | |||||||||||||
Consolidated Statements of Earnings | |||||||||||||
(Amounts in thousands except earnings per share) | |||||||||||||
(Unaudited) | (Unaudited) | ||||||||||||
Year ended December 31, | Three months ended December 31, | ||||||||||||
2012 | 2011 | 2012 | 2011 | ||||||||||
Net sales | $ | 3,133,577 | 2,766,859 | 757,235 | 697,804 | ||||||||
Cost of sales | 1,519,053 | 1,332,687 | 366,414 | 340,626 | |||||||||
Gross profit | 1,614,524 | 1,434,172 | 390,821 | 357,178 | |||||||||
Operating and administrative expenses | 941,236 | 859,369 | 232,913 | 216,552 | |||||||||
(Gain) loss on sale of property and equipment | (403 | ) | 194 | (136 | ) | 11 | |||||||
Operating income | 673,691 | 574,609 | 158,044 | 140,615 | |||||||||
Interest income | 464 | 472 | 107 | 154 | |||||||||
Earnings before income taxes | 674,155 | 575,081 | 158,151 | 140,769 | |||||||||
Income tax expense | 253,619 | 217,152 | 59,435 | 53,297 | |||||||||
Net earnings | $ | 420,536 | 357,929 | 98,716 | 87,472 | ||||||||
Basic net earnings per share | $ | 1.42 | 1.21 | 0.33 | 0.30 | ||||||||
Diluted net earnings per share | $ | 1.42 | 1.21 | 0.33 | 0.30 | ||||||||
Basic weighted average shares outstanding | 296,089 | 295,054 | 296,457 | 295,231 | |||||||||
Diluted weighted average shares outstanding | 297,151 | 295,869 | 297,339 | 296,253 | |||||||||
18
FASTENAL COMPANY AND SUBSIDIARIES | |||||||
Consolidated Statements of Cash Flows | |||||||
(Amounts in thousands) | |||||||
(Unaudited) | |||||||
Twelve months ended December 31, | |||||||
2012 | 2011 | ||||||
Cash flows from operating activities: | |||||||
Net earnings | $ | 420,536 | 357,929 | ||||
Adjustments to reconcile net earnings to net cash provided by operating activities: | |||||||
Depreciation of property and equipment | 53,459 | 44,113 | |||||
(Gain) loss on sale of property and equipment | (403 | ) | 194 | ||||
Bad debt expense | 9,726 | 9,217 | |||||
Deferred income taxes | 15,442 | 15,747 | |||||
Stock based compensation | 4,800 | 4,050 | |||||
Excess tax benefits from stock based compensation | (10,149 | ) | — | ||||
Amortization of non-compete agreements | 593 | 593 | |||||
Changes in operating assets and liabilities: | |||||||
Trade accounts receivable | (43,291 | ) | (77,678 | ) | |||
Inventories | (69,231 | ) | (88,783 | ) | |||
Other current assets | (7,528 | ) | (19,294 | ) | |||
Accounts payable | 4,240 | 13,305 | |||||
Accrued expenses | 14,193 | 15,550 | |||||
Income taxes | 704 | (3,222 | ) | ||||
Other | 3,201 | (3,232 | ) | ||||
Net cash provided by operating activities | 396,292 | 268,489 | |||||
Cash flows from investing activities: | |||||||
Purchase of property and equipment | (138,406 | ) | (120,043 | ) | |||
Proceeds from sale of property and equipment | 4,524 | 3,554 | |||||
Net decrease in marketable securities | 26,811 | 4,054 | |||||
(Increase) decrease in other assets | (133 | ) | 212 | ||||
Net cash used in investing activities | (107,204 | ) | (112,223 | ) | |||
Cash flows from financing activities: | |||||||
Proceeds from exercise of stock options | 29,644 | 8,939 | |||||
Excess tax benefits from stock based compensation | 10,149 | 983 | |||||
Payment of dividends | (367,306 | ) | (191,741 | ) | |||
Net cash used in financing activities | (327,513 | ) | (181,819 | ) | |||
Effect of exchange rate changes on cash | 360 | (464 | ) | ||||
Net decrease in cash and cash equivalents | (38,065 | ) | (26,017 | ) | |||
Cash and cash equivalents at beginning of year | 117,676 | 143,693 | |||||
Cash and cash equivalents at end of year | $ | 79,611 | 117,676 | ||||
Supplemental disclosure of cash flow information: | |||||||
Cash paid during each year for income taxes | $ | 268,357 | 205,614 | ||||
CONTACT: Sheryl Lisowski
Controller
507.453.8550
Controller
507.453.8550
19