Attached files
| file | filename |
|---|---|
| 8-K - 8-K INVESTOR PRESENTATION JAN-13 - AGILYSYS INC | form8-kxinvestorpresentati.htm |
TECHNOLOGY | INNOVATION | SOLUTIONS 15th Annual Needham Growth Conference January 17, 2013
TECHNOLOGY | INNOVATION | SOLUTIONS Forward-looking Statements & Non-GAAP Financial Information 2 Forward-Looking Language This Quarterly Report contains certain management expectations, which may constitute forward-looking information within the meaning of Section 27A of the Securities Act of 1933, Section 21E of the Securities and Exchange Act of 1934, and the Private Securities Reform Act of 1995. Forward-looking information speaks only as to the date of this Quarterly Report and may be identified by use of words such as “may,” “will,” “believes,” “anticipates,” “plans,” “expects,” “estimates,” “projects,” “targets,” “forecasts,” “continues,” “seeks,” or the negative of those terms or similar expressions. Many important factors could cause actual results to be materially different from those in forward-looking information, including, without limitation, competitive factors, disruption of supplies, changes in market conditions, pending or future claims or litigation, or technology advances. No assurances can be provided as to the outcome of cost reductions, expected benefits and outcomes from our recent ERP implementation, business strategies, future financial results, unanticipated downturns to our relationships with customers and macroeconomic demand for IT products and services, unanticipated difficulties integrating acquisitions, new laws and government regulations, interest rate changes, consequences related to the concentrated ownership of our outstanding shares by MAK Capital, unanticipated deterioration in economic and financial conditions in the United States and around the world or the consequences associated with the sale of the Company’s TSG business, and uncertainties regarding restructuring actions and the relocation of the Company’s corporate headquarters. The Company does not undertake to update or revise any forward-looking information, even if events make it clear that any projected results, actions, or impact, express or implied, will not be realized. Other potential risks and uncertainties that may cause actual results to be materially different from those in forward-looking information are described in “Risk Factors,” which is included in Part I, Item 1A of the Company’s Annual Report for the fiscal year ended March 31, 2012. Use of Non-GAAP Financial Information To supplement the unaudited condensed consolidated financial statements presented in accordance with U.S. GAAP in this presentation, certain non-GAAP financial measures as defined by the SEC rules are used. Management believes that such information can enhance investors' understanding of the Company's ongoing operations. The non-GAAP measures included in this presentation have been reconciled to the comparable GAAP measures within an accompanying table, shown on the last page of this presentation.
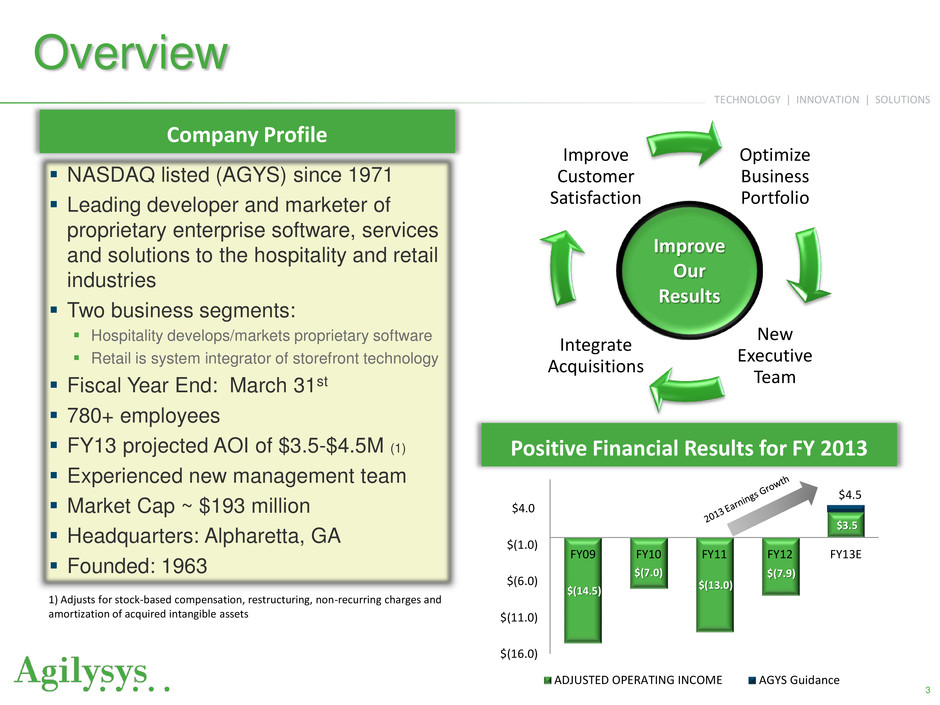
TECHNOLOGY | INNOVATION | SOLUTIONS Overview Company Profile NASDAQ listed (AGYS) since 1971 Leading developer and marketer of proprietary enterprise software, services and solutions to the hospitality and retail industries Two business segments: Hospitality develops/markets proprietary software Retail is system integrator of storefront technology Fiscal Year End: March 31st 780+ employees FY13 projected AOI of $3.5-$4.5M (1) Experienced new management team Market Cap ~ $193 million Headquarters: Alpharetta, GA Founded: 1963 3 Optimize Business Portfolio New Executive Team Integrate Acquisitions Improve Customer Satisfaction Improve Our Results Positive Financial Results for FY 2013 1) Adjusts for stock-based compensation, restructuring, non-recurring charges and amortization of acquired intangible assets $(14.5) $(7.0) $(13.0) $(7.9) $3.5 $4.5 $(16.0) $(11.0) $(6.0) $(1.0) $4.0 FY09 FY10 FY11 FY12 FY13E ADJUSTED OPERATING INCOME AGYS Guidance
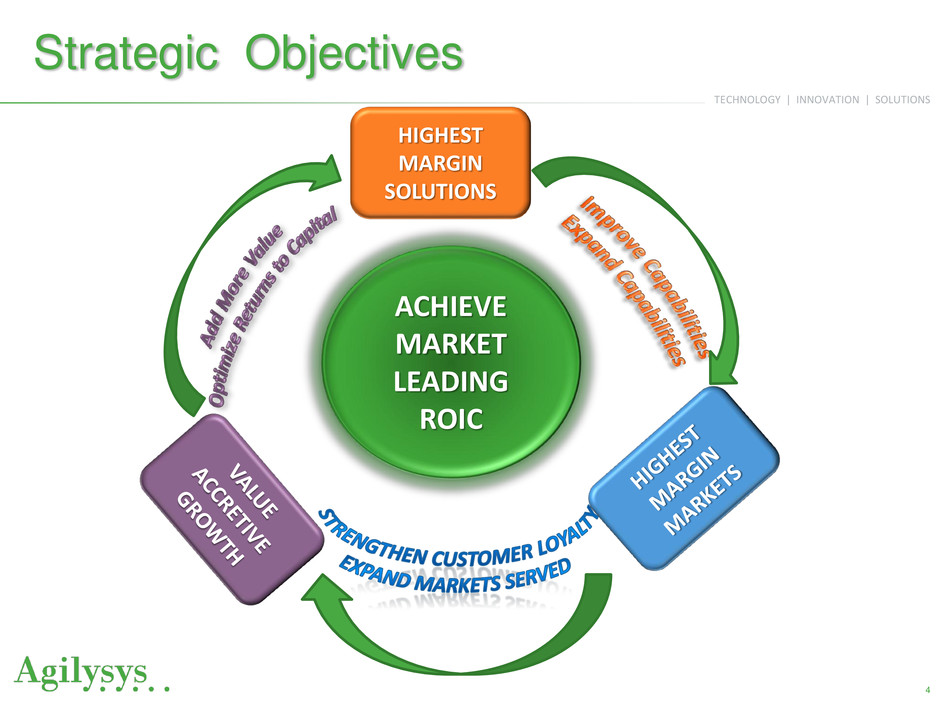
TECHNOLOGY | INNOVATION | SOLUTIONS Strategic Objectives 4 ACHIEVE MARKET LEADING ROIC HIGHEST MARGIN SOLUTIONS
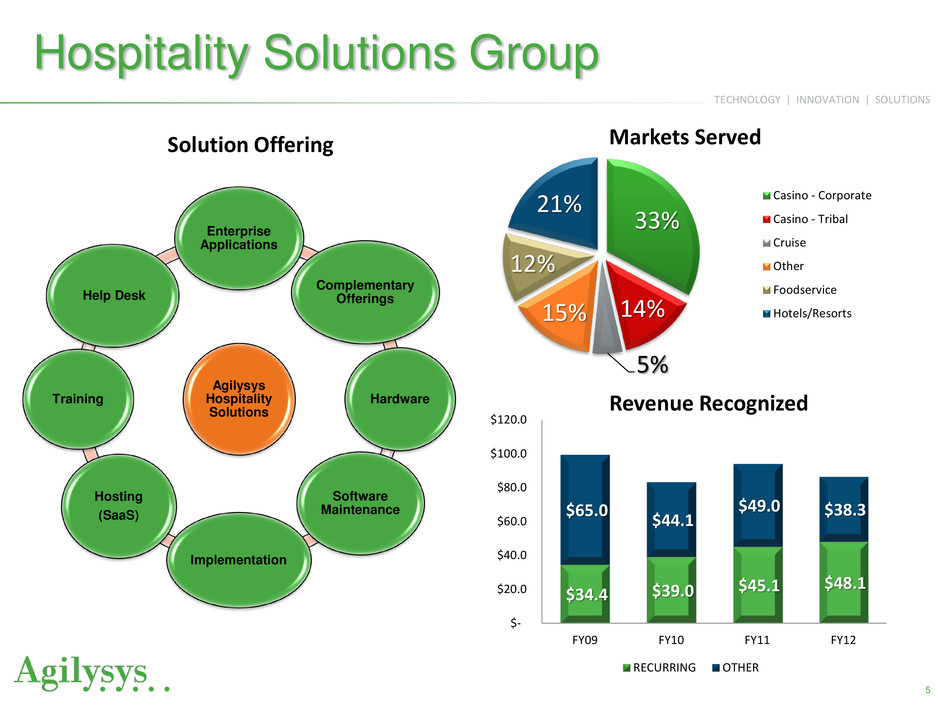
TECHNOLOGY | INNOVATION | SOLUTIONS Hospitality Solutions Group 33% 14% 5% 15% 12% 21% Casino - Corporate Casino - Tribal Cruise Other Foodservice Hotels/Resorts Markets Served 5 Solution Offering Agilysys Hospitality Solutions Enterprise Applications Complementary Offerings Hardware Software Maintenance Implementation Hosting (SaaS) Training Help Desk Revenue Recognized $34.4 $39.0 $45.1 $48.1 $65.0 $44.1 $49.0 $38.3 $- $20.0 $40.0 $60.0 $80.0 $100.0 $120.0 FY09 FY10 FY11 FY12 RECURRING OTHER
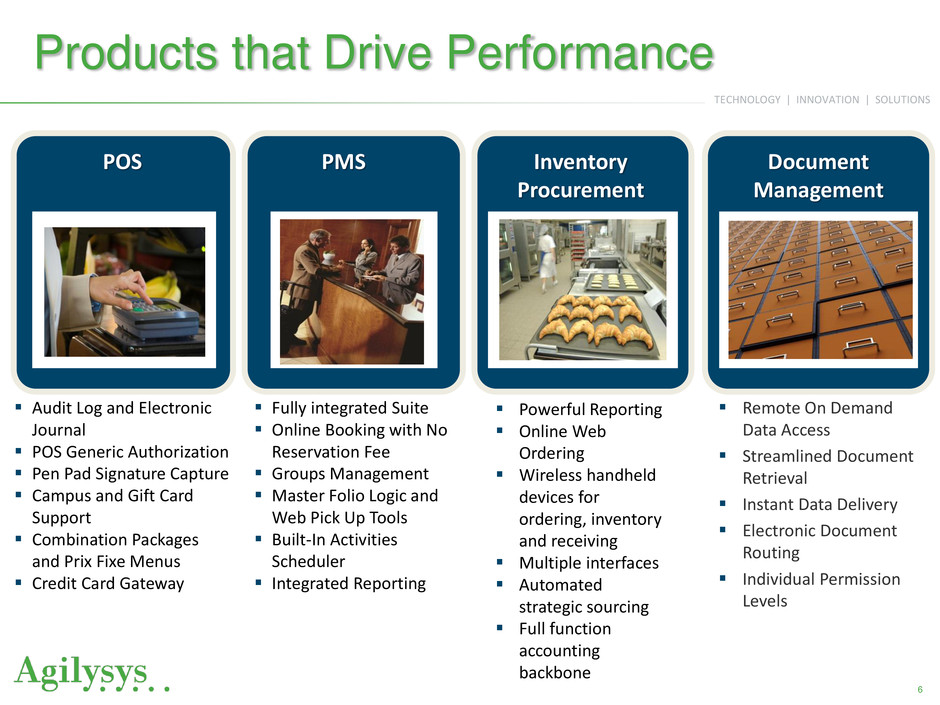
TECHNOLOGY | INNOVATION | SOLUTIONS 6 Products that Drive Performance Powerful Reporting Online Web Ordering Wireless handheld devices for ordering, inventory and receiving Multiple interfaces Automated strategic sourcing Full function accounting backbone Document Management PMS Inventory Procurement Audit Log and Electronic Journal POS Generic Authorization Pen Pad Signature Capture Campus and Gift Card Support Combination Packages and Prix Fixe Menus Credit Card Gateway Remote On Demand Data Access Streamlined Document Retrieval Instant Data Delivery Electronic Document Routing Individual Permission Levels Fully integrated Suite Online Booking with No Reservation Fee Groups Management Master Folio Logic and Web Pick Up Tools Built-In Activities Scheduler Integrated Reporting POS
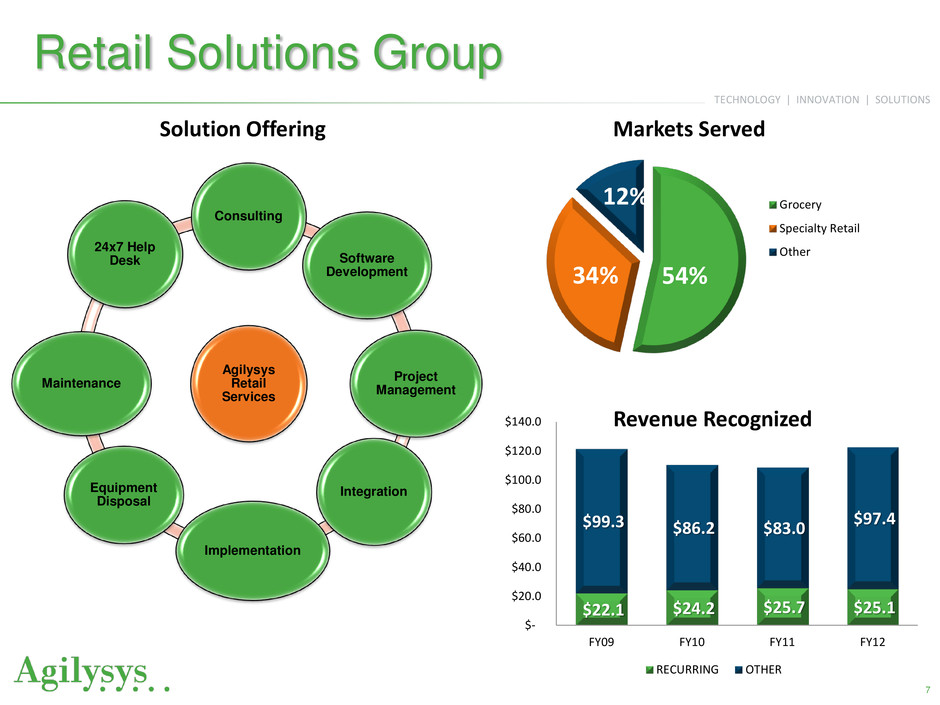
TECHNOLOGY | INNOVATION | SOLUTIONS Retail Solutions Group 7 54% 34% 12% Grocery Specialty Retail Other Markets Served Solution Offering Agilysys Retail Services Consulting Software Development Project Management Integration Implementation Equipment Disposal Maintenance 24x7 Help Desk Revenue Recognized $22.1 $24.2 $25.7 $25.1 $99.3 $86.2 $83.0 $97.4 $- $20.0 $40.0 $60.0 $80.0 $100.0 $120.0 $140.0 FY09 FY10 FY11 FY12 RECURRING OTHER
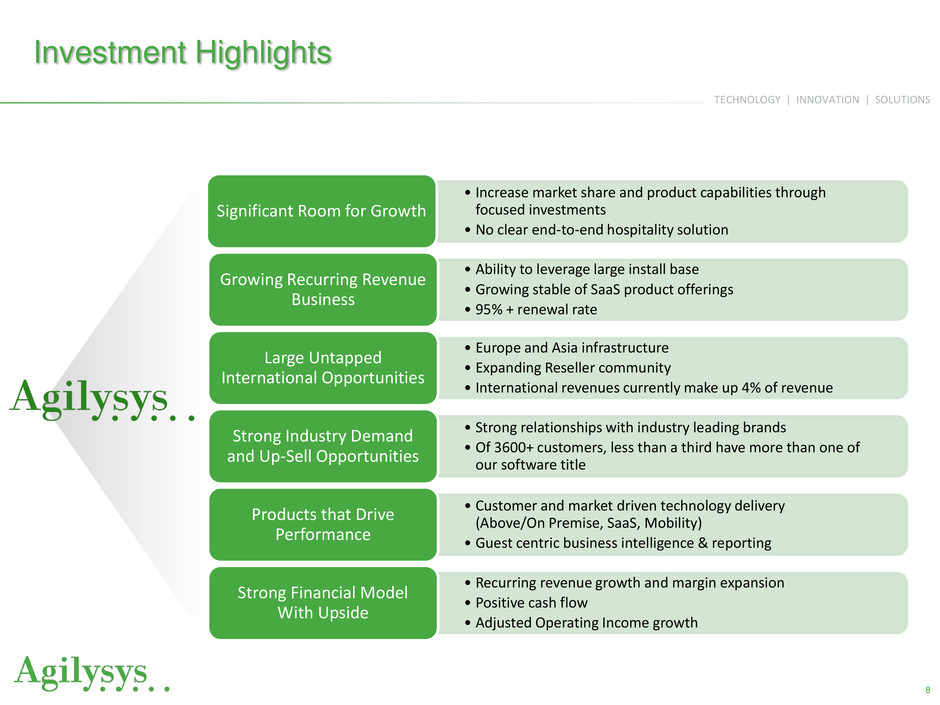
TECHNOLOGY | INNOVATION | SOLUTIONS Investment Highlights • Increase market share and product capabilities through focused investments • No clear end-to-end hospitality solution Significant Room for Growth • Ability to leverage large install base • Growing stable of SaaS product offerings • 95% + renewal rate Growing Recurring Revenue Business • Europe and Asia infrastructure • Expanding Reseller community • International revenues currently make up 4% of revenue Large Untapped International Opportunities • Strong relationships with industry leading brands • Of 3600+ customers, less than a third have more than one of our software title Strong Industry Demand and Up-Sell Opportunities • Customer and market driven technology delivery (Above/On Premise, SaaS, Mobility) • Guest centric business intelligence & reporting Products that Drive Performance • Recurring revenue growth and margin expansion • Positive cash flow • Adjusted Operating Income growth Strong Financial Model With Upside 8
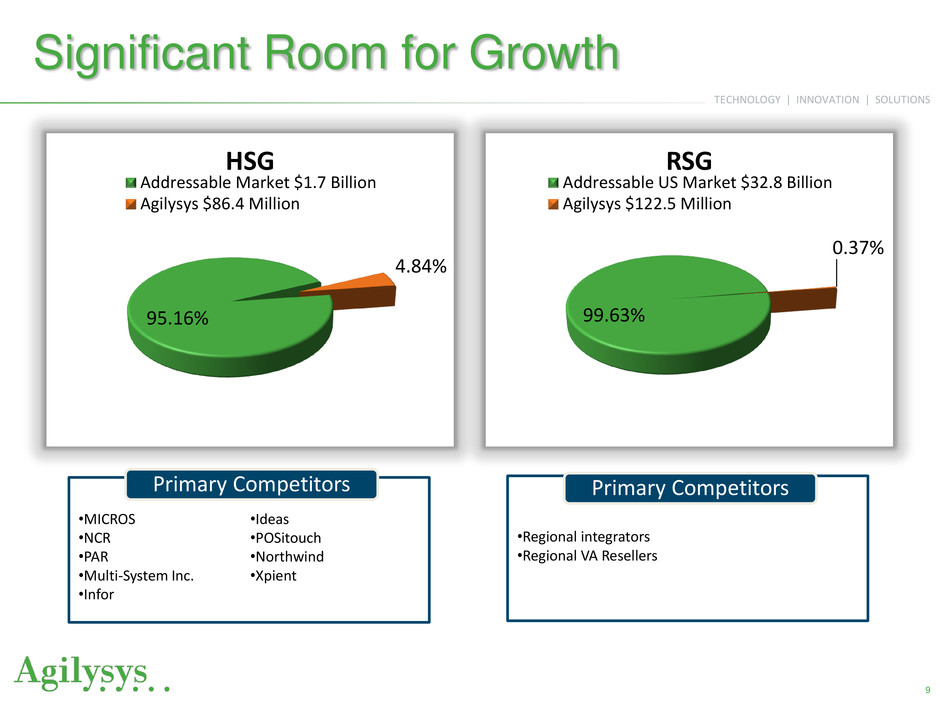
TECHNOLOGY | INNOVATION | SOLUTIONS Significant Room for Growth 99.63% 0.37% RSG Addressable US Market $32.8 Billion Agilysys $122.5 Million 9 Primary Competitors •Regional integrators •Regional VA Resellers Primary Competitors •MICROS •NCR •PAR •Multi-System Inc. •Infor •Ideas •POSitouch •Northwind •Xpient 95.16% 4.84% HSG Addressable Market $1.7 Billion Agilysys $86.4 Million
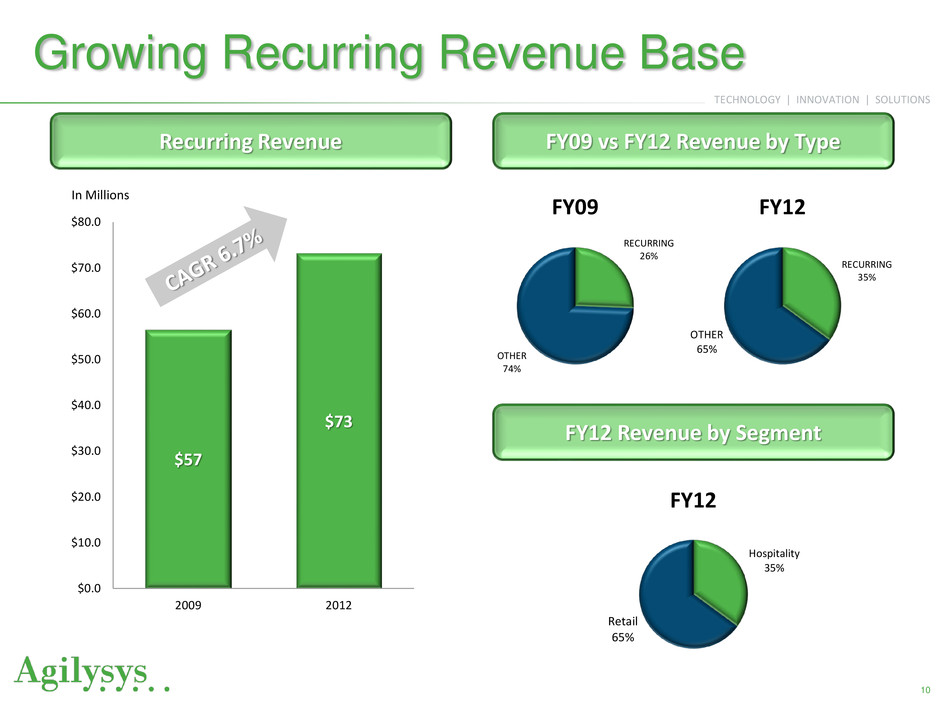
TECHNOLOGY | INNOVATION | SOLUTIONS Growing Recurring Revenue Base 10 RECURRING 26% OTHER 74% FY09 Recurring Revenue FY09 vs FY12 Revenue by Type FY12 Revenue by Segment Hospitality 35% Retail 65% FY12 RECURRING 35% OTHER 65% FY12 $57 $73 $0.0 $10.0 $20.0 $30.0 $40.0 $50.0 $60.0 $70.0 $80.0 2009 2012 In Millions
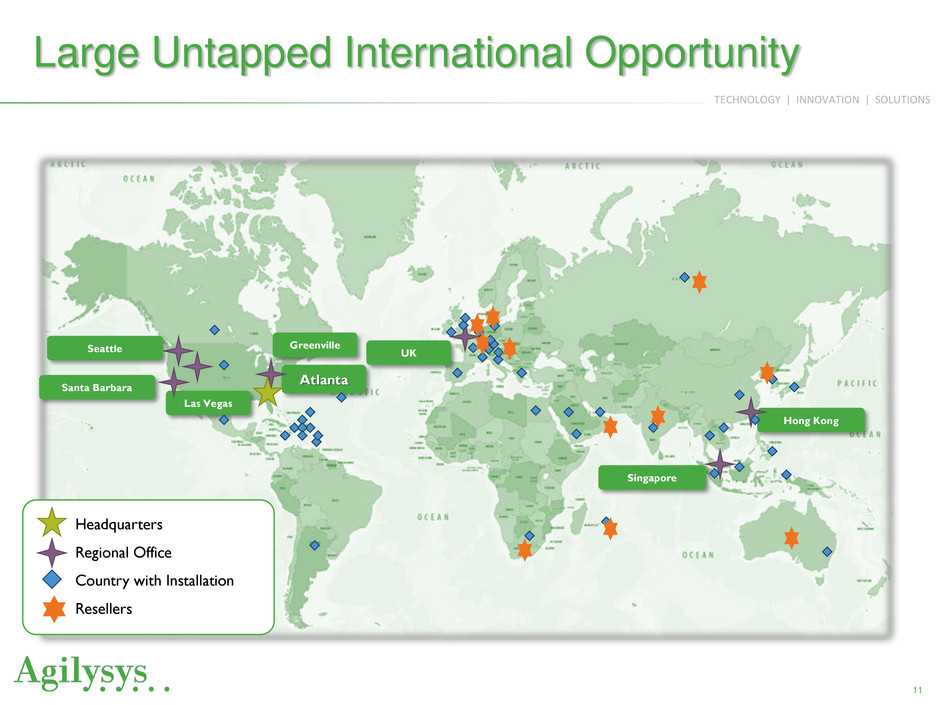
TECHNOLOGY | INNOVATION | SOLUTIONS Large Untapped International Opportunity Headquarters Regional Office Country with Installation Resellers Atlanta Las Vegas Singapore Santa Barbara UK Greenville Hong Kong Seattle 11
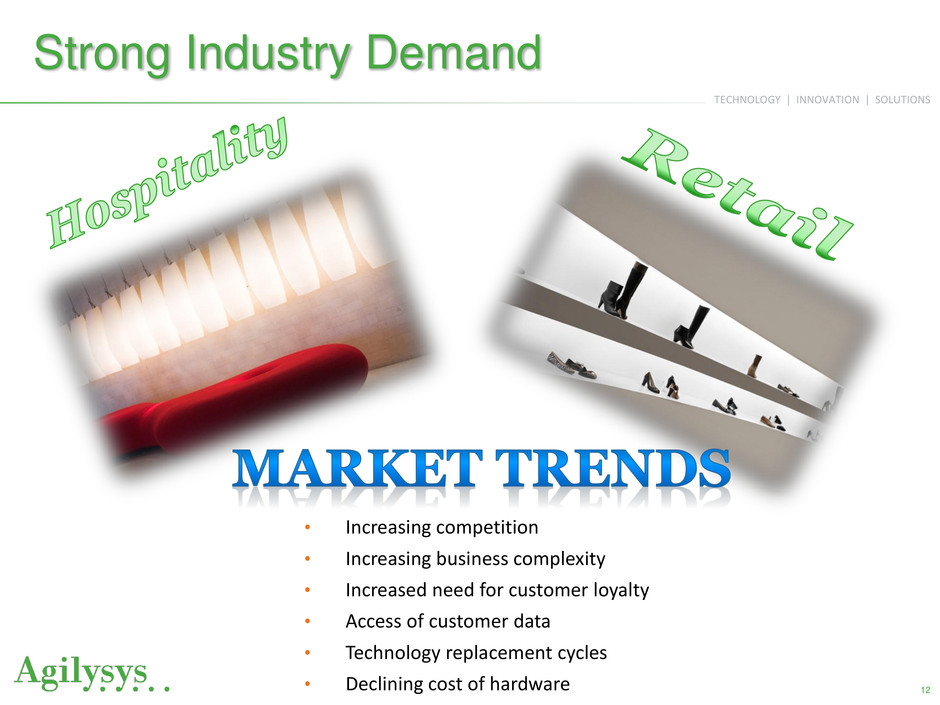
TECHNOLOGY | INNOVATION | SOLUTIONS 12 Strong Industry Demand • Increasing competition • Increasing business complexity • Increased need for customer loyalty • Access of customer data • Technology replacement cycles • Declining cost of hardware
TECHNOLOGY | INNOVATION | SOLUTIONS Diversified Customer Base with Significant Upsell Opportunity • Strong brand relationships • Long standing customer relationships within casino, resort, foodservice and cruise segments • 3500+ customers with 95%+ renewal rate 13 HSG RSG • Diversified customer base comprised of grocery, chain drug, general retail and franchise specialty retail segments. • Leader in mobile retail applications and infrastructure since 1999 • Leading retail technology integration
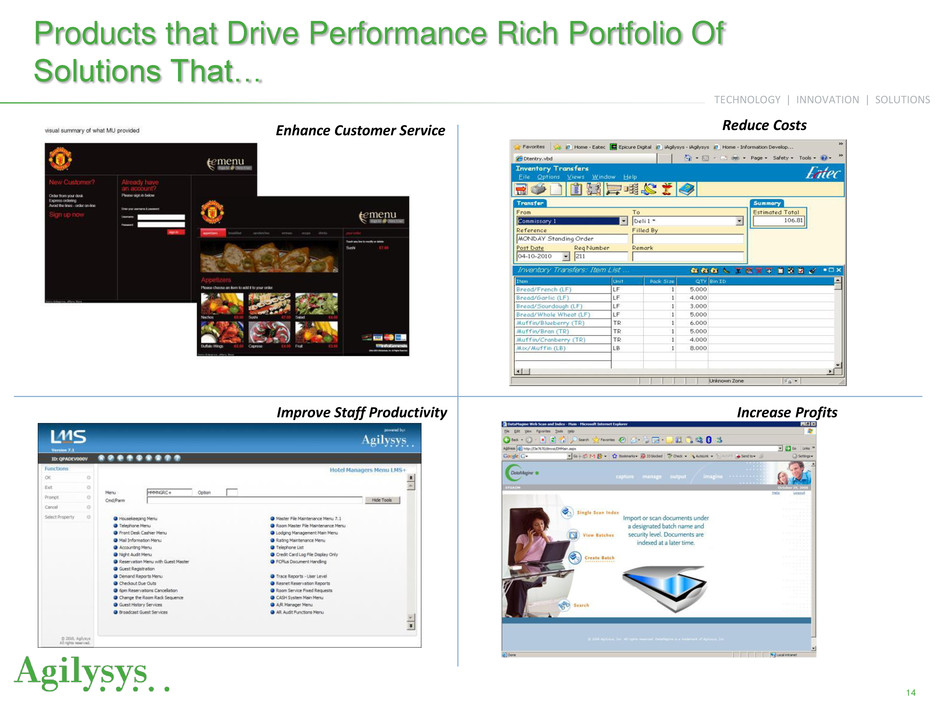
TECHNOLOGY | INNOVATION | SOLUTIONS Products that Drive Performance Rich Portfolio Of Solutions That… 14 Enhance Customer Service Reduce Costs Increase Profits Improve Staff Productivity
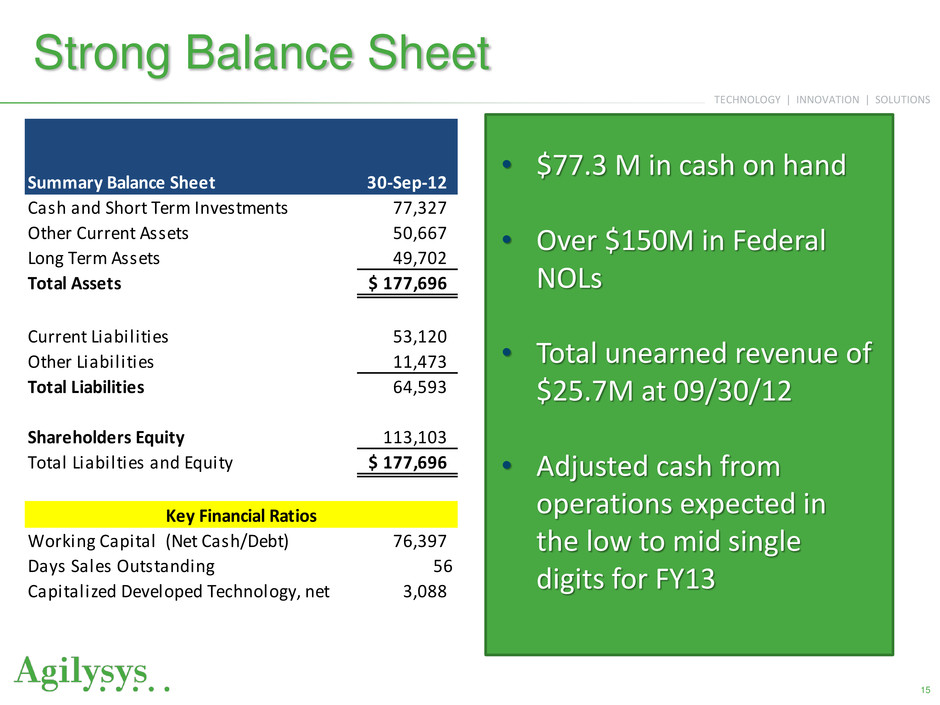
TECHNOLOGY | INNOVATION | SOLUTIONS • $77.3 M in cash on hand • Over $150M in Federal NOLs • Total unearned revenue of $25.7M at 09/30/12 • Adjusted cash from operations expected in the low to mid single digits for FY13 Strong Balance Sheet 15 Summary Balance Sheet 30-Sep-12 Cash and Short Term Investments 77,327 Other Current Assets 50,667 Long Term Assets 49,702 Total Assets 177,696$ Current Liabilities 53,120 Other Liabilities 11,473 Total Liabilities 64,593 Shareholders Equity 113,103 Total Liabilties and Equity 177,696$ Working Capital (Net Cash/Debt) 76,397 Days Sales Outstanding 56 Capitalized Developed Technology, net 3,088 Key Financial Ratios
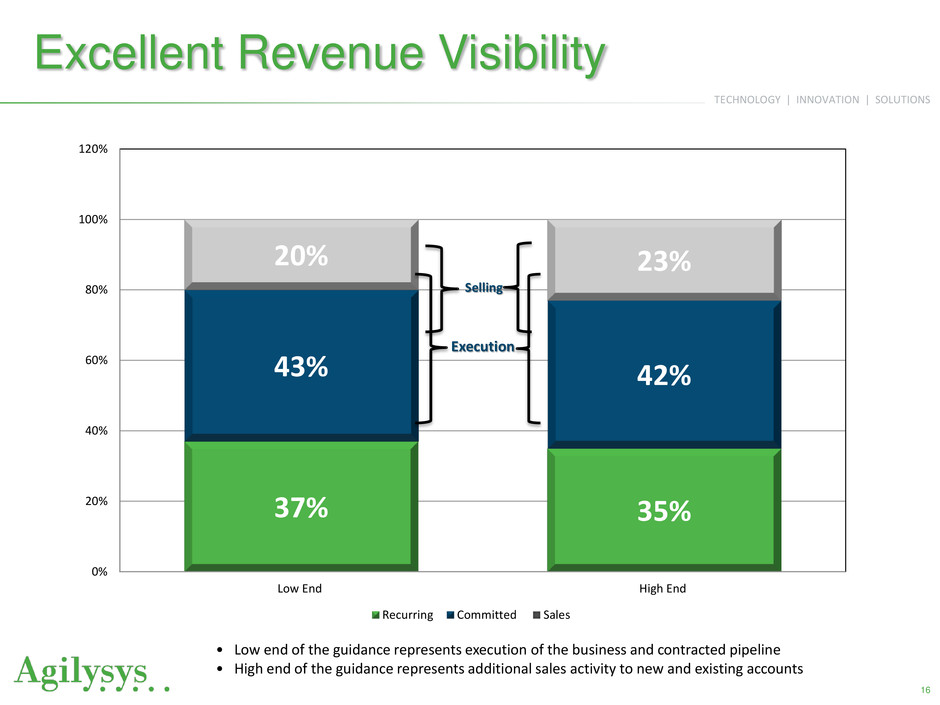
TECHNOLOGY | INNOVATION | SOLUTIONS Excellent Revenue Visibility 16 37% 35% 43% 42% 20% 23% 0% 20% 40% 60% 80% 100% 120% Low End High End Recurring Committed Sales Selling Execution • Low end of the guidance represents execution of the business and contracted pipeline • High end of the guidance represents additional sales activity to new and existing accounts
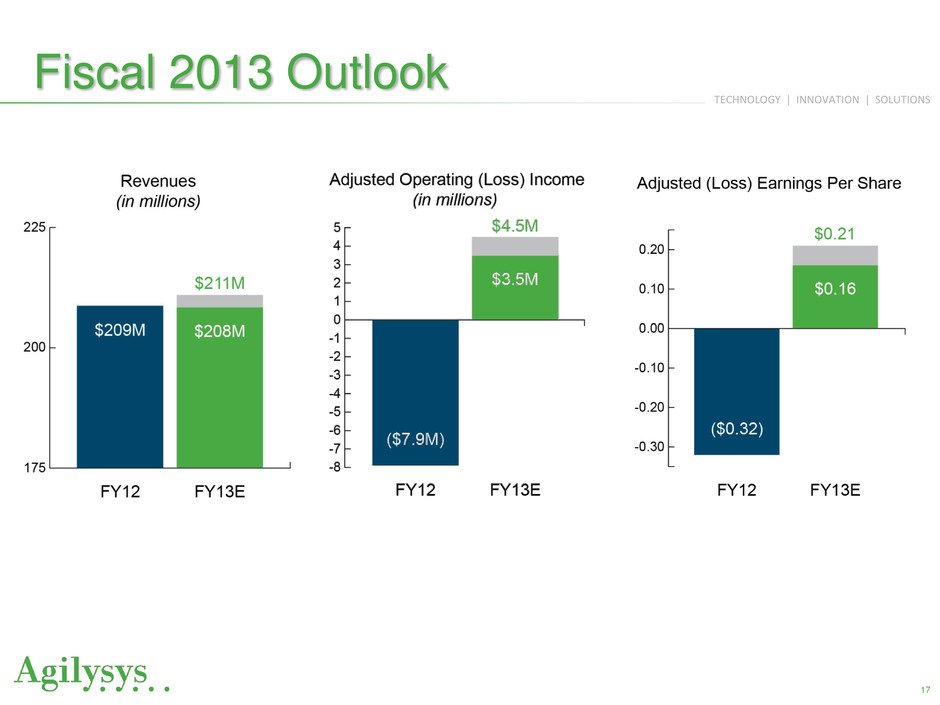
TECHNOLOGY | INNOVATION | SOLUTIONS 17 Fiscal 2013 Outlook
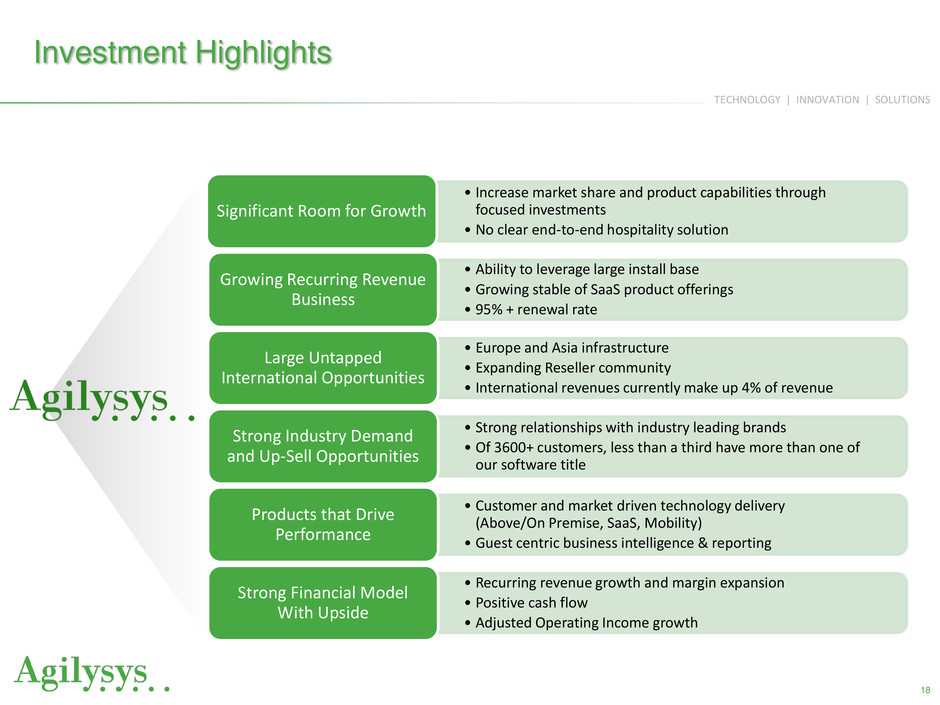
TECHNOLOGY | INNOVATION | SOLUTIONS Investment Highlights • Increase market share and product capabilities through focused investments • No clear end-to-end hospitality solution Significant Room for Growth • Ability to leverage large install base • Growing stable of SaaS product offerings • 95% + renewal rate Growing Recurring Revenue Business • Europe and Asia infrastructure • Expanding Reseller community • International revenues currently make up 4% of revenue Large Untapped International Opportunities • Strong relationships with industry leading brands • Of 3600+ customers, less than a third have more than one of our software title Strong Industry Demand and Up-Sell Opportunities • Customer and market driven technology delivery (Above/On Premise, SaaS, Mobility) • Guest centric business intelligence & reporting Products that Drive Performance • Recurring revenue growth and margin expansion • Positive cash flow • Adjusted Operating Income growth Strong Financial Model With Upside 18
