Attached files
| file | filename |
|---|---|
| 8-K - 8-K - rue21, inc. | d467910d8k.htm |
 Exhibit 99.1 |
 Certain
statements in this presentation and responses to various questions may be
“forward-looking statements” which reflect the company’s
current expectations or beliefs concerning future events. Actual results of
operations may differ materially from historical results or current expectations.
Any such forward-looking statements are subject to various risks and
uncertainties, including the strength of the economy, changes in the overall level
of consumer spending or preferences in apparel, our ability to
compete with other retailers, the performance of the company’s
products within the prevailing retail environment, our strategy and
expansion plans, reliance on key personnel, trade restrictions,
political or financial instability in countries where the company’s
goods are manufactured, availability of suitable store locations at
appropriate terms and other factors which are set forth in the
company’s SEC filings, which are available on our website. Safe Harbor Statement
|
 3
Holiday 2012 Update
Holiday 2012 Update |
 •
877 stores in strips, outlets and
malls in 47 states
•
Small and mid-size markets
•
Mix of girls and guys apparel
and accessories
•
Fast sourcing model
•
Experienced management
•
Highly developed infrastructure
= Consistent Growth
4
WHO IS rue21 |
 Progress
Report Merchandise:
Real Estate:
Systems & Infrastructure:
Consistency:
November 13, 2012 was rue21’s
3 year IPO Anniversary
5
Grown more diversified across all categories
350 stores opened in the last 3 years, with 2012 stores best
performers to date
DC space doubled, HQ space tripled, new allocation system
implemented, new planning system to go live Q1 2013, eComm platform
established Double digit sales and profit increases every year
Never missed a quarterly earnings guidance estimate
Never missed a quarterly earnings guidance estimate |
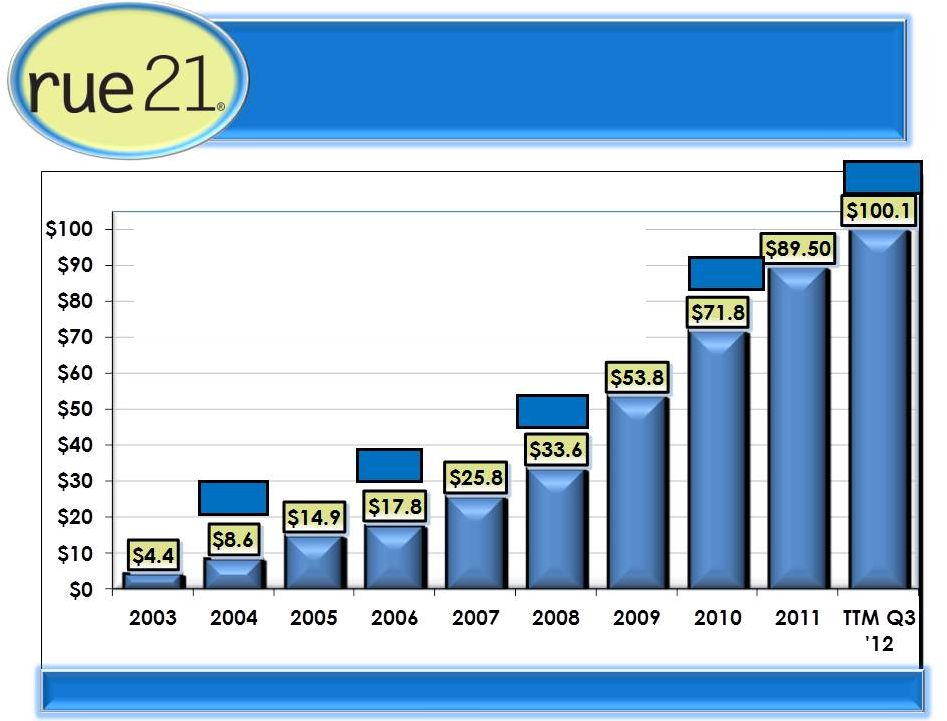
 Consistent Sales Growth
Compound Sales Growth of 26% over 8 yrs.
$ in Millions
6
$ in Millions |
 Proven
Earnings Growth & Margin Expansion
11.7%
11.3%
8.6%
7.9%
5.9%
Compound EBITDA Growth
Compound EBITDA Growth
of 46% over 8 yrs.
of 46% over 8 yrs.
$ in Millions
$ in Millions
Note: TTM Q-3 ‘12 Adjusted for CA wage & hour class action
7 |
 •
Flexibility in Real Estate Options
•
Flexibility in Merchandise Assortment
•
Consistent New Store Productivity
•
Consistent Positive Comp Store Sales
•
Consistent Investments in Growth: Systems and Infrastructure
2013 Projection: $1 BILLION IN SALES AND APPROXIMATELY 1000 STORES
The Secret Sauce:
Consistency and Flexibility
8 |
 9
MULTIPLE
GROWTH
DRIVERS |
 2012
New Stores Generating Record Results
10
New stores sales per square foot up 9%
New stores 4-wall per square foot up 15%
ROI rates up 10 bps on similar build out costs
Note: Comparison to 2011 fleet of new stores |
 Growth
Potential by U.S. Shopping Center Type 11
Ability to
DOUBLE
our Growth!
18%
Current
Stores
Identified
Locations
Share
Strip Centers
451
2,500
18%
Regional Malls
313
1,100
28%
Outlet Centers
113
175
65%
Total
877
3,775
23%
2008
2012
0
300
600
900
1,200
1,500
449
877
1,700
Predictable Growth –
Real Estate
2018E+ |
 12
FARMINGTON, MO
#3 VOLUME STORE in NOV/DEC
#3 VOLUME STORE in NOV/DEC |
 13
HAZARD, KENTUCKY |
 14
BISMARCK, ND |
 SIOUX
FALLS, SD |
 PREDICTABLE GROWTH --
MERCHANDISE
Color, Color, Color
Dominating the Sector in Dresses
Strengthening of Fashion Knits and Woven Tops
Denim at Better Price Points
Sandals and Casual Footwear
Guys Key Item Knits Including Tanks
16
ABILITY TO CAPITALIZE ON TRENDS: |
 17
COLOR, COLOR, COLOR |
 18
etc!
Division Improvement |
 eComm
Opportunity Update 19
Go
LIVE
on target for early 2014
eComm leader onboard; dedicated internal
resources in place
Growing online presence and viral marketing
initiatives
2
million
emails collected
4 million
predicted to be captured by go-live
•
•
•
• |
 Status
Commentary
Headquarters
Systems
Software –
latest releases, ERP, financial, real estate,
HRIS with state of the art hardware
Planning and Allocation Systems
Headquarters expanded to 84,000 sq ft to support 25%
future associate growth
Team
Focus on recruiting and talent management
Expanded field management organization & focus
Distribution Center
DC square footage doubled to support up to 1,600
stores
eCommerce
Leadership retained and eComm strategy being
developed
Vendor selection process initiated with “go-live”
set
for 2014
20
Investments Made to
Support Our Growth |
 Identify and capture operations efficiencies and
Increase Comp Sales in 2013
–
Add technology tools/mobile scanners
–
Redesign business processes
–
Improve workforce management
–
Simplify visual merchandising tasks
Project Simplification
21 |
 Consistent Long-Term Comp
Sales Gains
$100 Valued by Successive Comp Store % Performance
$ in Millions
22 |
  Predictable
Net Income Results First
Second
Third
Fourth
First
Second
Third
Fourth
Quarter
Quarter
Quarter
Quarter
Quarter
Quarter
Quarter
Quarter
Net Sales Growth
40.1%
42.0%
27.9%
20.9%
20.4%
26.9%
33.6%
43.6%
Net Income Growth
249.7%
59.0%
50.9%
22.5%
56.3%
31.2%
55.8%
33.1%
Comp Store Sales
12.7%
8.9%
9.8%
1.8%
-5.2%
0.7%
6.6%
11.2%
First
Second
Third
Fourth
First
Second
Third
Fourth
Quarter
Quarter
Quarter
Quarter
Quarter
Quarter
Quarter
Quarter
Net Sales Growth
40.7%
27.6%
40.7%
30.5%
27.6%
14.3%
19.5%
22.3%
Net Income Growth
257.5%
23.5%
106.9%
67.9%
94.7%
20.0%
19.5%
41.0%
Comp Store Sales
8.3%
0.6%
13.5%
8.6%
7.7%
-1.6%
1.8%
1.5%
First
Second
Third
Fourth
First
Second
Third
Quarter
Quarter
Quarter
Quarter
Quarter
Quarter
Quarter
Net Sales Growth
25.5%
21.0%
18.8%
15.7%
18.9%
17.0%
15.6%
Net Income Growth
65.2%
20.0%
22.4%
18.7%
20.6%
18.5%
14.5%
Comp Store Sales
5.2%
-0.3%
0.0%
-2.2%
1.7%
0.5%
0.2%
Fiscal 2009
Fiscal 2010
Fiscal 2011 Fiscal 2012
Fiscal 2007 Fiscal 2008
Ability
to
Expand
Net
Income
by
Double
Digits
in
Low
Comp
Growth
Quarters
23
Note: Q-3 ‘12 Adjusted for CA wage & hour class action
|
 Gross
Margin Long-Term Gains
Year Over Year Margin Change
24
-2.0%
-1.5%
-1.0%
-0.5%
0.0%
0.5%
1.0%
1.5%
2.0%
FY08
FY09
FY10
FY11
Q3 FY12 YTD
peers
rue21 |
 Gross
Margin History 25
34.1%
35.8%
37.0%
37.7%
38.1%
31.0%
32.0%
33.0%
34.0%
35.0%
36.0%
37.0%
38.0%
39.0%
$0
$50
$100
$150
$200
$250
$300
$350
FY08
FY09
FY10
FY11
TTM Q3 2012
Gross Profit $
GM% |
 Years
Ended Jan
2011
Jan
2012
TTM
Q-3
Long Term
GOAL
Gross Margin
37.0%
37.7%
38.1%
38.5 -
39.0%
Selling, General and Administrative
*25.7%
*25.9%
*26.3%
25.0 -
25.5%
Depreciation and Amortization
3.4%
3.5%
3.7%
3.0%
Operating Income Margin
7.9%
8.3%
8.1%
10.5%
Pre-Tax Income Margin
7.8%
8.3%
8.1%
10.5 -
11.0%
Net Income
4.8%
5.1%
5.1%
6.0 -
7.0%
*Stock Comp Margin
.4%
.7%
1.1%
Margin Expansion Opportunity
Note: TTM Q-3 Adjusted for CA wage & hour class action
26 |
 METRIC
LONG-TERM TARGET
LONG-TERM TARGET
SQUARE FOOTAGE CAGR
square footage growth =
“mid teens”
COMPARABLE STORE
SALES GROWTH
LOW SINGLE DIGITS
GROSS MARGIN
150 BPS IMPROVEMENT
NET INCOME CAGR
17% -
20%
Long-Term Financial Targets
27 |
 |