Attached files
| file | filename |
|---|---|
| 8-K - FORM 8-K - NOVANTA INC | d467865d8k.htm |
 Investor Presentation
January 2013
January 2013
Exhibit 99.1 |
 Factors affecting future performance…
…and use of Non-GAAP financial measures
…and use of Non-GAAP financial measures
Forward-Looking Statements
Non-GAAP Measurement
Discontinued Operations
The statements in this presentation that relate to guidance, pro forma presentations, future plans,
goals, business opportunities, events or performance are forward-looking statements that
involve risks and uncertainties, including risks associated with business and economic
conditions, failure to achieve expected benefits of the NDS acquisition, failure to comply with
Food and Drug Administration regulations, customer and/or supplier contract cancellations, manufacturing
risks, competitive factors, ability to successfully introduce new products, uncertainties pertaining to
customer orders, demand for products and services, growth and development of markets for the
Company's products and services, and other risks identified in our filings made with the
Securities and Exchange Commission, including, most recently, our Form 10-K for the year
ended December 31, 2011. Actual results, events and performance may differ materially. Readers are
cautioned not to place undue reliance on these forward-looking statements, which speak only as of
the date of this presentation. The Company disclaims any obligation to update these
forward-looking statements as a result of developments occurring after the date of this
presentation. Readers are encouraged to refer to the risk disclosures described in the
Company’s Form 10-K for the year ended December 31, 2011 and subsequent filings with the SEC, as
applicable. Please see “Safe Harbor and Forward-Looking Information” in the Appendix
to this presentation for more information.
The Company’s statements regarding its adjusted EBITDA and net debt are non-GAAP financial
measures. Please see “Use of Non-GAAP Financial Measures” and the subsequent slides
in the Appendix to this presentation for the reasons we use these measures, a reconciliation of
these measures to the most directly comparable GAAP measures and other information relating to
these measures. The Company neither updates nor confirms any guidance regarding the future operating results of the
Company which may have been given prior to this presentation.
In June 2012, the Company committed to a plan for the sale of its Semiconductor Systems and Laser
Systems businesses. As a result, the Company began accounting for these businesses as
discontinued operations beginning in the second quarter of 2012. Unless otherwise noted, all
financial results in this presentation are GAAP measures for continuing operations. |
 We
are a leading supplier… …of precision motion and laser
technology Expertise to Drive Results
Capabilities to Innovate & Grow
Positioned in Growth Segments
Global Presence and Reach
•
Leading provider of precision laser, optical and motion control technology
•
Founded
in
1968,
headquartered
in
Bedford,
MA
-
major
presence
in
North
America,
Europe, and Asia-Pacific
•
$271M in revenue and $43M in Adjusted EBITDA (LTM ending 9/30/12)
•
Approximately 1,200 employees for continuing operations
•
Trade on NASDAQ (GSIG)
Leading Technology Franchises |
 Our
aspirations… Focus growth efforts on building out
key
platforms
(organic
and
M&A
Improve mix (growth, volatility) –
more
Medical,
less
Semiconductor
Simplify footprint and infrastructure
Organic growth mid to high
single digits
>20% Adj. EBITDA margins
Long term shareholder returns
above peer average
A leading provider of precision photonic and
motion technologies for OEM’s in demanding
markets –
delivering attractive shareholder
returns through sustained profitable growth
Strategic Priorities
Performance Goals
Strategic Vision
)
…are
clear
and
achievable |
 At
year end… …we were midstream in our transformation
Revenue
Revenue
Growth
Growth
Potential
Potential
Adj. EBITDA**
Adj. EBITDA**
Value Chain
Value Chain
Focus
Focus
Structure
Structure
Mix
Mix
Growth
Growth
Strategy
Strategy
Performance
Performance
Focus
Focus
* pro forma Excel Technologies + GSI Group Inc results as reported in GSI Group Inc.
8K filed on 07/18/08 ** adjusted EBITDA, non-GAAP financial metric
***Continuing Operations 3Q 2012 LTM
~$480M*
Low single digit
~$70M
33% systems
67% OEM
<20 distinct P&L’s
>30 sites
>50% Semi
<10% Medical
Unrelated
acquisitions
Maximize margins
Pre
Pre
2008
2008
~$271M
Mid single digit
~$43M
~95% OEM
2 focused groups
<15 sites
~20% Semi
~20% Medical
Build out growth
platforms via focused
R&D and bolt-on M&A
Profit growth
Current
Current
***
***
$500M+
High single digit
$100M+
~100% OEM
2 focused groups
<10 sites
<15% Semi
~40% Medical
Current approach
plus selective
transformative M&A
Sustained profitable
revenue growth
Vision
Vision |
 We
have positioned the business… …for success in 2013
Key
Accomplishments
2012
•
•
12 X 12 program substantially complete (India JV Pending)
12 X 12 program substantially complete (India JV Pending)
•
•
Laser
Laser
Systems
Systems
divested
divested
–
–
Semiconductor
Semiconductor
Systems
Systems
in
in
process
process
•
•
H2 2012 Restructuring Plan complete
H2 2012 Restructuring Plan complete
•
•
Growth Platforms delivered +$8M of incremental growth
Growth Platforms delivered +$8M of incremental growth
•
•
Significant talent upgrades across organization
Significant talent upgrades across organization
•
•
SOX compliant financial controls in place
SOX compliant financial controls in place
•
•
Balance
Balance
sheet
sheet
strengthened
strengthened
-
-
new
new
credit
credit
agreement
agreement
in
in
place
place
•
•
Strong progress on M&A pipeline
Strong progress on M&A pipeline
Closed Monday on Acquisition of
NDS Surgical Imaging for $82.5M |
 We
now have a strong foundation… …to achieve our strategic goals
NDS Surgical Imaging
NDS Surgical Imaging
“A catalyst for realignment of our portfolio and a platform for
“A catalyst for realignment of our portfolio and a platform for
continued growth in the medical market.”
continued growth in the medical market.”
“Highly engineered photonic components, sold exclusively to the
“Highly engineered photonic components, sold exclusively to the
medical market, with high barriers to entry.”
medical market, with high barriers to entry.”
“A more predictable and sustainable revenue and profit stream.”
“A more predictable and sustainable revenue and profit stream.”
|
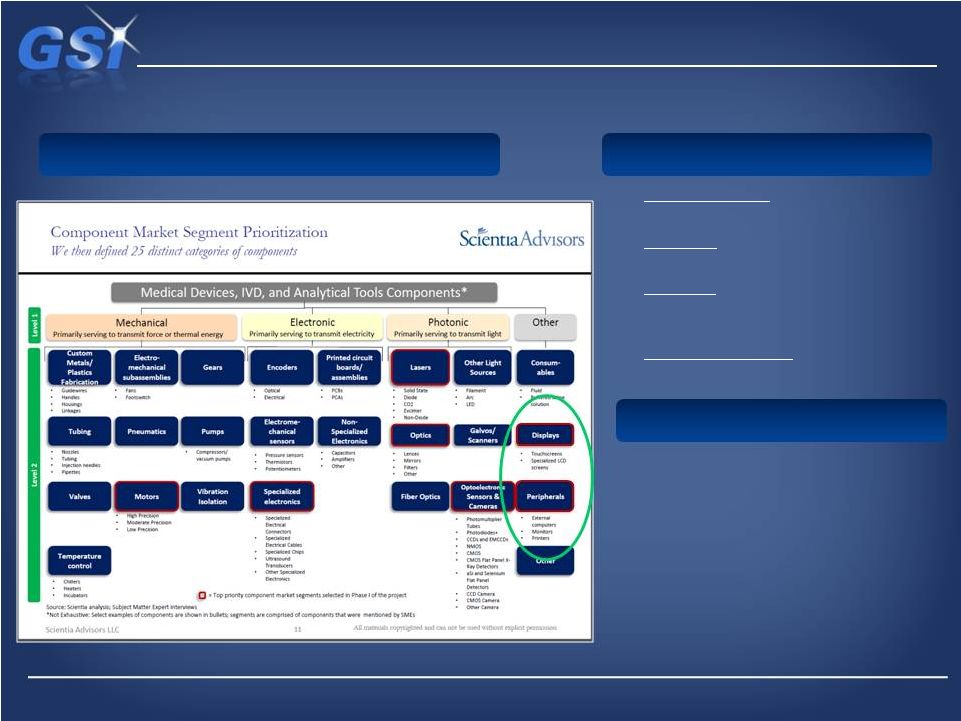 We
sought additional capabilities… We sought additional
capabilities… …to expand our medical market position
…to expand our medical market position
GSI Medical Strategy
GSI Medical Strategy
•
•
Gain overall scale & growth foundation
Gain overall scale & growth foundation
•
•
Obtain foundation for further growth
Obtain foundation for further growth
•
•
Leverage OEM sales channels
Leverage OEM sales channels
•
•
Play in highly differentiated segments
Play in highly differentiated segments
•
•
Strong bias for photonics
Strong bias for photonics
•
•
Seek leading market positions
Seek leading market positions
•
•
Focus on surgical & critical care
Focus on surgical & critical care
•
•
Leverage strength in peripherals
Leverage strength in peripherals
•
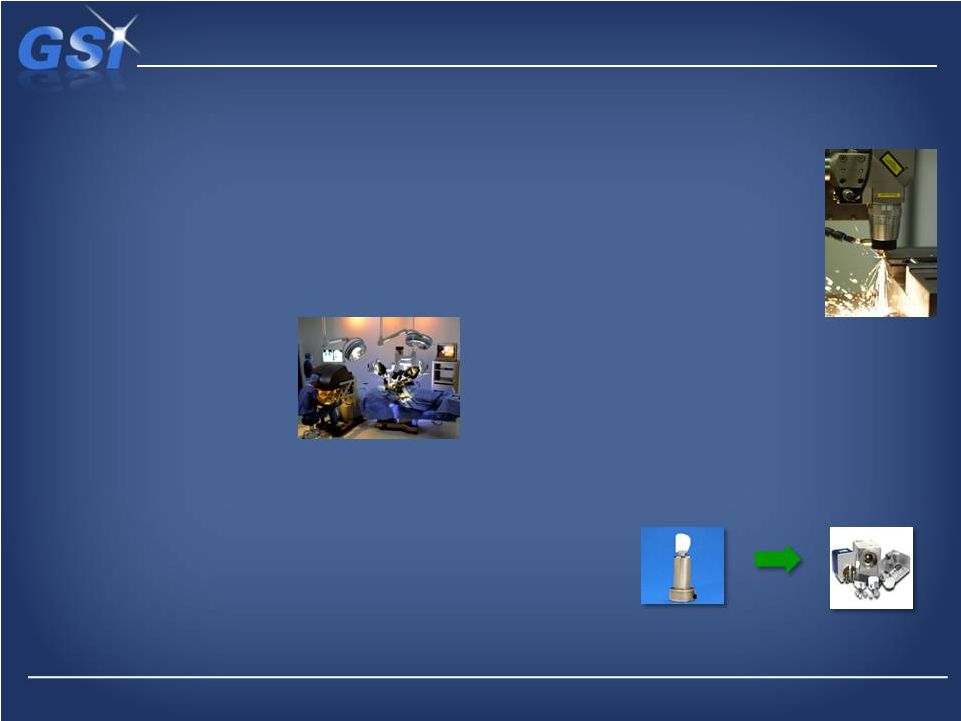
Thermal Printers: Patient
Monitoring, EKG, Pacemakers
•
Encoders: Robotic Surgery, DNA
sequencing
•
Scanners: OCT Retinal Scanning,
Laser Surgery, Drug Discovery
Analysis
•
Color Measurement: Robotic
Surgery, Displays
Strategic Goals
Medical Applications
Medical Market Study |
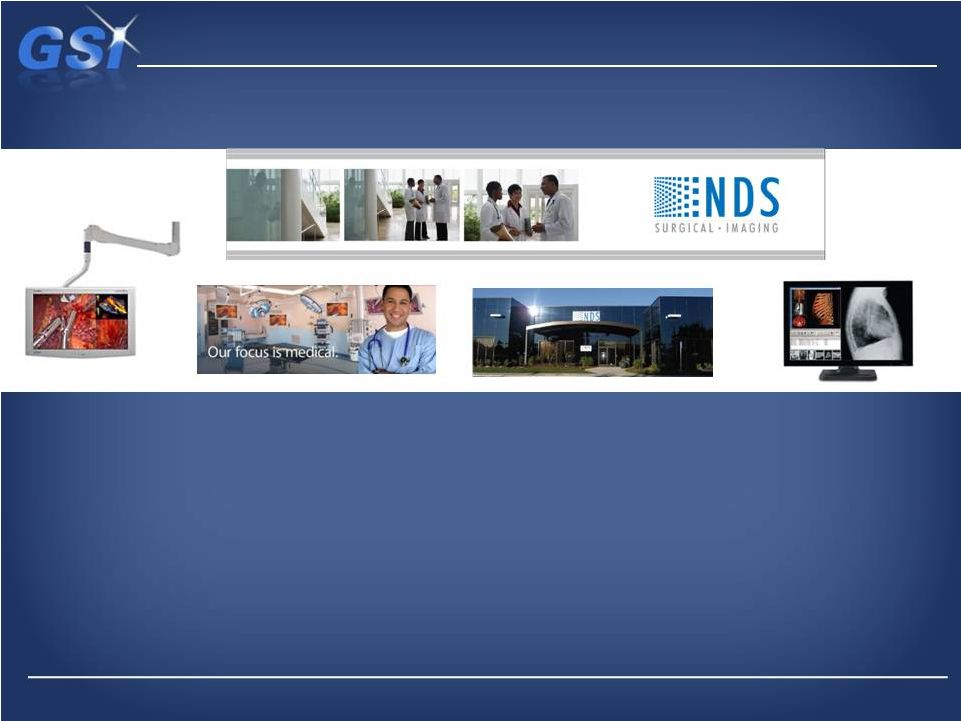 NDS
is the global leader… …in surgical visualization
NDS Profile
NDS Profile
•
Leading global player in surgical & radiology displays and related
accessories •
#1 market position in surgical, #2 in radiology
•
Based in San Jose, CA –
180 employees -
privately owned (Riverside Capital)
•
Revenue +$80M, Adjusted EBITDA margins in mid teens
•
Products sold to OEM’s for integration into surgical endoscopic systems
•
Class I and Class II medical devices (FDA controlled), extremely
high performance
•
Highly
proprietary
color
correction
algorithms
-
custom
matched
to
OEM
designs |
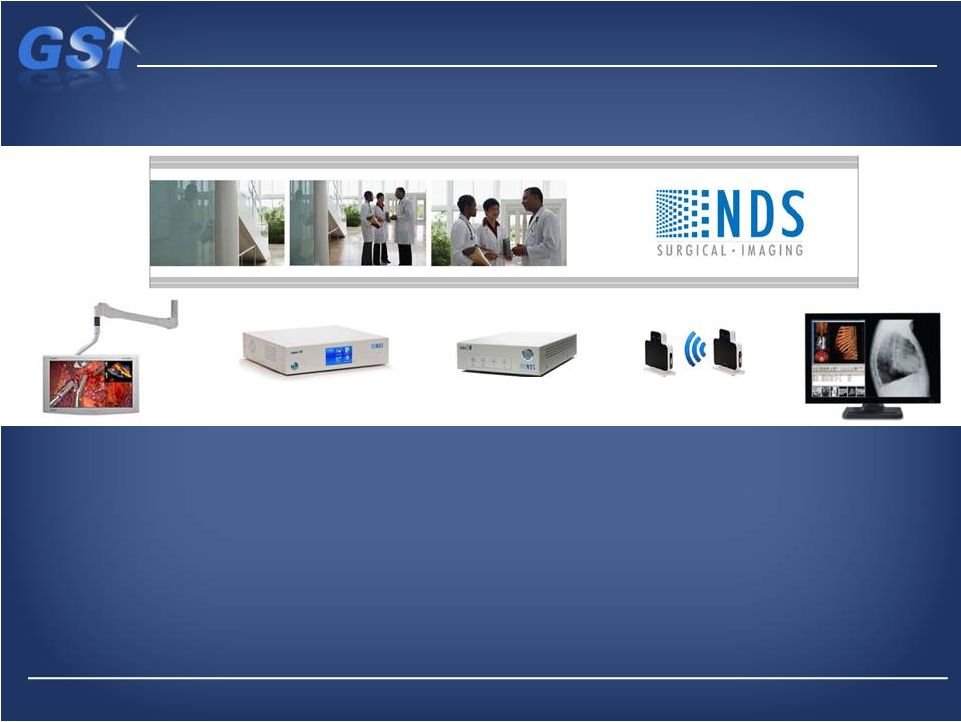
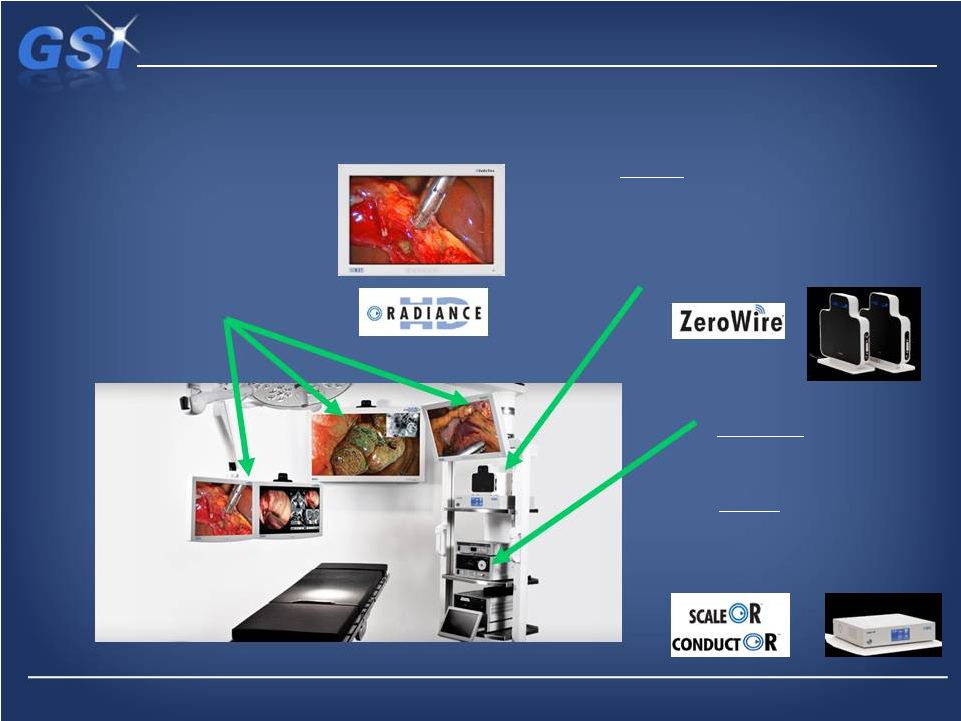 A
complete offering… A complete offering…
…in surgical visualization
…in surgical visualization
Product Offering
Product Offering
Displays
•
•
•
•
•
•
•
Wireless Imaging
•
•
•
•
Informatics
•
•
ConductOR –all-in-one platform,
enabling video format conversion,
image scaling, routing, switching
and IP streaming.
ScaleOR
–
medical-grade video
converter/scaler, supporting
analog and digital video in HD or
SD formats
Ultra high resolution (full HD to 55”)
120Hz refresh rate
Proprietary LED backlight design
Full Multi Mode Imaging (MMI)
Pixel-by-pixel custom color correction
Proprietary software algorithms match
correction to each OEM spec’s
Advanced image processing, digital signal
processing
ZeroWire
real-time full HD surgical video
Medical grade wireless connectivity
Full HD with less than one frame latency
Ultra Wide Band (UWB) frequency spectrum –
allows usage in the OR |
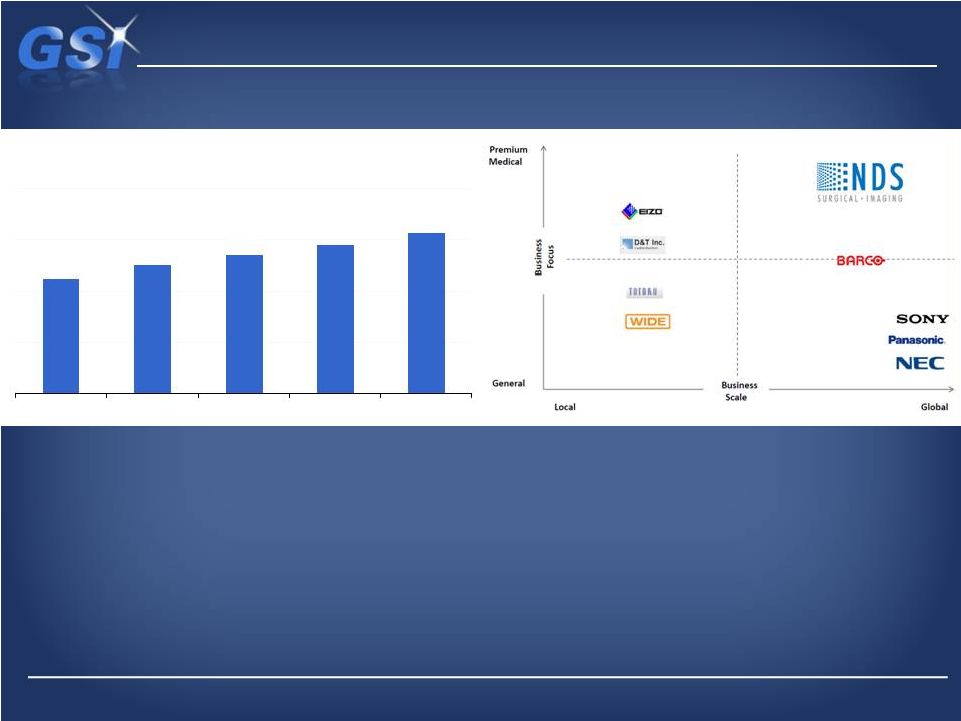 NDS
is the leader in the premium segment… …of this ~$500M
market …of this ~$500M market
Market Overview
Market Growth Drivers
•
Aging population -
increased procedures
•
Rising standard of care in developing world (China,
Brazil, Turkey)
•
Minimally Invasive Surgery (MIS) drives need for
integrated OR’s
•
New technologies (3D surgical cameras, LED and
OLED displays)
•
New applications (e.g. robotic surgery)
Product Requirements
•
FDA quality system compliance
•
Full HD pixel resolution with multi mode capability
•
Highly consistent unit-to-unit color rendition in
varying operating conditions
•
Compatibility with & correction for varying OEM
camera and optic system specifications
•
Wide range of supported input types including
ultra die band wireless capability
*Management Estimates
Medical Display Market ($M)
*
$450
$500
$540
$580
$625
2011
2012
2013
2014
2015 |
 NDS
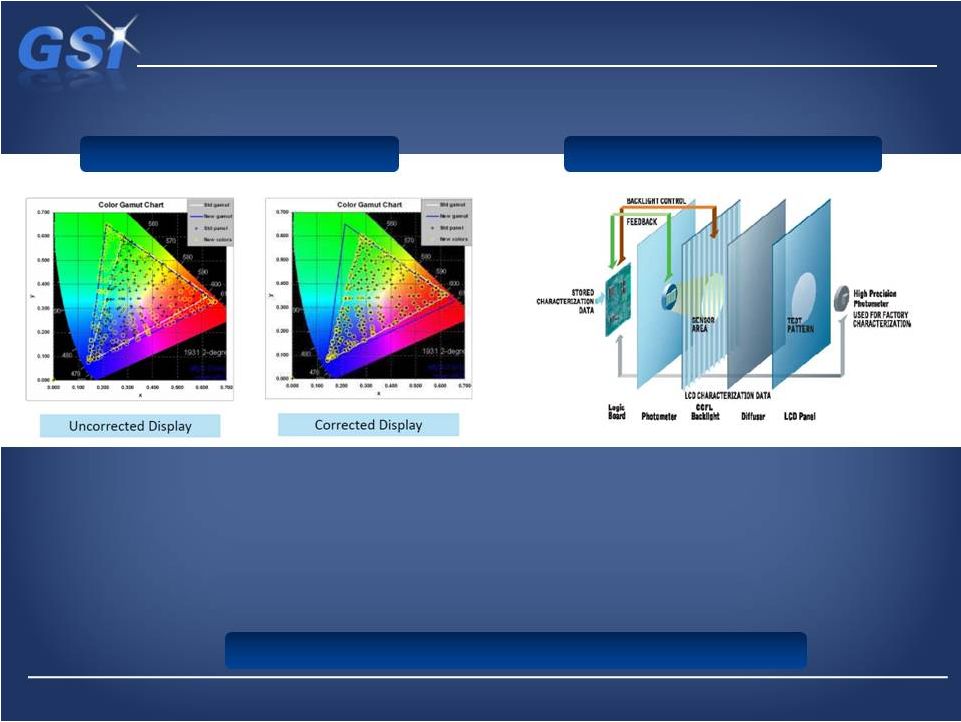
color correction technology… NDS color correction technology…
…provides a distinct advantage in the market
…provides a distinct advantage in the market
NDS Technology
NDS Technology
•
Real-time
pixel-by-pixel
Color
Response
Correction
•
Proprietary
technology
exclusive
to
NDS
•
Displays
conform
to
the
BT.709
HDTV
color
standard
•
Each display is fully factory characterized (unique
to NDS) –
no field calibration
•
Characterization data and the color correction are
stored in the display
•
Color correction is monitored and adjusted as the
operating conditions change
•
Most accurate calibration algorithms in market
Surgical Displays
Radiology Displays
IP Portfolio: 46 patents with ~50% issued
IP Portfolio: 46 patents with ~50% issued |
 NDS
provides
a
substantial
platform…
…for
our
medical
components
growth
strategy
Strategic Fit
•
Substantial
base
of
medical
revenue
at
affordable
multiple
(less
than
7x
EBITDA)
•
Transforms
GSI
to
nearly
40%
medical
–
expect
less
cyclical
revenue
&
earnings
•
Significant
platform
for
further
medical
growth,
including
follow-on
acquisitions
•
Customer
overlap
with
GSI
medical
applications
–
OEM
sales
channel
leverage
enables deeper key account penetration
•
Technology is comparable
to GSI product lines:
-
OEM-focused
medical
peripherals
-
Application
oriented,
highly
engineered
photonics
-
Not
operations
intensive
-
light
assembly,
test
operations,
supply
chain
-
Proprietary
software
is
key
differentiator
–
leverages
GSI
color
measurement
-
Medium
volume
-
“tens
of
thousands”
of
units
per
year
•
Rationalization
opportunity
in
Bay
Area
–
a
key
location
for
GSI |
 Revenue
Growth
Growth
Potential
Potential
Adj. EBITDA**
Adj. EBITDA**
Value Chain
Value Chain
Focus
Focus
Structure
Structure
Mix
Mix
Growth
Growth
Strategy
Strategy
Performance
Performance
Focus
Focus
The NDS acquisition …
The NDS acquisition …
…a major milestone in our transformation
…a major milestone in our transformation
* pro forma Excel Technologies + GSI Group Inc results as reported in GSI Group Inc.
8K filed on 07/18/08 ** adjusted EBITDA, non-GAAP financial metric
~$480M*
Low single digit
~$70M
33% systems
67% OEM
<20 distinct P&L’s
>30 sites
>50% Semi
<10% Medical
Unrelated
acquisitions
Maximize margins
Pre
2008
$355M+
Mid to high single digit
$55M+
~95% OEM
2 focused groups
<15 sites
~16% Semi
~38% Medical
Build out growth
platforms via focused
R&D and bolt-on M&A
Profit growth
Pro
Forma
w/
NDS
$500M+
High single digit
$100M+
~100% OEM
2 focused groups
<10 sites
<15% Semi
~40% Medical
Current approach
plus selective
transformative M&A
Sustained profitable
revenue growth
Vision |
 15
GSI in 2013
GSI in 2013 |
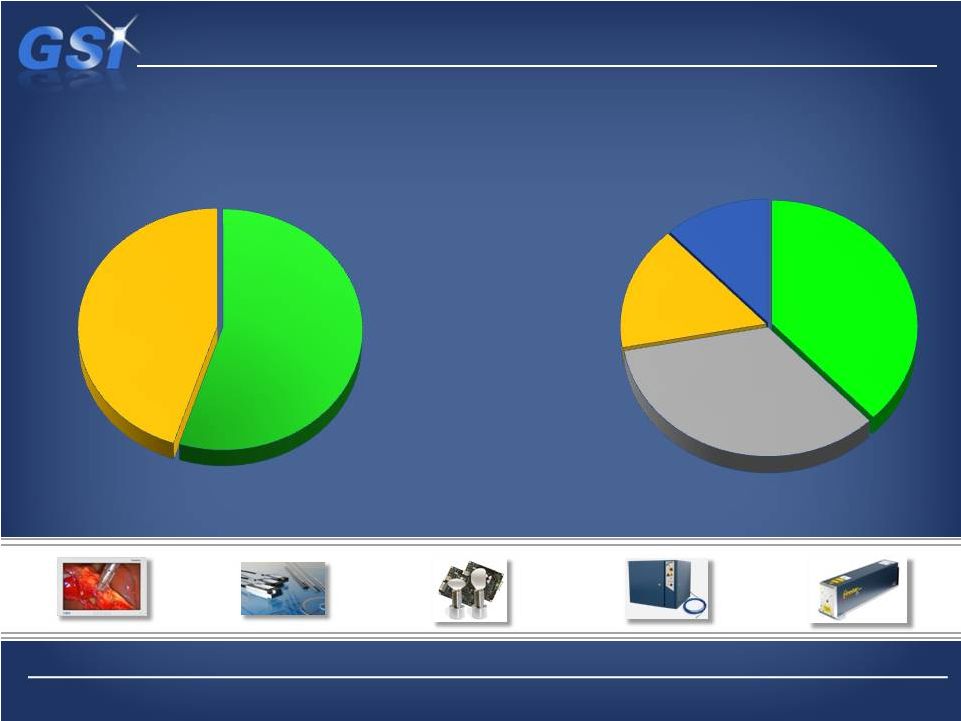 Medical
is
is
now
now
38%
38%
of
of
portfolio…
portfolio…
…with Microelectronics down to 16%
…with Microelectronics down to 16%
Laser
Laser
*
*
Precision
Precision
16
Scientific
Scientific
Medical
Medical
Micro-
Micro-
electronics
electronics
2013 Pro Forma Breakdown
2013 Pro Forma Breakdown
Industrial
Industrial
*Includes Beam delivery technologies
55%
45%
38%
35%
16%
11% |
 We
are investing for growth… …in our three major platforms
Growth Platforms Updates
•
Beam
delivery
for
lasers –
market
growth
~8%
•
Leverage our #1 position in Galvanometers to enter Scan
Head market (modules)
•
Double addressable market up to ~$200M
•
FY’12
growth
forecast
of
~30%
-
numerous
new
design
wins
•
~$25M revenue opportunity by 2015
Scanning Solutions
Scanning Solutions
•
~$600M market growing ~20%
•
Strong offering in mid-power
•
Products to 3kW
•
Converting installed base to fiber
•
FY’12 growth forecast +180%
•
Major investments underway:
-
Lower cost architecture
-
Stronger global sales capability
-
New applications centers in U.S. and China
Fiber Lasers
Fiber Lasers
17
Source: Strategies Unlimited, Management Estimates
•
~$135M pro forma with NDS
•
Numerous opportunities with OEM’s
•
Significant channel leverage
•
Key Applications:
-
Surgical/Radiological Visualization
-
Robotic Surgery
-
OCT Retinal Scanning
-
Patient Monitoring
-
Defibrillation/EKG
Medical Components
Medical Components |
 We
faced market challenges… We faced market challenges…
…driven by semiconductor market and macro economy
…driven by semiconductor market and macro economy
Challenges faced in 2012
Challenges faced in 2012
•
•
Prolonged downturn in semiconductor equipment market had
Prolonged downturn in semiconductor equipment market had
significant impact
significant impact
-
-
No demand recovery in 2H’12
No demand recovery in 2H’12
-
-
Divestitures processes impacted
Divestitures processes impacted
•
•
Organization bandwidth fully consumed with change initiatives
Organization bandwidth fully consumed with change initiatives
•
•
Talent
Talent
became
became
a
a
bottleneck
bottleneck
within
within
the
the
businesses
businesses
–
–
numerous
numerous
upgrades were necessary
upgrades were necessary
•
•
Economic/tax uncertainty impacted some M&A efforts
Economic/tax uncertainty impacted some M&A efforts
Economic Uncertainty for 2013 |
 NDS
NDS
acquisition
acquisition
provides
provides
increased
increased
scale…
scale…
…with conservative view of base business
…with conservative view of base business
~$270M
~$270M
$304M
$304M
$286M
$286M
Revenue
Revenue
Outlook
Outlook
$355-$365M
$355-$365M
2010 Actual
2011 Actual
2012 Forecast
2013 Outlook
w/ NDS |
 Base
EBITDA growth from 2012 cost actions… Base EBITDA growth from 2012 cost
actions… …with NDS adding ~$12M of EBITDA
…with NDS adding ~$12M of EBITDA
+$41M
+$41M
$56M
$56M
$56M
$56M
Adjusted
Adjusted
EBITDA
EBITDA
Outlook
Outlook
$55-$60M
$55-$60M
2010 Actual
2011 Actual
2012 Forecast
2013 Outlook
w/ NDS |
 Demonstrated history of strong cash generation…
…enables pursuit of strategic goals
$108M
$68M
$48M
($50.8M)
($50.8M)
($13.2M)
($13.2M)
$5.4M
$5.4M
($68M)
($68M)
Net Debt*
Net Debt*
$57M
$55M
$53M
Total Debt
Total Debt
Cash Balance
Cash Balance
1.9x
1.9x
1.2x
1.2x
1.1x
1.1x
~1.9x
~1.9x
Debt/Adj
Debt/Adj
EBITDA
EBITDA
~$40M
~$108M
Capital Structure
Capital Structure
*Estimated Proforma as of March 31,
2013 *
2010 A
2011 A
3Q 2012 A
Proforma Fcst
w/ NDS |
 We
are fully committed… We are fully committed…
…to
…to
delivering
delivering
on
on
our
our
agenda
agenda
for
for
2013
2013
Key Priorities for 2013
Key Priorities for 2013
•
•
Integrate NDS and pursue opportunities
Integrate NDS and pursue opportunities
•
•
Deliver on financial commitments in uncertain economy
Deliver on financial commitments in uncertain economy
•
•
Finalize remaining divestiture
Finalize remaining divestiture
•
•
Build momentum on Growth Platforms
Build momentum on Growth Platforms
•
•
Operational Excellence and cash generation
Operational Excellence and cash generation
•
•
Continued
Continued
focus
focus
on
on
acquisition
acquisition
pipeline
pipeline
–
–
follow-on
follow-on
deals
deals
•
•
Successful close-out of IRS settlement
Successful close-out of IRS settlement |
 23
Appendix
Appendix |
 Safe
Harbor and Forward Looking Information Certain statements in this presentation are
“forward-looking statements” within the meaning of the Private Securities Litigation Reform Act of 1995 and are based
on current expectations and assumptions that are subject to risks and uncertainties. All statements
contained in this presentation that do not relate to matters of historical fact should be
considered forward-looking statements, and are generally identified by words such as “expect,” “intend,” “anticipate,” “estimate,” “plan,”
“aim,” “pro forma,” and other similar expressions. These forward-looking
statements include, but are not limited to, statements related to: the Company’s expected
future financial performance as a result of the acquisition of NDS; the expected share of the
Company’s future revenues generated from the medical market; the Company’s
expectations regarding its ability to leverage its medical OEM sales channels and the NDS acquisition; the expected opportunities for growth as a
result of the NDS acquisition; anticipated sales performance; industry trends; market conditions; size
and growth of market potential; the Company’s optimism regarding its prospects for the
future; and other statements that are not historical facts.
These forward-looking statements are neither promises nor guarantees, but involve risks and
uncertainties that may cause actual results to differ materially from those contained in the
forward-looking statements. Our actual results could differ materially from those anticipated in these forward-looking statements for many
reasons, including, but not limited to, the following: economic and political conditions and the
effects of these conditions on our customers’ businesses and level of business activity;
our significant dependence upon our customers’ capital expenditures, which are subject to cyclical market fluctuations; our dependence upon our
ability to respond to fluctuations in product demand; our ability to continually innovate; delays in
our delivery of new products; our reliance upon third party distribution channels subject to
credit, business concentration and business failure risks beyond our control; fluctuations in our quarterly results and our failure to
meet or exceed the expectations of securities analysts or investors; customer order timing and other
similar factors beyond our control; changes in interest rates, credit ratings or foreign
currency exchange rates; risk associated with our operations in foreign countries; our increased use of outsourcing in foreign countries; our
failure to comply with local import and export regulations in the jurisdictions in which we operate;
our history of operating losses and our ability to sustain our profitability; our exposure to
the credit risk of some of our customers and in weakened markets; violations of our intellectual property rights and our ability to protect
our intellectual property against infringement by third parties; risk of losing our competitive
advantage; our ability to make acquisitions or divestitures that provide business benefits; our
failure to successfully integrate current and future acquisitions, including NDS, into our business; our failure to achieve the expected benefits
from our acquisitions, including our acquisition of NDS; our ability to retain key personnel; our
restructuring and realignment activities and disruptions to our operations as a result of
consolidation of our operations; product defects or problems integrating our products with other vendors’ products; failure to maintain
satisfactory compliance with the regulations of the United States Food and Drug Administration and
other governmental agencies; disruptions in the supply of or defects in raw materials, certain
key components or other goods from our suppliers, including certain sole-source suppliers for certain products; production
difficulties and product delivery delays or disruptions; changes in governmental regulation of our
business or products; disruption in our information technology systems or our failure to
implement new systems and software successfully; our failure to realize the full value of our intangible assets; any requirement to make
additional tax payments and/or recalculate certain of our tax attributes depending on the resolution
of the complaint we filed against the U.S. government; our ability to utilize our net operating
loss carry-forwards and other tax attributes; fluctuations in our effective tax rates and audit of our estimates of tax liabilities; being
subject to U.S. federal income taxation even though we are a non-U.S. corporation; being subject
to the Alternative Minimum Tax for U.S. federal income tax purposes; any need for additional
capital to adequately respond to business challenges or opportunities and repay or refinance our existing indebtedness, which
may not be available on acceptable terms or at all; volatility in the market for our common shares;
our dependence on significant cash flow to service our indebtedness and fund our operations;
our ability to access cash and other assets of our subsidiaries; the influence over our business of several significant
shareholders; provisions of our articles of incorporation may delay or prevent a change in control;
our significant existing indebtedness and restrictions in our new senior secured credit
agreement that may limit our ability to engage in certain activities; our intention not to pay dividends in the near future; and our failure to
maintain appropriate internal controls in the future.
Other important risk factors that could affect the outcome of the events set forth in these statements
and that could affect the Company’s operating results and financial condition are
discussed in Item 1A of our Annual Report on Form 10-K for the fiscal year ended December 31, 2011, and in the Company’s subsequent
filings with the SEC made prior to or after the date hereof. Such statements are based on the
Company’s management’s beliefs and assumptions and on information currently available
to the Company’s management. The Company disclaims any obligation to update any forward-looking statements as a result of
developments occurring after the date of this document except as required by law.
|
 Use
of Non-GAAP Financial Measures Use of Non-GAAP Financial Measures
This press release includes a financial measure, Adjusted EBITDA, which is not a financial measure
prepared in accordance with generally accepted accounting principles (“GAAP”). The
Company defines Adjusted EBITDA as the net income attributable to GSI Group Inc. before
deducting interest, income taxes, depreciation, amortization, non-cash share-based
compensation, restructuring, restatement, acquisition and other non-recurring costs, income
from discontinued operations, net of tax, and other non-operating income/expense items, including foreign
exchange gains/losses and earnings from equity investment. Management believes Adjusted EBITDA
provides meaningful supplementary information regarding the Company’s operating results
because it excludes amounts that management does not consider as part of operating results when
assessing and measuring the operational and financial performance of the Company. Adjusted EBITDA is used by management to
evaluate operating performance, communicate financial results to the Board of Directors, benchmark
results against historical performance and the performance of peers, evaluate investment
opportunities including acquisitions and discontinued operations, and determine the bonus
payments for senior management and employees. The Company believes this non-GAAP measure
provides greater transparency and insight into management’s method of analysis. Because of the forward-looking nature of the forecasted Adjusted EBITDA figure included in
this press release, specific quantification of the amounts that would be required to reconcile
net income to Adjusted EBITDA are not available. The Company believes that there is a degree of
volatility with respect to the Company’s and NDS’s net income which preclude it from
providing accurate forecasted GAAP to non-GAAP reconciliations. Based on the above,
the Company believes that providing estimates of the amounts that would be required to reconcile the
forecasted Adjusted EBITDA figure would imply a degree of precision that would be confusing or
misleading to investors for the reasons identified above.
|
 Last Twelve Months Ended
Twelve Months Ended
September 28, 2012
December 31, 2011
December 31, 2010
(in thousands of dollars)
Income from operations (GAAP)
$ 15,495
$ 35,848
$ 36,027
Depreciation and amortization
13,618
14,467
14,687
Share-based compensation
4,237
3,276
1,871
Restructuring, restatement and other nonrecurring costs (a)
9,370
2,406
3,319
Net income attributable to noncontrolling interest
(38)
(28)
(48)
Adjusted EBITDA (Non-GAAP)
$ 42,682
$ 55,969
$ 55,856
Non-GAAP EBITDA Reconciliation
(a)
(a)
Restructuring, restatement and other nonrecurring costs includes restructuring costs,
pre-petition and post-emergence professional fees associated with our bankruptcy
proceedings and fees related to third parties for services performed in connection with the review and investigation of revenue transactions examined
and the restatement of the Company’s 2004 through 2008 financial statements. |
 Net
Debt & Leverage Ratios Non-GAAP Net Debt and Leverage Ratios
Twelve Months Ended
Twelve Months Ended
Twelve Months Ended
Twelve Months Ended
September 28, 2012
September 28, 2012
December 31, 2011
December 31, 2011
December 31, 2010
December 31, 2010
(in thousands of dollars, except ratio information)
Debt
Debt
($47,500)
($47,500)
($68,000)
($68,000)
($107,575)
($107,575)
Less: cash and cash equivalents
Less: cash and cash equivalents
52,863
52,863
54,835
54,835
56,781
56,781
Net debt (a)
Net debt (a)
$5,363
$5,363
($13,165)
($13,165)
($50,794)
($50,794)
Total Debt
Total Debt
($47,500)
($47,500)
($68,000)
($68,000)
($107,575)
($107,575)
Adjusted EBITDA (non-GAAP) (b)
$42,682
$42,682
$55,969
$55,969
$55,856
$55,856
Total Debt/Adjusted EBITDA
Total Debt/Adjusted EBITDA
1.1
1.1
1.2
1.2
1.9
1.9
Total Equity
Total Equity
$219,091
$219,091
$209,360
$209,360
$178,678
$178,678
Total Debt/Total Equity
Total Debt/Total Equity
22%
22%
32%
32%
60%
60%
(a)
Net debt is defined as total debt less cash and cash equivalents.
(b)
For Adjusted EBITDA calculation, refer to the Non-GAAP EBITDA Reconciliation
page. |