Attached files
| file | filename |
|---|---|
| 8-K - 8-K - DANA INC | d466597d8k.htm |
 Honesty & Integrity
Good Corporate Citizen
Open Communication
Continuous Improvement
©
2013 Dana Limited. This presentation contains copyrighted and confidential
information of Dana Holding Corporation and/or its subsidiaries. Those having access to this work
may not copy it, use it, or disclose the information contained within it without
written authorization of Dana Holding Corporation. Unauthorized use may result in prosecution.
Honesty & Integrity
Good Corporate Citizen
Open Communication
Continuous Improvement
Deutsche Bank
2013 Global Auto Industry Conference
January 15, 2013
©
2013 Dana Limited. This presentation contains copyrighted and confidential
information of Dana Holding Corporation and/or its subsidiaries. Those having access to this work
may not copy it, use it, or disclose the information contained within it without
written authorization of Dana Holding Corporation. Unauthorized use may result in prosecution.
Exhibit 99.1 |
 ©
Dana 2013
Safe Harbor Statement
Certain statements and projections contained in this presentation are, by their nature,
forward-looking within the meaning of the Private Securities Litigation Reform Act of
1995. These forward-looking statements are based on our current expectations,
estimates and projections about our industry and business, management’s beliefs,
and certain assumptions made by us, all of which are subject to change. Forward-
looking statements can often be identified by words such as “anticipates,”
“expects,” “intends,” “plans,” “predicts,”
“believes,” “seeks,” “estimates,” “may,” “will,” “should,”
“would,” “could,” “potential,” “continue,”
“ongoing,” similar expressions, and variations or negatives of these words.
These forward-looking statements are not guarantees of future results and are subject to
risks, uncertainties and assumptions that could cause our actual results to differ materially
and adversely from those expressed in any forward-looking statement. Dana’s
Annual Report on Form 10-K, subsequent Quarterly Reports on Form 10-Q, recent Current
Reports on Form 8-K, and other Securities and Exchange Commission filings discuss important
risk factors that could affect our business, results of operations and financial
condition. The forward-looking statements in this presentation speak only as of this
date. Dana does not undertake any obligation to revise or update publicly any
forward-looking statement for any reason.
|
 The
Dana Snapshot Founded in 1904
Facilities in 27 countries
Serving customers in 125 countries
2012 preliminary sales ~$7.2 billion
Adjusted EBITDA margin ~10.8%
Dana
is
the
global
technology
leader
in
efficient
power
conveyance
and
energy
management
solutions
that
enable
our
customers
to
achieve
their
sustainability
objectives
3 |
 ©
Dana 2013
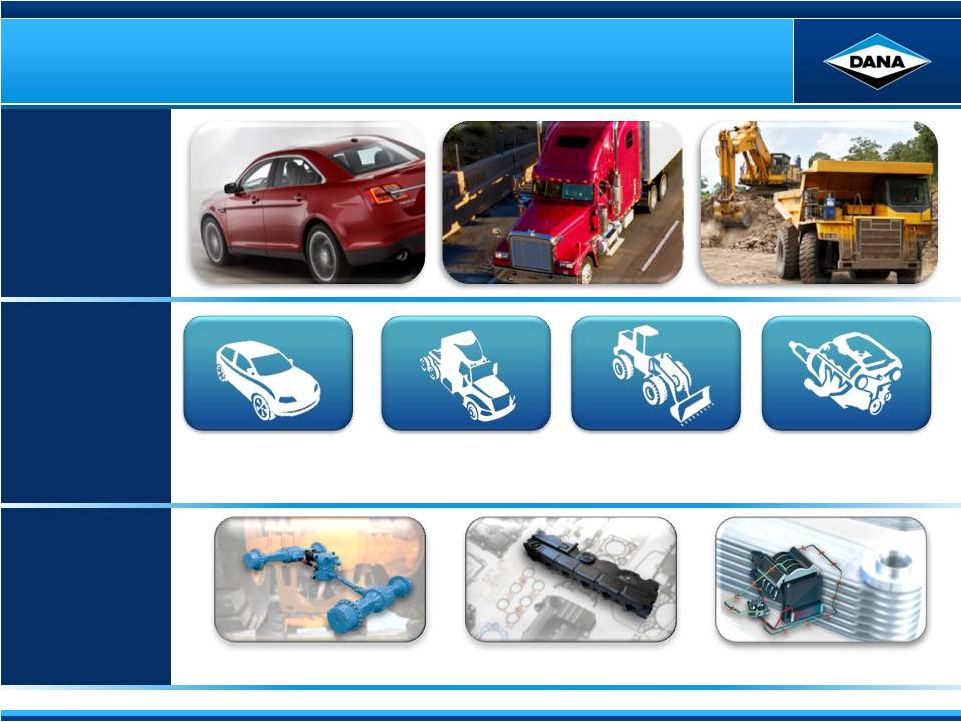
Applying Dana’s Expertise
4
Driveline
Sealing
Thermal Management
Light Vehicle
Driveline
Commercial Vehicle
Driveline
Off-Highway
Power
Technologies
Dana’s
End Markets
Dana’s
Business
Segments
Dana’s
Competencies
&
Technologies |
 ©
Dana 2013
Sales by Market and Region
45%
Light
Vehicles
35%
Heavy
Vehicles**
2012 Sales by Market*
2012 Sales by Region*
20%
Off-Highway
Markets
* 2012 Preliminary
** Includes 100% of DDAC preliminary 2012 sales of ~$700M
5
20%
Asia Pacific**
43%
North America
12%
South
America
25%
Europe |
 ©
Dana 2013
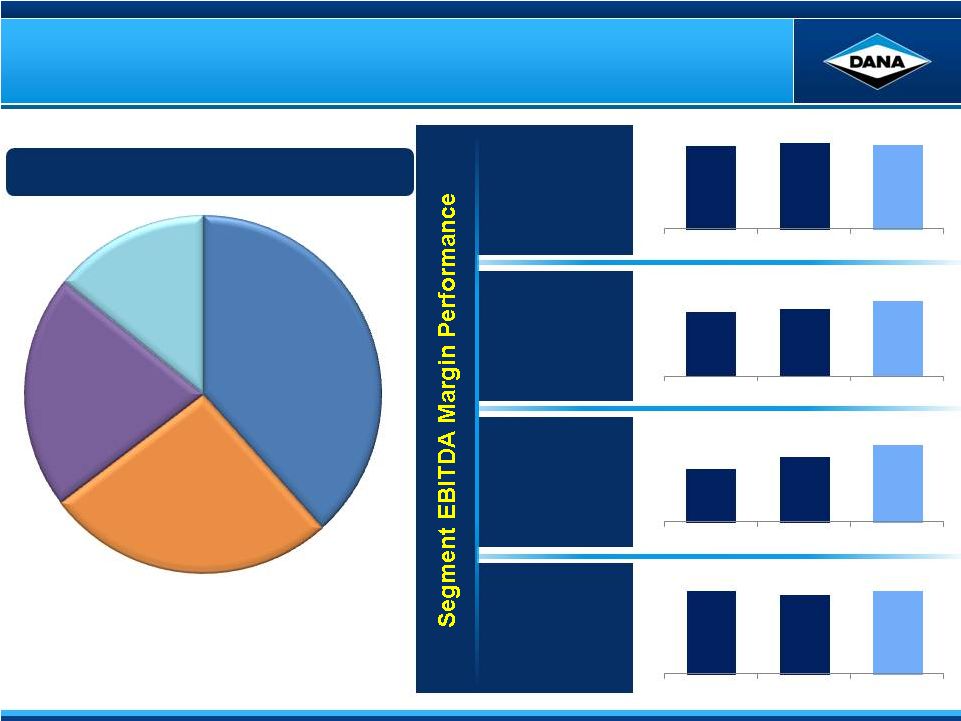
Segment Sales and Performance
6
21%
Off-Highway
38%
Light Vehicle
14%
Power
Technologies
27%
Commercial Vehicle
* 2012 Preliminary
Total Sales -
$7.2 Billion*
See appendix for comments regarding the presentation of non-GAAP
measures Light Vehicle
Driveline
Commercial
Vehicle
Driveline
Off Highway
Power
Technologies
2012 Sales by Business Segment*
9.5%
9.7%
9.6%*
2010
2011
2012P
9.5%
9.7%
10.1%*
2010
2011
2012P
8.7%
10.6%
12.6%*
2010
2011
2012P
13.5%
13.3%
13.5%*
2010
2011
2012P |
 ©
Dana 2013
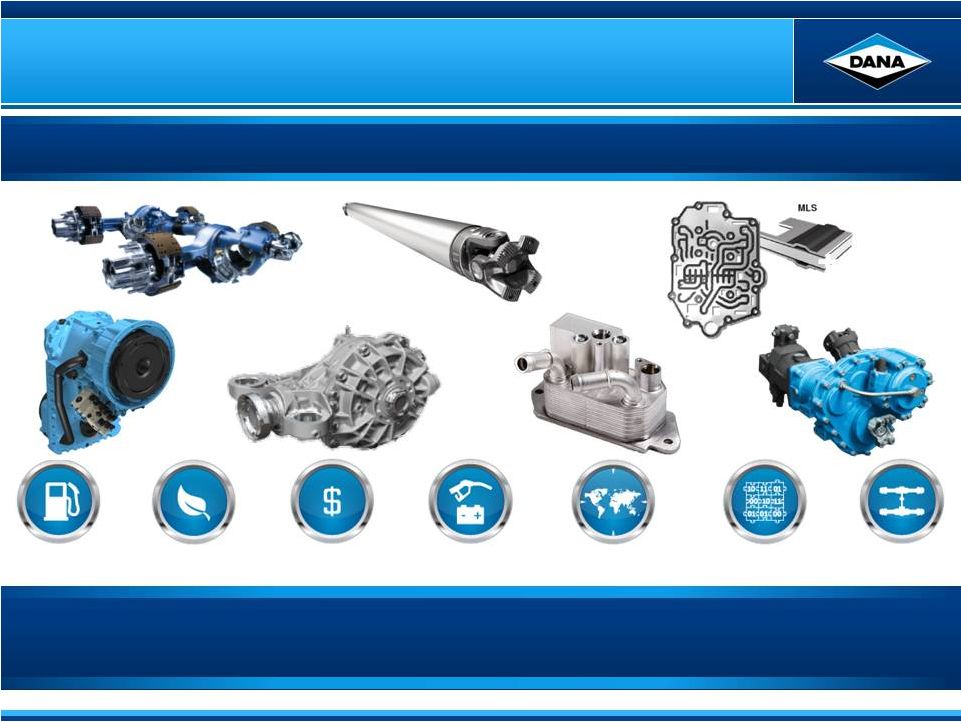
Product Innovation
7
Software
Integration
Regionalization
Fuel
Efficiency
Electric
Hybrids
Systems
Integration
Cost of
Ownership
Emissions
Control
Technology / Product Innovation Addressing
Market-Based Value Drivers
Recent Product Introductions
©
Dana 2013 |
 2012
Summary 8
Furthered
technology
/
innovation
strategy
–
new
product
introductions and strategic technology alliance
Continued
operating
model
integration
–
driving
profitability and
investment return throughout the organization
Profitability actions
North America Commercial Vehicle initiatives
Final wind-down of Structures business
Divestiture of Leisure Products
Exit of certain legacy programs
Continued margin expansion and cash flow generation despite
volatile / lower end-market demand
Capital
structure
/
shareholder
return
actions
–
pension funding,
common dividend, and share repurchase plan
©
Dana 2013 |
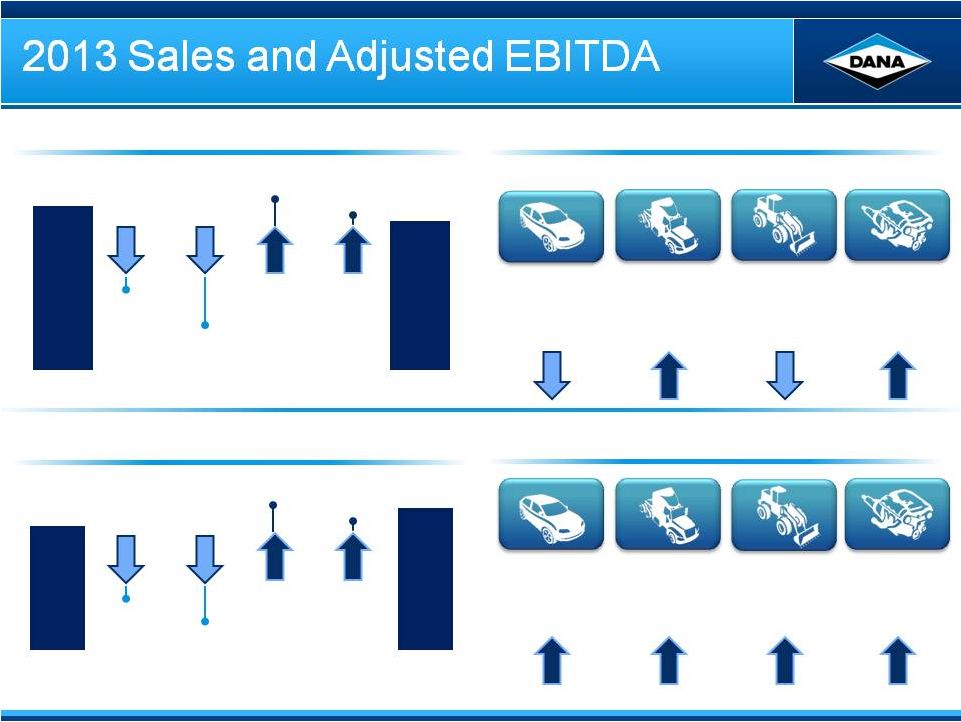
 Looking Forward –
2013 Markets
Light Vehicle
Commercial Vehicle
Off-Highway
Market
Conditions
Impact on
Dana Sales
South America
Light Vehicle
Commercial Vehicle
Off-Highway
Market
Conditions
Impact on
Dana Sales
Europe
Market Recovery
Market Recovery
Market Recovery
Comment
Light Vehicle
Commercial Vehicle
Off-Highway
Market
Conditions
Impact on
Dana Sales
North America
Program Roll-offs
Class 8 stable
Insourcing /
Mfg Shift to AP
Comment
Construction Weak
Comment
Light Vehicle
Commercial Vehicle
Off-Highway
Market
Conditions
Impact on
Dana Sales
Asia Pacific
Program Ramp-up
New Business
Mfg Shift from NA
Comment
New Business
Change in mix
9
©
Dana 2013 |
 ©
Dana 2013
Dana’s Advantage
New technology based on
market value drivers
Cross-selling across
customer base,
regions and markets
Synergies in technology
applications
Systems solutions
Continued execution of lean
operating model
10 |
 ©
Dana 2013
2012 Preliminary Financial Results
See appendix for comments regarding the presentation of non-GAAP measures
* Excluding
voluntary
pension
contribution
of
$150
million
in
Q1
2012
** Includes marketable securities
2012 Guidance
Preliminary
Results
Compared to 2011
Sales
$7.2 –
$7.3 B
$7.2B
Currency and lower CV
end-market demand
Adjusted EBITDA
$780 –
$800 M
$780M
~ $15M improvement –
pricing and cost actions
Margin
~11.0%
~10.8%
~ 70 bps improvement
Capital Spend
$160 –
$170 M
$160M
Investment discipline
Free Cash Flow*
$240 –
$260 M
$320M
~ $145M improvement
Cash**
$1.1B
~ $140M increase
11 |
 ©
Dana 2013
Global Vehicle Production
Dana Forecasts (Units in 000s)
SOURCE: IHS Global Insight, ACT, PSR, Dana Estimates
2012
Prelim.
2013
Outlook
North America
Light Vehicle Total
15,300
15,900 –
16,100
Light Truck (Full Frame)
3,400
3,200 –
3,400
Medium Truck
180
180 –
190
Heavy Truck (Class 8)
274
265 –
275
Agricultural Equipment
69
65 –
75
Construction Equipment
156
160 –
170
Europe
(Incl. Eastern Europe)
Light Vehicle
18,900
18,000 –
19,000
Medium/Heavy Truck
400
390 –
410
Agricultural Equipment
255
245 –
255
Construction Equipment
322
285 –
295
South America
Light Vehicle
4,300
4,400 –
4,600
Medium/Heavy Truck
167
180 –
190
Agricultural Equipment
48
50 –
55
Construction Equipment
19
15 –
20
Asia Pacific
Light Vehicle
41,000
41,000 –
42,000
Medium/Heavy Truck
1,500
1,600 –
1,700
Agricultural Equipment
750
780 –
790
Construction Equipment
614
650 –
660
12%
North America
Overall light vehicle strong
Full frame trucks in line with last year
Class 8 truck production flat
Europe
Light vehicle continued softness
Construction equipment weakens
South America
Heavy and medium truck rebounding
Asia Pacific
Heavy truck strengthening
Ag & Construction improving
Summary
12 |
 ©
Dana 2013
2013 Expectations
13
Production volumes largely
flat to 2012 preliminary results
Currency, divestitures and
program roll-offs lower 2013
sales expectation
Dana Margin Levers
Optimize Performance Within Controllable Levers
Continued focus and
execution on controllable
levers to further margin
expansion
Maintain cost and investment
discipline
Remain flexible as markets
expected to remain volatile
during the course of 2013
Summary
-
+
-
+
-
+
-
+
-
+
Current
Future
Market
Product / Process Complexity
Technology Margin Profile
Macro Environment
Production Demand
Materials / Pricing Leverage
Conversion / Structural Costs |
 2013 Financial Targets
*Assumes
24%
effective
tax
rate
&
excludes
impact
of
the
share
repurchase
program
Key
Fx
rate
assumptions
for
2013:
EUR
$1.27,
GBP
$1.60,
BRL
$0.53,
MXN
$
0.68
See
appendix
for
comments
regarding
the
presentation
of
non-GAAP
measures
Key Financial Metrics
2013 Plan
Sales
~$7.1B
Adjusted EBITDA
$800 –
$820 M
Margin
~11.4%
Diluted Adjusted EPS*
$1.88 –
$1.95
Capital Spend
$180 –
$200 M
Free Cash Flow
$240 –
$260 M
14
Other / Selected Cash Flow Items
Depreciation / Amortization
~$275M
Cash Taxes
$125 –
$135 M
Net Interest
~$70M
Pension Funding, Net
~$60M
Restructuring
$45 –
$55 M
©
Dana 2013 |
 ~$2.7B
~$2.0B
~$1.4B
~$1.0B
LV
CV
OH
PT
15
Sales by Business Segment
Sales Progression
Adjusted EBITDA Progression
~10%
~11%
~13%
~14%
LV
CV
OH
PT
2012
Prelim.
~$7.2B
Currency
~$(40)M
Divestitures &
Program Roll-Offs
~$(240)M
Volume / Mix
~$105M
Pricing /
Recoveries
~$75M
2013
Plan
~$800 -
$820M
Currency
~$(5)M -
Flat
Divestitures &
Program Roll-Offs
~$(20) -
(15)M
Volume / Mix
~$10 -
15M
Performance
~$35 -
40M
2012
Prelim.
~$780M
Margin by Business Segment
See appendix for comments regarding the presentation of non-GAAP
measures 2013
Plan
~$7.1B
©
Dana 2013 |
 Honesty & Integrity
Good Corporate Citizen
Open Communication
Continuous Improvement
©
2013 Dana Limited. This presentation contains copyrighted and confidential
information of Dana Holding Corporation and/or its subsidiaries. Those having access to this work
may not copy it, use it, or disclose the information contained within it without
written authorization of Dana Holding Corporation. Unauthorized use may result in prosecution.
Honesty & Integrity
Good Corporate Citizen
Open Communication
Continuous Improvement |
 ©
Dana 2013
Appendix
Non-GAAP Financial Information
The preceding slides refer to Adjusted EBITDA, which we’ve defined to be earnings from continuing
and discontinued operations before interest, taxes, depreciation, amortization, non-cash
equity grant expense, restructuring expense and other nonrecurring items (gain/loss on debt
extinguishment or divestitures, impairment, etc.). The most significant impact on
Dana’s ongoing results of operations as a result of applying fresh start accounting following our emergence from
bankruptcy was higher depreciation and amortization. By using adjusted EBITDA, a performance
measure which excludes depreciation and amortization, the comparability of results is
enhanced. Management also believes that adjusted EBITDA is an important measure since the
financial covenants in our debt agreements are based, in part, on adjusted EBITDA.
Adjusted EBITDA should not be considered a substitute for income (loss) before income taxes, net
income (loss) or other results reported in accordance with GAAP. Adjusted EBITDA may not
be comparable to similarly titled measures reported by other companies. Diluted adjusted EPS is a
non-GAAP financial measure which we have defined as adjusted net income divided by adjusted
diluted shares. We define adjusted net income as net income (loss) attributable to the parent company
excluding restructuring expense, amortization expense and nonrecurring items (as used in adjusted
EBITDA), net of any associated income tax effects. We define adjusted diluted shares as
diluted shares as determined in accordance with GAAP based on adjusted net income. This
measure is considered useful for purposes of providing investors, analysts and other interested
parties with an indicator of ongoing financial performance that provides enhanced comparability to
EPS reported by other companies. Diluted adjusted EPS is neither intended to represent nor be an
alternative measure to diluted EPS reported under GAAP. Free cash flow is a non-GAAP
financial measure which we have defined as cash provided by (used in) operating activities
excluding any bankruptcy claim-related payments, less purchases of property, plant and
equipment. We believe this measure is useful to investors in evaluating the operational
cash flow of the company inclusive of the spending required to maintain the operations.
Free cash flow is neither intended to represent nor be an alternative to the measure of net cash
provided by (used in) operating activities reported under GAAP. Free cash flow may not be
comparable to similarly titled measures reported by other companies. Please reference the
“Non-GAAP financial information” accompanying our quarterly earnings conference call
presentations on our website at www.dana.com/investors for our GAAP results and the
reconciliations of these measures, where used, to the comparable GAAP measures. |