Attached files
| file | filename |
|---|---|
| 8-K - 8-K - CHRISTOPHER & BANKS CORP | a13-2910_18k.htm |
| EX-99.1 - EX-99.1 - CHRISTOPHER & BANKS CORP | a13-2910_1ex99d1.htm |
Exhibit 99.2
|
|
Charting Our Path to Profitability January 16, 2013 |

|
|
Certain statements on the slides which follow may be forward-looking statements about Christopher & Banks Corporation (the “Company”). Such forward-looking statements involve risks and uncertainties which may cause actual results to differ. These forward-looking statements may be identified by such terms as “will”, “expect”, “believe”, “anticipate”, “outlook”, “estimate” and similar terms. You are directed to the cautionary statements regarding risks or uncertainties described in the Company’s filings with the Securities and Exchange Commission, including our most recent Transition Report on Form 10-K and other SEC filings made since the date of that 10-K report. Participants are cautioned not to place undue reliance on such forward-looking statements, which reflect management’s views only as of January 15, 2013. The Company undertakes no obligation to update or revise the forward-looking statements. 2 Safe Harbor |
|
|
3 An established brand targeting the baby boomer market with fashionable assortments that meet our customers’ needs for style, versatility and value 623 stores in two primary brand concepts: 379 Christopher & Banks stores – missy & petites 165 CJ Banks stores– size 14 & more We operate an additional 54 dual strategy stores and 25 outlet stores E-commerce sites for each brand Company Overview |

|
|
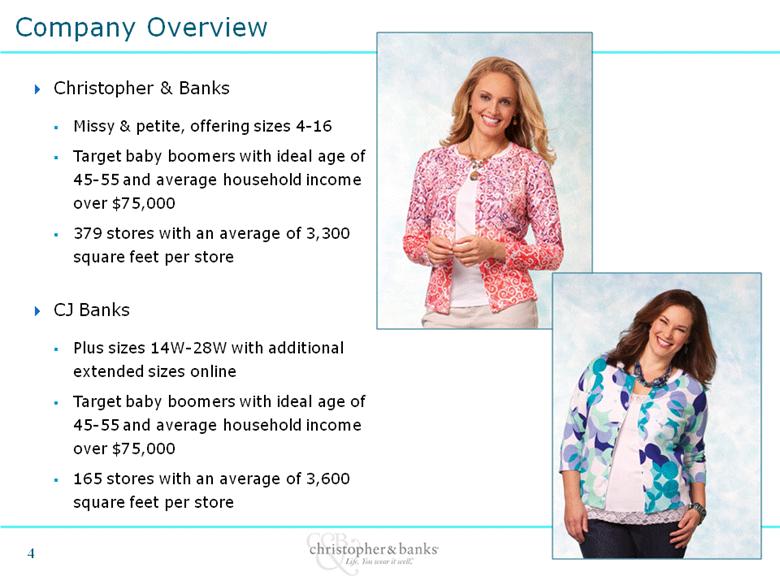
Christopher & Banks Missy & petite, offering sizes 4-16 Target baby boomers with ideal age of 45-55 and average household income over $75,000 379 stores with an average of 3,300 square feet per store CJ Banks Plus sizes 14W-28W with additional extended sizes online Target baby boomers with ideal age of 45-55 and average household income over $75,000 165 stores with an average of 3,600 square feet per store 4 Company Overview |
|
|
5 New senior management team and re-energized organization LuAnn Via, President and CEO, joined November 26th; a 30+ year retail executive veteran: President and CEO of Payless ShoeSource, Inc. Group Divisional President of Lane Bryant and Cacique President of Catherines Stores, Inc. Vice President, General Merchandise Manager of Sears Holding Company Senior Vice President, General Merchandise Manager of Product Development at Saks, Inc. Joel Waller, Consultant to Company, former CEO and President Peter Michielutti, named SVP and CFO in April; brings more than 20 years retail finance experience: CFO of Whitehall Jewelers CFO of Wilsons Leather CFO of Fingerhut Two Divisional General Merchandise Managers appointed December 2011 Restructured and simplified merchandising, production and sourcing teams New Senior Management |

|
|
6 Completed real estate and workforce restructuring Instituted merchandising and marketing strategies focused on sales and profitability improvement Improved inventory flow and instituted disciplined markdown strategy Re-energized staff with focus on testing and evaluating strategies, eliminating unnecessary processes and being fully engaged Enhanced liquidity and increased financial flexibility with a new $50 million line of credit Made Significant Progress in LTM |
|
|
7 Closed 103 underperforming stores as part of restructuring plan Closed an additional 43 stores in the ordinary course through the third quarter 30 store closures planned for the fourth fiscal quarter Store closures and rent reductions expected to yield approximately $12 to $14 million in annual occupancy cost savings for fiscal 2012 Implemented workforce reductions at corporate and the field leading to more than $5.0 million in cost savings beginning this fiscal year Restructuring Real Estate and Workforce Period Ended 2/28/09 2/27/10 2/26/11 1/28/12 11/29/12 2/2/13 E Christopher & Banks 548 540 517 402 386 383 CJ Banks 267 265 252 199 171 160 Dual Format 0 1 3 62 55 40 Outlet 0 0 3 23 25 25 Total Stores 815 806 775 686 637 608 Store Count |
|
|
8 Rebalanced assortment to offer the right mix of merchandise Reduced the number of styles and SKUs by 21% for fall 2012 as compared to the prior year Increased focus on key categories Rebalanced mix of good/better/best with greater emphasis on good and better Offered an improved price/value proposition for fall Provided more attractive opening price points Simplified pricing structure and reduced ticket prices on average by 20% Improved inventory flow beginning with the September assortment Decreased number of major floor sets to six annually while maintaining freshness with smaller deliveries Increased efficiencies in merchandise flow and made adjustments in the product development cycle to improve our speed to market Focused Merchandising and Marketing Strategies Improved Lifecycle Performance Bodes Well For Merchandise Margins |
|
|
9 Expanded Customer Relationship Management Program (CRM) Continued focus on Friendship Loyalty Program at 3.3 million total with 2.2 million active customers generating 84% of our sales - Friendship Reward Program customers shop more frequently; 2.6 times more than non-members spending $165 annually vs. non-member $42 Increased ROI through effective direct marketing efforts - Opportunity in the future for increased investment via mail frequency and depth in a variety of formats - Continued to integrate merchandise product and promotional messages into email communications Focused Merchandising and Marketing Strategies (cont’d) |

|
|
10 Continued to develop an enhanced promotional strategy Increased pre-planned category promotions and reduced store-wide events Refined store signage to drive traffic and provide clarity of offer Supplemented in-store offers with effective bounce-backs for repeat visits Grew private label credit card program which launched in April 2012 To date, cardholders represent 8% of active customers and 15% of overall sales since launch - $66 average transaction size, approximately 52% above the store average - 12% of cards issued are to new customers with average spend of $75 - 15% of cards issued are to customers who have not purchased in over 12 months Incent cardholders with offers such as accelerated points and cardholder events communicated via direct mail, email and store front Focused Merchandising and Marketing Strategies (cont’d) |
|
|
11 28-store test program launched July 1 provides platform to test strategies before expanding to additional stores Positive results seen thus far: Third quarter comparable store sales of 38% versus 13.7% overall Third quarter conversion higher by 400 bps Recent test phase includes: Table program with key item categories; increased depth of inventory levels Upgraded talent Instituted incentive bonus program Added 39 new test stores as of October 1 Plan to add an additional 20-30 new test stores at the beginning of the next fiscal year Pilot Store Test Program Focused on Retail Operations |
|
|
12 Unique customer niche largely ignored by others Multi-channel strategy with small market focus Strategic initiatives driving improved sales and merchandise margin performance Significant operating margin expansion opportunity Enhanced balance sheet with improved liquidity and flexibility Strengthened management team and Board of Directors Investment Highlights |
|
|
Financial Highlights |

|
|
14 Total comparable sales for third quarter up 13.7% Compared to a 5.5% increase in the second quarter and a 7.4% increase in last year’s third quarter Despite operating an average of 129 (17%) fewer stores, sales for the quarter grew 2.4% as compared to the same period last year Gross margin in the third quarter of 35.2% Compared to 27.7% for the second quarter of fiscal 2012 and 25.4% for last year’s third quarter Saw improvement in key metrics during the third quarter: Comparable store sales exceeded expectations driven by traffic and conversion Merchandise margin rate improved significantly on a sequential and year-over-year basis Improved inventory flow Improved Financial Performance |
|
|
Thirteen Weeks Ended October 27, 2012 Thirteen Weeks Ended October 29, 2011 Net Sales $117.3 $114.6 Merchandise, Buying & Occupancy 76.0 85.5 Selling, General & Administrative 32.9 37.3 Depreciation & Amortization 4.4 5.8 Operating Income (Loss) 3.6 (14.0) Net Income (Loss)* $3.6 ($13.7) Adjusted Net Income (Loss) $3.9 ($13.7) Diluted EPS $0.10 ($0.39 ) * Net income for the thirteen week period ended October 27, 2012 included a $333,000 after-tax, non-cash expense related to restructuring charges. Third Quarter Income Statement Summary 15 |
|
|
October 27, 2012 January 28, 2012 Cash and Investments $33.2 $61.7 Merchandise Inventories 58.2 39.5 Property and Equipment, net 45.0 56.4 Total Assets $145.0 $166.0 Long -Term Debt — — Stockholders’ Equity $78.8 $89.4 Balance Sheet Summary 16 |
|
|
17 Stabilized Balance Sheet and Improved Cash Flow Executed new senior $50 million credit facility in the second quarter Enhanced liquidity Greater capital flexibility with fewer covenants Plan to utilize for letters of credit for merchandise purchases Filed shelf registration for up to $75 million in equity in the second quarter Provides financial flexibility to raise capital in the future No current plans to utilize shelf Better inventory management driving improved cash flow Minimized capital expenditures Limiting new store openings Closing 30 stores during the fourth fiscal quarter Plan to reassess portfolio after reviewing second half performance and results of pilot tests |
|
|
18 Expect high teens increase in comparable store sales for 4Q Merchandise margins in 4Q expected to exceed those in the comparable period last year, but expected to be seasonally lower than 3Q similar to historical performance Expect 400 to 500 basis points of positive leverage of occupancy expense for the 14-weeks ended February 2, 2013 when compared to the comparable prior year period, based on store closings and rent restructuring Expect SG&A for 4Q, a 14-week period, to be in the range of $36 million to $37 million Expect to end the fiscal year with cash and cash equivalents between $37 million and $38 million Fiscal 2012 Outlook (53-week year, ending February 2, 2013) |