Attached files
Table of Contents
UNITED STATES
SECURITIES AND EXCHANGE COMMISSION
Washington, D.C. 20549
FORM 10-Q
(Mark One)
| x | QUARTERLY REPORT PURSUANT TO SECTION 13 OR 15(d) OF THE SECURITIES EXCHANGE ACT OF 1934 |
For the quarterly period ended November 30, 2012
OR
| ¨ | TRANSITION REPORT PURSUANT TO SECTION 13 OR 15(d) OF THE SECURITIES EXCHANGE ACT OF 1934 |
For the transition period from to
Commission File Number: 001-35566
STREAM EXCHANGE TRADED TRUST
STREAM S&P DYNAMIC ROLL GLOBAL COMMODITIES FUND
(A Series of STREAM Exchange Traded Trust)
(Exact name of Registrant as specified in its charter)
| Delaware | 27-6620981 45-3262464 | |
|
|
| |
| (State or Other Jurisdiction of Incorporation or Organization) | (I.R.S. Employer Identification No.) |
| c/o STREAM Exchange Traded Trust 787 Seventh Avenue New York, New York |
10019 | |
|
|
| |
| (Address of Principal Executive Offices) | (Zip Code) |
Registrant’s telephone number, including area code: (212) 841-2000
(Former Name, Former Address and Former Fiscal Year, if Changed Since Last Report)
Indicate by check mark whether the Registrant (1) has filed all reports required to be filed by Section 13 or 15(d) of the Securities Exchange Act of 1934 during the preceding 12 months (or for such shorter period that the Registrant was required to file such reports), and (2) has been subject to such filing requirements for the past 90 days. Yes x No ¨
Indicate by check mark whether the Registrant has submitted electronically and posted on its corporate Web site, if any, every Interactive Data File required to be submitted and posted pursuant to Rule 405 of Regulation S-T (§232.405 of this chapter) during the preceding 12 months (or for such shorter period that the Registrant was required to submit and post such files). Yes x No ¨
Indicate by check mark whether the registrant is a large accelerated filer, an accelerated filer, a non-accelerated filer, or a smaller reporting company. See definition of “accelerated filer,” “large accelerated filer,” and “smaller reporting company” in Rule 12b-2 of the Exchange Act. (Check one):
| Large accelerated filer | ¨ | Accelerated filer | ¨ | |||
| Non-accelerated filer | ¨ (Do not check if a smaller reporting company) | Smaller reporting company | x | |||
Indicate by check mark whether the registrant is a shell company (as defined in Rule 12b-2 of the Exchange Act). Yes ¨ No x
Indicate the number of outstanding Shares as of November 30, 2012: 648,000 Shares.
Table of Contents
STREAM EXCHANGE TRADED TRUST
STREAM S&P DYNAMIC ROLL GLOBAL COMMODITIES FUND
QUARTER ENDED NOVEMBER 30, 2012
i
Table of Contents
STREAM S&P Dynamic Roll Global Commodities Fund
Statement of Financial Condition
| November 30, 2012 |
August 31, 2012 |
|||||||
| (unaudited) | ||||||||
| Assets |
||||||||
| Equity in broker trading accounts: |
||||||||
| Collateral, due from broker |
$ | 1,032,661 | $ | 402,501 | ||||
| Net unrealized appreciation (depreciation) on futures contracts |
359,977 | 1,339,462 | ||||||
|
|
|
|
|
|||||
| 1,392,638 | 1,741,963 | |||||||
| Cash |
208,712 | 132,989 | ||||||
| U.S. treasury obligations (cost $16,696,995 and $15,597,188 as of November 30, 2012 and August 31, 2012, respectively) |
16,697,513 | 15,597,203 | ||||||
| Due from managing owner |
— | 58,494 | ||||||
| Other assets |
833 | 3,326 | ||||||
|
|
|
|
|
|||||
| Total assets |
$ | 18,299,696 | $ | 17,533,975 | ||||
|
|
|
|
|
|||||
| Liabilities and shareholders’ equity |
||||||||
| Other liabilities |
226,458 | 193,837 | ||||||
| Due to managing owner |
87,857 | — | ||||||
|
|
|
|
|
|||||
| Total liabilities |
314,315 | 193,837 | ||||||
|
|
|
|
|
|||||
| Shareholders’ equity |
||||||||
| Paid in capital—644,000 and 604,000 redeemable shares issued and outstanding as of November 30, 2012 and August 31, 2012, respectively |
16,216,104 | 15,100,000 | ||||||
| Accumulated earnings |
1,769,277 | 2,240,138 | ||||||
|
|
|
|
|
|||||
| Total shareholders’ equity |
17,985,381 | 17,340,138 | ||||||
|
|
|
|
|
|||||
| Total liabilities and shareholders’ equity |
$ | 18,299,696 | $ | 17,533,975 | ||||
|
|
|
|
|
|||||
| Net asset value per share |
$ | 27.93 | $ | 28.71 | ||||
See accompanying notes to financial statements
1
Table of Contents
STREAM S&P Dynamic Roll Global Commodities Fund
Schedule of Investments (unaudited)
November 30, 2012
| Description |
Percentage of Net Assets |
Fair Value |
Face Value |
|||||||||
| U.S. Treasury Obligations |
||||||||||||
| U.S. Treasury Bill, 0.09% due January 10, 2013 |
5.01 | % | $ | 899,964 | $ | 900,000 | ||||||
| U.S. Treasury Bill, 0.10% due February 14, 2013 |
2.22 | 399,951 | 400,000 | |||||||||
| U.S. Treasury Bill, 0.08% due February 21, 2013 |
85.61 | 15,397,598 | 15,400,000 | |||||||||
|
|
|
|
|
|
|
|||||||
| Total U.S. Treasury Obligations (cost $16,696,995) |
92.84 | % | $ | 16,697,513 | $ | 16,700,000 | ||||||
|
|
|
|
|
|
|
|||||||
| Description |
Percentage of Net Assets |
Fair Value |
Notional Value |
|||||||||
| Unrealized Appreciation/(Depreciation) on Futures Contracts |
||||||||||||
| Brent Crude Oil (30 contracts, settlement date January 2013) |
.56 | % | $ | 101,260 | $ | 3,307,500 | ||||||
| Cattle Feeder (1 contract, settlement date January 2013) |
(.01 | ) | (2,575 | ) | 72,812 | |||||||
| Cocoa (2 contracts, settlement date March 2013) |
— | (1) | 710 | 49,960 | ||||||||
| Coffee (2 contracts, settlement date May 2013) |
(.02 | ) | (3,712 | ) | 115,125 | |||||||
| Copper (3 contracts, settlement date December 2014) |
.22 | 40,544 | 602,475 | |||||||||
| Corn (26 contracts, settlement date December 2013) |
(.06 | ) | (11,613 | ) | 826,150 | |||||||
| Cotton (5 contracts, settlement date March 2013) |
.04 | 6,480 | 184,775 | |||||||||
| Gas Oil (16 contracts, settlement date March 2013) |
.06 | 10,825 | 1,517,600 | |||||||||
| Gasoline (8 contracts, settlement date December 2012) |
.19 | 34,066 | 917,381 | |||||||||
| Gold (3 contracts, settlement date June 2013) |
(.02 | ) | (4,060 | ) | 515,070 | |||||||
| Heating Oil (7 contracts, settlement date March 2013) |
(.15 | ) | (27,237 | ) | 892,966 | |||||||
| Lean Hogs (8 contracts, settlement date April 2013) |
.01 | 2,700 | 293,680 | |||||||||
| Light, Sweet Crude Oil (59 contracts, settlement date November 2015) |
.29 | 51,770 | 5,212,060 | |||||||||
| Live Cattle (10 contracts, settlement date February 2013) |
.02 | 4,240 | 521,600 | |||||||||
| Natural Gas (13 contracts, settlement date February 2013) |
.04 | 7,600 | 464,490 | |||||||||
| Primary Aluminum (8 contracts, settlement date January 2013) |
.17 | 30,325 | 416,650 | |||||||||
| Primary Nickel (1 contract, settlement date March 2013) |
(.01 | ) | (1,848 | ) | 106,008 | |||||||
| Refined Pig Lead (1 contract, settlement date January 2013) |
.01 | 2,350 | 56,250 | |||||||||
| Silver (1 contract, settlement date December 2013) |
.14 | 25,645 | 167,260 | |||||||||
| Soybean (7 contracts, settlement date November 2013) |
(.06 | ) | (10,313 | ) | 456,575 | |||||||
| Sugar (13 contracts, settlement date June 2013) |
(.09 | ) | (15,781 | ) | 282,610 | |||||||
| Wheat (CBT) (16 contracts, settlement date July 2013) |
.65 | 116,413 | 696,400 | |||||||||
| Wheat (KCB) (4 contracts, settlement date July 2013) |
.01 | 1,050 | 184,400 | |||||||||
| Zinc (2 contracts, settlement date April 2013) |
.01 | 1,138 | 103,075 | |||||||||
|
|
|
|
|
|
|
|||||||
| Net Unrealized Appreciation/(Depreciation) on Futures Contracts |
2.00 | % | $ | 359,977 | $ | 17,962,872 | ||||||
|
|
|
|
|
|
|
|||||||
| (1) | Less than .005% |
See accompanying notes to financial statements
2
Table of Contents
STREAM S&P Dynamic Roll Global Commodities Fund
August 31, 2012
| Description |
Percentage of Net Assets |
Fair Value |
Face Value |
|||||||||
| U.S. Treasury Obligations |
||||||||||||
| U.S. Treasury Bill, 0.08% due October 11, 2012 |
2.88 | % | $ | 499,960 | $ | 500,000 | ||||||
| U.S. Treasury Bill, 0.08% due October 18, 2012 |
3.46 | 599,945 | 600,000 | |||||||||
| U.S. Treasury Bill, 0.10% due November 15, 2012 |
5.77 | 999,850 | 1,000,000 | |||||||||
| U.S. Treasury Bill, 0.08% due November 23, 2012 |
77.84 | 13,497,448 | 13,500,000 | |||||||||
|
|
|
|
|
|
|
|||||||
| Total U.S. Treasury Obligations (cost $15,597,188) |
89.95 | % | $ | 15,597,203 | $ | 15,600,000 | ||||||
|
|
|
|
|
|
|
|||||||
| Description |
Percentage of Net Assets |
Fair Value |
Notional Value |
|||||||||
| Unrealized Appreciation/(Depreciation) on Futures Contracts |
||||||||||||
| Brent Crude Oil (28 contracts, settlement date October 2012) |
.61 | % | $ | 105,200 | $ | 3,193,400 | ||||||
| Cattle Feeder (1 contract, settlement date October 2012) |
(.01 | ) | (1,563 | ) | 73,338 | |||||||
| Cocoa (2 contracts, settlement date March 2013) |
.02 | 3,090 | 52,340 | |||||||||
| Coffee (2 contracts, settlement date December 2012) |
(.03 | ) | (5,044 | ) | 123,563 | |||||||
| Copper (3 contracts, settlement date December 2014) |
.04 | 7,731 | 569,662 | |||||||||
| Corn (24 contracts, settlement date December 2013) |
.03 | 5,813 | 780,000 | |||||||||
| Cotton (4 contracts, settlement date December 2012) |
.11 | 19,340 | 154,520 | |||||||||
| Gas Oil (14 contracts, settlement date March 2013) |
.24 | 41,100 | 1,355,550 | |||||||||
| Gasoline (7 contracts, settlement date September 2012) |
.98 | 169,357 | 874,003 | |||||||||
| Gold (3 contracts, settlement date April 2013) |
.11 | 18,420 | 507,540 | |||||||||
| Heating Oil (7 contracts, settlement date February 2013) |
.64 | 111,535 | 920,102 | |||||||||
| Lean Hogs (7 contracts, settlement date October 2012) |
(.14 | ) | (24,570 | ) | 207,690 | |||||||
| Light, Sweet Crude Oil (55 contracts, settlement date November 2013) |
3.37 | 584,570 | 5,303,100 | |||||||||
| Live Cattle (9 contracts, settlement date December 2012) |
.05 | 9,420 | 463,140 | |||||||||
| Natural Gas (12 contracts, settlement date February 2013) |
(.10 | ) | (16,740 | ) | 403,680 | |||||||
| Primary Aluminum (7 contracts, settlement date January 2013) |
— | (1) | (94 | ) | 334,906 | |||||||
| Primary Nickel (1 contract, settlement date October 2012) |
(.01 | ) | (1,200 | ) | 95,580 | |||||||
| Refined Pig Lead (1 contract, settlement date December 2012) |
.01 | 1,100 | 49,188 | |||||||||
| Silver (1 contract, settlement date December 2013) |
.10 | 16,510 | 158,125 | |||||||||
| Soybean (6 contracts, settlement date November 2012) |
.86 | 149,775 | 526,950 | |||||||||
| Sugar (12 contracts, settlement date September 2013) |
(.02 | ) | (3,651 | ) | 279,418 | |||||||
| Wheat (CBT) (15 contracts, settlement date July 2013) |
.62 | 107,588 | 643,312 | |||||||||
| Wheat (KCB) (4 contracts, settlement date December 2012) |
.25 | 42,975 | 181,200 | |||||||||
| Zinc (1 contract, settlement date December 2012) |
(.01 | ) | (1,200 | ) | 46,125 | |||||||
|
|
|
|
|
|
|
|||||||
| Net Unrealized Appreciation/(Depreciation) on Futures Contracts |
7.72 | % | $ | 1,339,462 | $ | 17,296,432 | ||||||
|
|
|
|
|
|
|
|||||||
| (1) | Greater than (.005)% |
See accompanying notes to financial statements
3
Table of Contents
STREAM S&P Dynamic Roll Global Commodities Fund
Statement of Operations (unaudited)
For the Three Months Ended November 30, 2012
| Income |
||||
| Interest income |
$ | 3,509 | ||
|
|
|
|||
| Expenses |
||||
| Management fees |
27,509 | |||
| Professional fees |
63,003 | |||
| Broker commissions and fees |
1,818 | |||
| Other expenses |
7,112 | |||
|
|
|
|||
| Total expenses |
99,442 | |||
| Expense reimbursement from managing owner |
(63,766 | ) | ||
|
|
|
|||
| Net Expenses |
35,676 | |||
|
|
|
|||
| Net Investment Loss |
(32,167 | ) | ||
|
|
|
|||
| Realized and Net Change in Unrealized Gain (Loss) on U.S. Treasury Obligations and Futures Contracts |
||||
| Realized Gain (Loss) on |
||||
| U.S. treasury obligations |
(4 | ) | ||
| Futures contracts |
540,292 | |||
|
|
|
|||
| Net Realized Gain |
540,288 | |||
| Net Change in Unrealized Gain (Loss) on |
||||
| U.S. treasury obligations |
503 | |||
| Futures contracts |
(979,485 | ) | ||
|
|
|
|||
| Net Change in Unrealized Loss |
(978,982 | ) | ||
|
|
|
|||
| Net Realized and Net Change in Unrealized Loss on U.S. Treasury Obligations and Futures Contracts |
(438,694 | ) | ||
|
|
|
|||
| Net Loss |
$ | (470,861 | ) | |
|
|
|
|||
See accompanying notes to financial statements
4
Table of Contents
STREAM S&P Dynamic Roll Global Commodities Fund
Statement of Changes in Shareholders’ Equity (unaudited)
For the Three Months Ended November 30, 2012
| Shares | Paid in Capital |
Accumulated Earnings (Deficit) |
Total Shareholders’ Equity |
|||||||||||||
| Balance at August 31, 2012 |
604,000 | $ | 15,100,000 | $ | 2,240,138 | $ | 17,340,138 | |||||||||
| Creation of shares |
40,000 | 1,116,104 | — | 1,116,104 | ||||||||||||
| Net loss: |
||||||||||||||||
| Net investment loss |
— | — | (32,167 | ) | (32,167 | ) | ||||||||||
| Net realized gain on U.S. treasury obligations and futures contracts |
— | — | 540,288 | 540,288 | ||||||||||||
| Net change in unrealized loss on U.S. treasury obligations and futures contracts |
— | — | (978,982 | ) | (978,982 | ) | ||||||||||
|
|
|
|
|
|
|
|
|
|||||||||
| Net loss |
— | — | (470,861 | ) | (470,861 | ) | ||||||||||
|
|
|
|
|
|
|
|
|
|||||||||
| Balance at November 30, 2012 |
644,000 | $ | 16,216,104 | $ | 1,769,277 | $ | 17,985,381 | |||||||||
|
|
|
|
|
|
|
|
|
|||||||||
See accompanying notes to financial statements
5
Table of Contents
STREAM S&P Dynamic Roll Global Commodities Fund
Statement of Cash Flows (unaudited)
For the Three Months Ended November 30, 2012
| Cash flow from operating activities: |
||||
| Net Loss |
$ | (470,861 | ) | |
| Adjustments to reconcile net income (loss) to net cash used for operating activities: |
||||
| Purchases of U.S. treasury obligations |
(17,296,512 | ) | ||
| Maturities/Sales of U.S. treasury obligations |
16,199,939 | |||
| Net accretion of discount |
(3,238 | ) | ||
| Net realized gain on U.S. treasury obligations |
4 | |||
| Net change in unrealized depreciation (appreciation) on U.S. treasury obligations and futures contracts |
978,982 | |||
| Increase in collateral, due from broker |
(630,160 | ) | ||
| Decrease in other assets |
2,493 | |||
| Decrease in due from managing owner |
58,494 | |||
| Increase in due to managing owner |
87,857 | |||
| Increase in other liabilities |
32,621 | |||
|
|
|
|||
| Net cash provided by (used for) operating activities |
(1,040,381 | ) | ||
| Cash flows from financing activities: |
||||
| Proceeds from creation of shares |
1,116,104 | |||
|
|
|
|||
| Net cash provided by financing activities |
1,116,104 | |||
| Net change in cash |
75,723 | |||
| Cash held at beginning of period |
132,989 | |||
|
|
|
|||
| Cash held at end of period |
$ | 208,712 | ||
|
|
|
|||
See accompanying notes to financial statements
6
Table of Contents
STREAM Enhanced Volatility Fund
Statement of Financial Condition
November 30, 2012
| November 30, 2012 |
August 31, 2012 |
|||||||
| (unaudited) | ||||||||
| Assets |
||||||||
| Cash |
$ | 100,000 | $ | 100,000 | ||||
|
|
|
|
|
|||||
| Total assets |
$ | 100,000 | $ | 100,000 | ||||
|
|
|
|
|
|||||
| Liabilities and shareholders’ equity |
||||||||
| Shareholders’ equity—4,000 redeemable shares issued and outstanding |
$ | 100,000 | $ | 100,000 | ||||
|
|
|
|
|
|||||
| Total shareholders’ equity |
$ | 100,000 | $ | 100,000 | ||||
|
|
|
|
|
|||||
| Total liabilities and shareholders’ equity |
$ | 100,000 | $ | 100,000 | ||||
|
|
|
|
|
|||||
| Net asset value per share |
$ | 25.00 | $ | 25.00 | ||||
See accompanying notes to financial statements
7
Table of Contents
STREAM Exchange Traded Trust
Combined Statement of Financial Condition
November 30, 2012
| November 30, 2012 |
August 31, 2012 |
|||||||
| (unaudited) | ||||||||
| Assets |
||||||||
| Equity in broker trading accounts: |
||||||||
| Collateral, due from broker |
$ | 1,032,661 | $ | 402,501 | ||||
| Net unrealized appreciation (depreciation) on futures contracts |
359,977 | 1,339,462 | ||||||
|
|
|
|
|
|||||
| 1,392,638 | 1,741,963 | |||||||
| Cash |
308,712 | 232,989 | ||||||
| U.S. treasury obligations (cost $16,696,995 and $15,597,188 as of November 30, 2012 and August 31, 2012, respectively) |
16,697,513 | 15,597,203 | ||||||
| Due from managing owner |
— | 58,494 | ||||||
| Other assets |
833 | 3,326 | ||||||
|
|
|
|
|
|||||
| Total assets |
$ | 18,399,696 | $ | 17,633,975 | ||||
|
|
|
|
|
|||||
| Liabilities and shareholders’ equity |
||||||||
| Other liabilities |
226,458 | 193,837 | ||||||
| Due to managing owner |
87,857 | — | ||||||
|
|
|
|
|
|||||
| Total liabilities |
314,315 | 193,837 | ||||||
|
|
|
|
|
|||||
| Shareholders’ equity |
||||||||
| Paid in capital—644,000 and 604,000 redeemable shares issued and outstanding as of November 30, 2012 and August 31, 2012, respectively |
16,316,104 | 15,200,000 | ||||||
| Accumulated earnings |
1,769,277 | 2,240,138 | ||||||
|
|
|
|
|
|||||
| Total shareholders’ equity |
18,085,381 | 17,440,138 | ||||||
|
|
|
|
|
|||||
| Total liabilities and shareholders’ equity |
$ | 18,399,696 | $ | 17,633,975 | ||||
|
|
|
|
|
|||||
| Shares Outstanding: |
||||||||
| STREAM Enhanced Volatility Fund Series |
4,000 | 4,000 | ||||||
| STREAM S&P Dynamic Roll Global Commodities Fund Series |
644,000 | 604,000 | ||||||
See accompanying notes to financial statements
8
Table of Contents
STREAM Exchange Traded Trust
Combined Statement of Operations (unaudited)
For the Three Months Ended November 30, 2012
| Income |
||||
| Interest income |
$ | 3,509 | ||
|
|
|
|||
| Expenses |
||||
| Management fees |
27,509 | |||
| Professional fees |
63,003 | |||
| Broker commissions and fees |
1,818 | |||
| Other expenses |
7,112 | |||
|
|
|
|||
| Total expenses |
99,442 | |||
| Expense reimbursement from managing owner |
(63,766 | ) | ||
|
|
|
|||
| Net Expenses |
35,676 | |||
|
|
|
|||
| Net Investment Loss |
(32,167 | ) | ||
|
|
|
|||
| Realized and Net Change in Unrealized Gain (Loss) on U.S. Treasury Obligations and Futures Contracts |
||||
| Realized Gain (Loss) on |
||||
| U.S. treasury obligations |
(4 | ) | ||
| Futures contracts |
540,292 | |||
|
|
|
|||
| Net Realized Gain |
540,288 | |||
|
|
|
|||
| Net Change in Unrealized Gain (Loss) on |
||||
| U.S. treasury obligations |
503 | |||
| Futures contracts |
(979,485 | ) | ||
|
|
|
|||
| Net Change in Unrealized Loss |
(978,982 | ) | ||
|
|
|
|||
| Net Realized and Net Change in Unrealized Loss on U.S. Treasury Obligations and Futures Contracts |
(438,694 | ) | ||
|
|
|
|||
| Net Loss |
$ | (470,861 | ) | |
|
|
|
|||
See accompanying notes to financial statements
9
Table of Contents
STREAM Exchange Traded Trust
Combined Statement of Changes in Shareholders’ Equity (unaudited)
For The Three Months Ended November 30, 2012
| Shares | Paid in Capital |
Accumulated Earnings (Deficit) |
Total Shareholders’ Equity |
|||||||||||||
| Balance at August 31, 2012 |
608,000 | $ | 15,200,000 | $ | 2,240,138 | $ | 17,440,138 | |||||||||
| Creation of shares |
40,000 | 1,116,104 | — | 1,116,104 | ||||||||||||
| Net loss: |
||||||||||||||||
| Net investment loss |
— | — | (32,167 | ) | (32,167 | ) | ||||||||||
| Net realized gain on U.S. treasury obligations and futures contracts |
— | — | 540,288 | 540,288 | ||||||||||||
| Net change in unrealized loss on U.S. treasury obligations and futures contracts |
— | — | (978,982 | ) | (978,982 | ) | ||||||||||
|
|
|
|
|
|
|
|
|
|||||||||
| Net loss |
— | — | (470,861 | ) | (470,861 | ) | ||||||||||
|
|
|
|
|
|
|
|
|
|||||||||
| Balance at November 30, 2012 |
648,000 | $ | 16,316,104 | $ | 1,769,277 | $ | 18,085,381 | |||||||||
|
|
|
|
|
|
|
|
|
|||||||||
See accompanying notes to financial statements
10
Table of Contents
STREAM Exchange Traded Trust
Statement of Cash Flows (unaudited)
For the Three Months Ended November 30, 2012
| Cash flow from operating activities: |
||||
| Net Loss |
$ | (470,861 | ) | |
| Adjustments to reconcile net income (loss) to net cash used for operating activities: |
||||
| Purchases of U.S. treasury obligations |
(17,296,512 | ) | ||
| Maturities/Sales of U.S. treasury obligations |
16,199,939 | |||
| Net accretion of discount |
(3,238 | ) | ||
| Net realized gain on U.S. treasury obligations |
4 | |||
| Net change in unrealized depreciation (appreciation) on U.S. treasury obligations and futures contracts |
978,982 | |||
| Increase in collateral, due from broker |
(630,160 | ) | ||
| Decrease in other assets |
2,493 | |||
| Decrease in due from managing owner |
58,494 | |||
| Increase in due to managing owner |
87,857 | |||
| Increase in other liabilities |
32,621 | |||
|
|
|
|||
| Net cash provided by (used for) operating activities |
(1,040,381 | ) | ||
| Cash flows from financing activities: |
||||
| Proceeds from creation of shares |
1,116,104 | |||
|
|
|
|||
| Net cash provided by financing activities |
1,116,104 | |||
| Net change in cash |
75,723 | |||
| Cash held at beginning of period |
232,989 | |||
|
|
|
|||
| Cash held at end of period |
$ | 308,712 | ||
|
|
|
|||
See accompanying notes to financial statements
11
Table of Contents
STREAM Exchange Traded Trust
Notes to Financial Statements (unaudited)
November 30, 2012
Note 1 – Organization and Operation
STREAM Exchange Traded Trust (the “Trust” or “SETT”) was formed as a Delaware statutory trust on April 30, 2010. The initial Certificate of Trust was in the name of WisdomTree-BNP Paribas L/S Commodities Trust and was subsequently changed to BNP Paribas L/S Commodities Trust on November 3, 2010, to BNP Paribas Exchange Traded Trust on May 13, 2011, and then to the abovementioned STREAM Exchange Traded Trust on April 5, 2012. On May 13, 2011, the Trust was also amended to become a series trust.
The Trust currently consists of two series, STREAM S&P Dynamic Roll Global Commodities Fund (“SDRG”) and STREAM Enhanced Volatility Fund (“SEVF” and together with the SDRG, the “Funds”). SDRG currently issues and SEVF plans to issue common units of beneficial interest (the “Shares”) which represent units of fractional undivided beneficial interest in and ownership of each Fund. Neither the Trust nor SDRG had operations prior to June 1, 2012, other than the matters relating to their formations. Both SDRG and SEVF were initially funded with $100,000 of equity contributions from BNP Paribas Securities Corp (“BNPPSC”), acting as agent for BNP Paribas Arbitrage SNC (“Arbitrage”) which is a related party, in exchange for 4,000 Shares of each fund on September 22, 2011.
SDRG issues Shares representing fractional undivided beneficial interests in SDRG. SDRG continuously offers Creation Baskets consisting of 40,000 Shares at their Net Asset Value (“NAV”) to “Authorized Participants” through ALPS Distributors, Inc., which is the distributor for SDRG (the “Marketing Agent”). Authorized Participants sell such Shares, which are listed on the New York Stock Exchange (“NYSE”) Arca under the symbol “BNPC,” to the public at per-Share offering prices that reflect, among other factors, the trading price of the Shares on the NYSE Arca, the NAV of SDRG at the time the Authorized Participant purchased the Creation Baskets and the NAV at the time of the offer of the Shares to the public, the supply of and demand for Shares at the time of sale, and the liquidity of the markets. SDRG’s Shares trade in the secondary market on the NYSE Arca at prices that are lower or higher than their NAV per Share.
SDRG invests in exchange-traded futures on the commodities comprising the S&P GSCI Dynamic Roll Excess Return Index (the “Index”) with a view to tracking changes in the level of the Index, whether positive or negative, over time. The Index aims to reflect the return of an investment in a world production-weighted portfolio comprised of the principal physical commodities that are the subject of active, liquid futures markets.
SDRG is a commodity pool and commenced investment operations on June 1, 2012 and has a fiscal year ending on August 31 of each year. SEVF has not yet commenced investment operations. SDRG’s managing owner is BNP Paribas Quantitative Strategies, LLC (the “Managing Owner”). The Managing Owner is responsible for the management of SDRG. The Managing Owner is a member of the National Futures Association (the “NFA”) and became a commodity pool operator and commodity trading advisor registered with the Commodity Futures Trading Commission (the “CFTC”) effective August 19, 2011 and June 11, 2012, respectively.
On June 1, 2012, SDRG’s initial registration of 25,000,000 Shares on Form S-1 was declared effective by the U.S. Securities and Exchange Commission (“SEC”). SDRG also commenced investment operations on June 1, 2012 by purchasing Index commodity futures on the exchanges which they are traded. On June 4, 2012, SDRG issued 600,000 Shares to Arbitrage in exchange for $15,000,000 at SDRG’s initial NAV of $25 per share. On June 6, 2012, SDRG listed its Shares on the NYSE Arca under the ticker symbol “BNPC.”
At November 30, 2012, Arbitrage continued to be a majority shareholder and owned approximately 98% of the outstanding Shares of SRDG. If it decided to redeem, it would substantially impact SDRG’s ability to operate.
12
Table of Contents
Note 2 – Summary of Significant Accounting Policies
Basis of Presentation
Pursuant to rules and regulations of the U.S. Securities and Exchange Commission (“SEC”), financial statements are presented for the Trust as a whole, as the SEC registrant, and for each Fund individually. The debts, liabilities, obligations and expenses incurred, contracted for or otherwise existing with respect to a particular Fund shall be enforceable only against the assets of each Fund and not against the assets of the Trust generally or any other Fund. Accordingly, the assets of one Fund of the Trust include only those funds and other assets that are paid to, held by or distributed to the Trust for the purchases of Shares in that Fund.
In our opinion, all adjustments, consisting solely of normal recurring adjustments, necessary in order to make the interim financial statements not misleading have been included.
Use of Estimates
The preparation of financial statements in conformity with accounting principles accepted in the United States of America (“U.S. GAAP”) requires management to make estimates and assumptions that affect the reported amount of assets and liabilities and disclosure of contingent assets and liabilities at the date of the financial statements, and the reported amounts of the revenue and expenses during the reporting period. Actual results could differ from those estimates and such differences could be material.
Revenue Recognition
Commodity futures contracts are recorded on the trade date. All such transactions are recorded on the identified cost basis and marked to market daily. Unrealized appreciation or depreciation on commodity futures contracts are reflected in the Statement of Financial Condition as the difference between the original contract amount and the fair market value as of the last business day of the year or as of the last date of the financial statements. Changes in the appreciation or depreciation between periods are reflected in the Statement of Operations. Interest is earned on cash equivalents and deposits with the Futures Commission Merchants (“FCM”), BNP Paribas Prime Brokerage, Inc., a Delaware corporation (“PBI”) and BNP Paribas Commodity Futures Ltd. (“CFL”). Both PBI and CFL are affiliates of the Trust. SDRG earns interest on its assets denominated in U.S. dollars on deposit with the FCMs at a prevailing market rate. In addition, SDRG earns interest on funds held at the custodian, The Bank of New York Mellon (see Note 3), at prevailing market rates for such investments.
Interest income is recognized on an accrual basis when earned. Premiums and discounts are amortized or accreted over the life of the U.S. treasury obligations.
Brokerage Commissions
Brokerage commissions on commodity futures contracts are accrued as incurred.
Income Taxes
For tax purposes, SDRG will be treated as a partnership with a December 31 tax year. SDRG does not record a provision for income taxes because the partners report their share of SDRG’s income or loss on their income tax returns. The financial statements reflect SDRG’s transactions without adjustment, if any, required for income tax purposes.
In accordance with applicable accounting guidance, SDRG is required to determine whether a tax position is more likely than not to be sustained upon examination by the applicable taxing authority, including resolution of any related appeals or litigation processes, based on the technical merits of the position. SDRG files an income tax return in the U.S. federal jurisdiction, and may file income tax returns in various U.S. states and foreign jurisdictions. SDRG is subject to income tax examinations by major taxing authorities for all tax years since inception, although SDRG has not yet made any tax filings. The tax benefit recognized is measured as the largest amount of benefit that has a greater than fifty percent likelihood of being realized upon ultimate settlement. De-recognition of a tax benefit previously recognized results in SDRG recording a tax liability that reduces net assets. Based on its analysis, SDRG has determined that it has not incurred any liability for unrecognized tax benefits as of the date of these financial statements. However, SDRG’s conclusions regarding this policy may be subject to review and adjustment at a later date based on factors including, but not limited to, on-going analysis of and changes to tax laws, regulations, and interpretations thereof.
SDRG recognizes interest accrued related to unrecognized tax benefits and penalties related to unrecognized tax benefits in income tax fees payable, if assessed. No interest expense or penalties have been recognized as of the date of these financial statements.
13
Table of Contents
SDRG may be subject to potential examination by U.S. federal, U.S. state, or foreign jurisdictional authorities in the area of income taxes. These potential examinations may include questioning the timing and amount of deductions, the nexus of income among various tax jurisdictions, and compliance with U.S. federal, U.S. state and foreign tax laws. SDRG’s management does not expect that the total amount, if any, of unrecognized tax benefits will become material over the next twelve months.
Creations and Redemptions
Authorized Participants may purchase Creation Baskets consisting of 40,000 Shares from SDRG. The amount of the proceeds required to purchase a Creation Basket will be equal to the net asset value of the Shares in the Creation Basket determined as of 4:00 p.m. New York time on the day the order to create the basket is properly received.
Authorized Participants may redeem Shares from SDRG only in blocks of 40,000 Shares called “Redemption Baskets.” The amount of the redemption proceeds for a Redemption Basket will be equal to the net asset value of the Shares in the Redemption Basket determined as of 4:00 p.m. New York time on the day the order to redeem the basket is properly received.
SDRG receives or pays the proceeds from Shares sold or redeemed on the business day after the trade date of the purchase or redemption. The amounts due from Authorized Participants are reflected in SDRG’s Statement of Financial Condition as receivable for Shares sold. Amounts payable to Authorized Participants upon redemption are reflected in SDRG’s Statement of Financial Condition as payable for Shares redeemed.
Cash Equivalents
Cash equivalents are highly-liquid investments with original maturity dates of three months or less at inception. SDRG reported its cash equivalents in the Statement of Financial Condition at market value, or at carrying amounts that approximate fair value, because of their highly-liquid nature and short-term maturities. SDRG has a substantial portion of its assets on deposit with banks. Assets deposited with a bank may, at times, exceed federally insured limits. SDRG held $16,697,513 and $15,597,203 in United States Treasury Bills with a maturity date of three months or less at November 30, 2012 and August 31, 2012 respectively.
Collateral, Due from/to Broker
Margin is the minimum amount of funds that must be deposited by a commodity interest trader with the trader’s broker to initiate and maintain an open position in futures contracts. A margin deposit acts to assure the trader’s performance of the futures contracts purchased or sold. Futures contracts are customarily bought and sold on initial margin that represents a very small percentage (ranging upward from less than 2%) of the aggregate purchase or sales price of the contract. Because of such low margin requirements, price fluctuations occurring in the futures markets may create profits and losses that, in relation to the amount invested, are greater than are customary in other forms of investment or speculation. As discussed below, adverse price changes in the futures contract may result in margin requirements that greatly exceed the initial margin. In addition, the amount of margin required in connection with a particular futures contract is set from time to time by the exchange on which the contract is traded and may be modified from time to time by the exchange during the term of the contract. Brokerage firms, such as SDRG’s clearing brokers, carrying accounts for traders in commodity interest contracts generally require higher amounts of margin as a matter of policy to further protect themselves. Over-the-counter trading generally involves the extension of credit between counterparties, so the counterparties may agree to require the posting of collateral by one or both parties to address credit exposure.
Ongoing or “maintenance” margin requirements are computed each day by a trader’s clearing broker. When the market value of a particular open futures contract changes to a point where the margin on deposit does not satisfy maintenance margin requirements, a margin call is made by the broker. If the margin call is not met within the required time, the broker may close out the trader’s position. With respect to SDRG’s trading, SDRG (and not its shareholders personally) is subject to margin calls.
14
Table of Contents
Calculation of Net Asset Value
SDRG’s NAV is calculated by taking the current market value of its total assets and subtracting any liabilities. The administrator, the Bank of New York Mellon, calculates the NAV once each trading day. The NAV is calculated as of the close of the NYSE Arca Core Trading Session, or the last to close of the Futures Exchanges on which SDRG’s Designated Contracts or Substitute Contracts (which are listed on futures exchanges other than the Futures Exchanges) are traded, whichever is later. The NAV for a particular trading day is released after 4:15 p.m. New York time.
Management Fee and Allocation of Expenses
The Managing Owner is responsible for investing the assets of SDRG in accordance with the objectives and policies of SDRG. In addition, the Managing Owner arranges for one or more third parties to provide administrative, custodial, accounting, transfer agency and other necessary services to SDRG. For these services, SDRG is contractually obligated to pay a monthly management fee to the Managing Owner, based on average daily net assets, at a rate equal to 0.65% per annum. For the three months ended November 30, 2012, SDRG recorded $27,509 in management fees to the Managing Owner. SDRG pays for all brokerage fees, taxes and other expenses, including licensing fees for the use of intellectual property, registration or other fees paid to the SEC, the Financial Industry Regulatory Authority (“FINRA”), or any other regulatory agency in connection with the offer and sale of subsequent Shares after its initial registration and all legal, accounting, printing and other expenses associated therewith. SDRG also pays the fees and expenses associated with SDRG’s tax accounting and reporting requirements. Certain aggregate expenses common to all funds managed by the Managing Owner are allocated to each fund based on activity drivers deemed most appropriate by the Managing Owner for such expenses. All asset-based fees and expenses are calculated on prior day’s net assets.
The Managing Owner has agreed to reimburse SDRG the amount of routine operational, administrative and other ordinary fees and expenses (excluding those legal and accounting fees and expenses, filing fees, printing, mailing and duplication costs associated with the continuous offering of the Shares) in excess of 0.15% per annum of SDRG’s NAV. For the three months ended November 30, 2012, SDRG recorded $63,766 in such reimbursements from the Managing Owner.
Fair Value – Definition and Hierarchy
In accordance with U.S. GAAP, fair value is defined as the price that would be received to sell an asset or paid to transfer a liability (i.e., the “exit price”) in an orderly transaction between market participants at the measurement date.
In determining fair value, SDRG uses various valuation approaches. In accordance with U.S. GAAP, a fair value hierarchy for inputs is used in measuring fair value that maximizes the use of observable inputs and minimizes the use of unobservable inputs by requiring that the most observable inputs be used when available. Observable inputs are those that market participants would use in pricing the asset or liability based on market data obtained from sources independent of SDRG. Unobservable inputs reflect SDRG’s assumptions about the inputs market participants would use in pricing the asset or liability developed based on the best information available in the circumstances. The fair value hierarchy is categorized into three levels based on the inputs as follows:
Level 1—Valuations based on unadjusted quoted prices in active markets for identical assets or liabilities that SDRG has the ability to access. Valuation adjustments and block discounts are not applied to Level 1 securities. Since valuations are based on quoted prices that are readily and regularly available in an active market, valuation of these securities does not entail a significant degree of judgment.
Level 2—Valuations based on quoted prices in markets that are not active or for which all significant inputs are observable, either directly or indirectly.
Level 3—Valuations based on inputs that are unobservable and significant to the overall fair value measurement.
The availability of valuation techniques and observable inputs can vary from security to security and is affected by a wide variety of factors including the type of security, whether the security is new and not yet established in the marketplace, and other characteristics particular to the transaction. To the extent that valuation is based on models or inputs that are less observable or unobservable in the market, the determination of fair value requires more judgment. Those estimated values do not necessarily represent the amounts that may be ultimately realized due to the occurrence of future circumstances that cannot be reasonably determined. Because of the inherent uncertainty of valuation, those estimated values may be materially
15
Table of Contents
higher or lower than the values that would have been used had a ready market for the securities existed. Accordingly, the degree of judgment exercised by SDRG in determining fair value is greatest for securities categorized in Level 3. In certain cases, the inputs used to measure fair value may fall into different levels of the fair value hierarchy. In such cases, for disclosure purposes, the level in the fair value hierarchy, within which the fair value measurement in its entirety falls, is determined based on the lowest level input that is significant to the fair value measurement.
Fair value is a market-based measure considered from the perspective of a market participant rather than an entity-specific measure. Therefore, even when market assumptions are not readily available, SDRG’s own assumptions are set to reflect those that market participants would use in pricing the asset or liability at the measurement date. SDRG uses prices and inputs that are current as of the measurement date, including during periods of market dislocation. In periods of market dislocation, the observability of prices and inputs may be reduced for many securities. This condition could cause a security to be reclassified to a lower level within the fair value hierarchy. For instance, when Corn Futures Contracts on the Chicago Board of Trade (“CBOT”) are not actively trading due to a “limit-up” or limit-down” condition, meaning that the change in the Corn Futures Contracts has exceeded the limits established, the Trust and SDRG will revert to alternative verifiable sources of valuation of its assets. When such a situation exists on a quarter close, the Managing Owner will calculate the NAV on a particular day using the Level 1 valuation, but will later recalculate the NAV based upon the valuation inputs from these alternative verifiable sources (Level 2 or Level 3) and will report such NAV in its applicable financial statements and reports.
SDRG records its derivative activities at fair value. Profits and losses from derivative contracts are included in the Statement of Operations. Derivative contracts include futures contracts related to commodity prices. Futures, which are listed on a national securities exchange, such as the CBOT or the New York Mercantile Exchange (“NYMEX”), or reported on another national market, are generally categorized in Level 1 of the fair value hierarchy. SDRG also trades futures contracts on the London Metals Exchange (LME). The valuation pricing for LME contracts is based on action of a committee that incorporates prices from the most liquid trading sessions of the day and can also rely on other inputs such as supply and demand factors and bid and asks from open outcry sessions. These are considered to be level 2 positions. Over-the-counter (OTC) derivatives contracts (such as forward and swap contracts) which may be valued using models, depending on whether significant inputs are observable or unobservable, are categorized in Levels 2 or 3 of the fair value hierarchy. United States Treasury Bills are valued using over the counter prices which are provided by reputable pricing services; such instruments are categorized within Level 2 of the fair value hierarchy.
Net Income (Loss) per Share
Net income (loss) per share is the difference between the NAV per share at the beginning of each period and at the end of each period. The weighted average number of Shares outstanding was computed for purposes of disclosing net income (loss) per weighted average share. The weighted average Shares are equal to the number of Shares outstanding at the end of the period, adjusted proportionately for Shares created or redeemed based on the amount of time the Shares were outstanding during such period.
New Accounting Pronouncements
In December 2011, the Financial Accounting Standards Board (“FASB”) issued Accounting Standards Update No. 2011-11, Balance Sheet (Topic 210): Disclosures about Offsetting Assets and Liabilities (“ASU 2011-11”), which requires entities to provide enhanced disclosures about financial instruments and derivative instruments that either are presented on a net basis in the statement of financial condition or subject to an enforceable master netting arrangement or similar agreement including (i) a description of the rights of offset associated with relevant agreements and (ii) both net and gross information, including amounts of financial collateral, for relevant assets and liabilities. The purpose of the update is to enhance comparability between those companies that prepare their financial statements on the basis of U.S. GAAP and those that prepare their financial statements in accordance with IFRS and enables users of the financial statements to understand the effect or potential effect of the offsetting arrangements on the balance sheet. ASU 2011-11 is effective for fiscal years beginning on or after January 1, 2013, and for interim periods within those years. Disclosures are required retrospectively for all comparative periods presented in an entity’s financial statements. The Managing Owner is currently evaluating the impact on the financial statement disclosures for SDRG.
16
Table of Contents
Note 3 – Service Providers and Related Party Agreements
The Managing Owner
BNP Paribas Quantitative Strategies, LLC, a Delaware limited liability company, was formed on April 30, 2010 and serves as Managing Owner of the Trust and SDRG. The Managing Owner will also manage SEVF. The Managing Owner is a subsidiary of Paribas North America, Inc., which is a subsidiary of BNP Paribas (“BNPP”). As a registered commodity pool operator of the Trust and SDRG, the Managing Owner must comply with various regulatory requirements under the Commodity Exchange Act (the “CEAct”) and the rules and regulations of the CFTC and the NFA, including investor protection requirements, antifraud prohibitions, disclosure requirements, and reporting and recordkeeping requirements. The Managing Owner is also subject to periodic inspections and audits by the CFTC and NFA.
The Commodity Broker
A variety of executing brokers will execute futures transactions on behalf of SDRG. Such executing brokers will give-up all such transactions to both PBI and CFL, serving as SDRG’s executing and clearing brokers, which are referred to as the Commodity Brokers. The Commodity Brokers are affiliates of the Managing Owner and are BNPP affiliated entities. In its capacity as executing and clearing brokers, the Commodity Brokers will execute and clear each of SDRG’s futures transactions and will perform certain administrative services for SDRG.
The Trustee
Under the Trust Agreement, Wilmington Trust Company, the trustee of SDRG (the “Trustee”) has delegated to the Managing Owner the exclusive management and control of all aspects of the business of the Trust and SDRG. The Trustee will have no duty or liability to supervise or monitor the performance of the Managing Owner, nor will the Trustee have any liability for the acts or omissions of the Managing Owner.
The Administrator
The Bank of New York Mellon (the “Administrator”) has been appointed by the Managing Owner as the administrator, custodian and transfer agent of SDRG, and has entered into separate administrative, custodian, transfer agency and service agreements (collectively referred to as the “Administration Agreement”) with the Managing Owner.
Pursuant to the Administration Agreement, the Administrator performs or supervises the performance of services necessary for the operation and administration of SDRG (other than making investment decisions), including receiving and processing orders from Authorized Participants to create and redeem Baskets, net asset value calculations, accounting and other fund administrative services. The Administrator retains certain financial books and records, including: Basket creation and redemption books and records, fund accounting records, ledgers with respect to assets, liabilities, capital, income and expenses, the registrar, transfer journals and related details, and trading and related documents received from futures commission merchants.
The Marketing Agent
Through a marketing agreement between the Managing Owner and ALPS Distributors, Inc., the Managing Owner, on behalf of SDRG, has appointed ALPS Distributors, Inc. as a marketing agent. ALPS Distributors, Inc. assists the Managing Owner and the Administrator with certain functions and duties such as providing various educational and marketing activities regarding SDRG, primarily in the secondary trading market, which activities include, but are not limited to, communicating SDRG’s name, characteristics, uses, benefits, and risks, consistent with the prospectus. ALPS Distributors, Inc. will not open or maintain customer accounts or handle orders for SDRG. ALPS Distributors, Inc. engages in public seminars, road shows, conferences, media interviews, and distributes sales literature and other communications (including electronic media) regarding SDRG.
Licensor
Under the License Agreement between Standard & Poor’s Financial Services LLC (the “Licensor”) and the Managing Owner in its own capacity and in its capacity as managing owner of SDRG (SDRG and the Managing Owner, collectively, the “Licensees”), the Licensor granted to each Licensee a non-exclusive license to use the “Standard & Poor’s Financial Services LLC” trademark (the “Trademark”) anywhere in the world, solely in connection with the marketing and promotion of SDRG and to use or refer to the Trademark in connection with the issuance and trading of SDRG as necessary.
17
Table of Contents
Note 4 – Fair Value Measurements
SDRG’s assets and liabilities recorded at fair value have been categorized based upon a fair value hierarchy as described in SDRG’s significant accounting policies in Note 2. The following table presents information about SDRG’s assets and liabilities measured at fair value as of November 30, 2012:
| Level 1 | Level 2 | Level 3 | Balance as of November 30, 2012 |
|||||||||||||
| Assets: |
||||||||||||||||
| U.S. Treasury obligations |
$ | — | $ | 16,697,513 | $ | — | $ | 16,697,513 | ||||||||
| Net unrealized appreciation on futures contracts |
362,759 | 74,357 | — | 437,116 | ||||||||||||
|
|
|
|
|
|
|
|
|
|||||||||
| Total |
$ | 362,759 | $ | 16,771,870 | $ | — | $ | 17,134,629 | ||||||||
|
|
|
|
|
|
|
|
|
|||||||||
| Level 1 | Level 2 | Level 3 | Balance as of November 30, 2012 |
|||||||||||||
| Liabilities: |
||||||||||||||||
| Net unrealized depreciation on futures contracts |
$ | 75,291 | $ | 1,848 | $ | — | $ | 77,139 | ||||||||
|
|
|
|
|
|
|
|
|
|||||||||
The following table presents information about SDRG’s assets and liabilities measured at fair value as of August 31, 2012:
| Level 1 | Level 2 | Level 3 | Balance as of August 31, 2012 |
|||||||||||||
| Assets: |
||||||||||||||||
| U.S. Treasury obligations |
$ | — | $ | 15,597,203 | $ | — | $ | 15,597,203 | ||||||||
| Net unrealized appreciation on futures contracts |
1,384,692 | 8,831 | — | 1,393,523 | ||||||||||||
|
|
|
|
|
|
|
|
|
|||||||||
| Total |
$ | 1,384,692 | $ | 15,606,034 | $ | — | $ | 16,990,726 | ||||||||
|
|
|
|
|
|
|
|
|
|||||||||
| Level 1 | Level 2 | Level 3 | Balance as of August 31, 2012 |
|||||||||||||
| Liabilities: |
||||||||||||||||
| Net unrealized depreciation on futures contracts |
$ | 51,567 | $ | 2,494 | $ | — | $ | 54,061 | ||||||||
|
|
|
|
|
|
|
|
|
|||||||||
There were no transfers between any levels during the three months ended November 30, 2012 and August 31, 2012 respectively.
Note 5 – Derivative Instruments and Hedging Activities
In the normal course of business, SDRG utilizes derivative contracts in connection with its proprietary trading activities. Investments in derivative contracts are subject to additional risks that can result in a loss of all or part of an investment. SDRG’s derivative activities and exposure to derivative contracts are considered to have commodity price risk. During the three months ended November 30, 2012, SDRG had investments only in commodity futures contracts.
18
Table of Contents
Futures Contracts
SDRG is subject to commodity price risk in the normal course of pursuing its investment objectives. A futures contract represents a commitment for the future purchase or sale of an asset at a specified price on a specified date.
The purchase and sale of futures contracts requires margin deposits with a FCM. Subsequent payments (variation margin) are made or received by SDRG each day, depending on the daily fluctuations in the value of the contract, and are recorded as unrealized profits or losses by SDRG. Futures contracts may reduce SDRG’s exposure to counterparty risk since futures contracts are exchange-traded; and the exchange’s clearinghouse, as the counterparty to all exchange-traded futures, guarantees the futures against default.
The CEAct requires a FCM to segregate all customer transactions and assets from the FCM’s proprietary activities. A customer’s cash and other equity deposited with a FCM are considered commingled with all other customer funds subject to the FCM’s segregation requirements. In the event of a FCM’s insolvency, recovery may be limited to SDRG’s pro rata share of segregated customer funds available. It is possible that the recovery amount could be less than the total of cash and other equity deposited.
The following tables identify the fair value amounts of derivative instruments included in the Statement of Financial Condition as derivative contracts, categorized by primary underlying risk, at November 30, 2012 and August 31, 2012. Balances are presented on a gross basis, prior to the application of the impact of counterparty and collateral netting. The following tables also identify the net gain and loss amounts included in the Statement of Operations as realized and unrealized profits and losses on trading of commodity futures contracts, categorized by primary underlying risk, for the three months ended November 30, 2012.
The fair value of derivative instruments was as follows:
At November 30, 2012
| Primary Underlying Risk |
Asset derivatives | Liability derivatives | Net derivatives | |||||||||
| Commodity price |
||||||||||||
| Net unrealized appreciation/(depreciation) on futures contracts |
$ | 437,116 | $ | (77,139 | ) | $ | 359,977 | |||||
At August 31, 2012
| Primary Underlying Risk |
Asset derivatives | Liability derivatives | Net derivatives | |||||||||
| Commodity price |
||||||||||||
| Net unrealized appreciation/(depreciation) on futures contracts |
$ | 1,393,523 | $ | (54,061 | ) | $ | 1,339,462 | |||||
The following is a summary of realized and unrealized gains and losses of the derivative instruments utilized by SDRG:
For the period from September 1, 2012 to November 30, 2012
| Primary Underlying Risk |
Realized gain
on derivative instruments |
Net change in unrealized gain (loss) on derivative instruments |
||||||
| Commodity Price |
||||||||
| Net unrealized appreciation/(depreciation) on futures contracts |
$ | 540,292 | $ | (979,485 | ) | |||
19
Table of Contents
Volume of Derivative Activities
The average notional amounts and number of contracts, categorized by primary underlying risk, were as follows:
For the period from September 1, 2012 to November 30, 2012
| Long exposure | ||||||||
| Primary underlying risk |
Notional amounts |
Number of contracts |
||||||
| Commodity price |
||||||||
| Net unrealized appreciation/(depreciation) on futures contracts |
$ | 17,279,006 | 233 | |||||
Note 6 – Financial Highlights
The following table presents per share performance data and other supplemental financial data for the period from September 1, 2012 to November 30, 2012. This information has been derived from information presented in the financial statements.
| Net asset value, beginning of period |
$ | 28.71 | ||
| Net realized and change in unrealized gain (loss) from investments |
(.73 | ) | ||
| Net investment income (loss) |
(.05 | ) | ||
|
|
|
|||
| Net increase (decrease) in net assets from operations |
(.78 | ) | ||
|
|
|
|||
| Net asset value, end of period |
$ | 27.93 | ||
| Market value per share, beginning of period |
$ | 28.72 | ||
| Market value per share, end of period |
$ | 28.16 | (1) | |
| Ratios to Average Net Assets (Annualized) |
||||
| Net investment income (loss) |
(.76 | )% | ||
| Gross expenses |
2.35 | % | ||
| Expense reimbursement |
(1.51 | )% | ||
| Net expenses |
.84 | % | ||
| Total Return, at net asset value |
(2.72 | )% | ||
| Total Return, at market value |
(1.95 | )%(1) | ||
| (1) | This represents the closing price on November 30, 2012. If the average of the bid and ask as of the close of trading were used as of November 30, 2012 ($27.96), the total return would be a loss of 2.65%. |
Total return is calculated based on the change in value during the period. An individual shareholder’s total return and ratios may vary from the above total returns and ratios based on the timing of purchase to redemption from SDRG. The ratios for the three months ended November 30, 2012, excluding non-recurring expenses, have been annualized.
The financial highlights per share data are calculated using the average of the daily Shares outstanding for the reporting period, which is inclusive of the last day of the period under report.
Note 7 – Organizational and Offering Costs
Expenses incurred in organizing of the Trust and the initial offering of the Shares of SDRG, including applicable SEC registration fees were borne directly by the Managing Owner. SDRG will not be obligated to reimburse the Managing Owner.
20
Table of Contents
Note 8 – Financial Instrument Risk
In the normal course of its business, SDRG is a party to financial instruments with off-balance sheet risk. The term “off-balance sheet risk” refers to an unrecorded potential liability that, even though it does not appear on the balance sheet, may result in a future obligation or loss. The financial instruments used by SDRG are commodity futures, whose values are based upon an underlying asset and generally represent future commitments that have a reasonable possibility of being settled in cash or through physical delivery. The financial instruments are traded on an exchange and are standardized contracts.
Market risk is the potential for changes in the value of the financial instruments traded by SDRG due to market changes, including fluctuations in commodity prices. In entering into these futures contracts, there exists a market risk that such futures contracts may be significantly influenced by adverse conditions, resulting in such futures contracts being less valuable. If the markets should move against all of the futures contracts at the same time, SDRG could experience substantial losses.
Credit risk is the possibility that a loss may occur due to the failure of an exchange clearinghouse to perform according to the terms of the futures contract. Credit risk with respect to exchange-traded instruments is reduced to the extent that an exchange or clearing organization acts as a counterparty to the transactions. SDRG’s risk of loss in the event of counterparty default is typically limited to the amounts recognized in the statement of financial condition and not represented by the futures contract or notional amounts of the instruments.
SDRG has not utilized, nor does it expect to utilize in the future, special purpose entities to facilitate off-balance sheet financing arrangements and has no loan guarantee arrangements or off-balance sheet arrangements of any kind, other than agreements entered into in the normal course of business noted above.
Note 9 – Commitments and Contingencies
The Managing Owner, either in its own capacity or in its capacity as the Managing Owner on behalf of SDRG, has entered into various service agreements that contain a variety of representations, or provide indemnification provisions related to certain risks service providers undertake in performing services which are in the best interest of SDRG. During the three months ended November 30, 2012 no claims were received by SDRG and it is therefore not possible to estimate SDRG’s potential future exposure under such indemnification provisions.
Note 10 – Subsequent Events
The Managing Owner evaluates subsequent events through the date when financial statements are filed with the SEC. This evaluation did not result in any subsequent changes that necessitated disclosure and/or adjustments.
21
Table of Contents
| ITEM 2. | MANAGEMENT’S DISCUSSION AND ANALYSIS OF FINANCIAL CONDITION AND RESULTS OF OPERATIONS. |
This information should be read in conjunction with the financial statements and notes included in Item 1 of Part I of this Quarterly Report (the “Report”). The discussion and analysis which follows may contain trend analysis and other forward-looking statements within the meaning of Section 21E of the Securities Exchange Act of 1934, as amended (the “Exchange Act”) which reflect our current views with respect to future events and financial results. Words such as “anticipate,” “expect,” “intend,” “plan,” “believe,” “seek,” “outlook” and “estimate,” as well as similar words and phrases, signify forward-looking statements. STREAM Exchange Traded Trust’s forward-looking statements are not guarantees of future results and conditions and important factors, risks and uncertainties may cause our actual results to differ materially from those expressed in our forward-looking statements.
You should not place undue reliance on any forward-looking statements. Except as expressly required by the Federal securities laws, BNP Paribas Quantitative Strategies, LLC (the “Managing Owner”), undertakes no obligation to publicly update or revise any forward-looking statements or the risks, uncertainties or other factors described in this Report, as a result of new information, future events or changed circumstances or for any other reason after the date of this Report.
Overview/Introduction
Organization
STREAM S&P Dynamic Roll Global Commodities Fund (the “Fund”), a separate series of STREAM Exchange Traded Trust (the “Trust”), a Delaware statutory trust organized in two separate series, was formed on April 30, 2010. STREAM Enhanced Volatility Fund is the other series of the Trust, which is not currently offered to the public. The Fund offers common units of beneficial interest (the “Shares”) only to certain eligible financial institutions (the “Authorized Participants”) in one or more blocks of 40,000 Shares (a “Basket”). BNP Paribas Quantitative Strategies, LLC (the “Managing Owner”), a Delaware limited liability company, serves as the managing owner and commodity pool operator of the Fund. BNP Paribas Securities Corp (“BNPPSC”), acting as agent for BNP Paribas Arbitrage SNC (“Arbitrage”) seeded the Fund with a capital contribution of $100,000 in exchange for 4,000 Shares at the initial issuance price of $25.00 per share on September 22, 2011. Additionally, BNPPSC, acting as agent for Arbitrage seeded the STREAM Enhanced Volatility Fund with a capital contribution of $100,000 in exchange for 4,000 Shares at the initial issuance price of $25.00 per Share on September 22, 2011.
Fund Objective and Index
The Fund seeks to track changes, whether positive or negative, in the level of the S&P GSCI® Dynamic Roll Excess Return Index (the “Index”), over time, plus the excess, if any of the Fund’s interest from its holdings of cash, U.S. Treasury bonds, U.S. Treasury bills, U.S. government securities and related securities (the “Cash Instruments”) over the expenses of the Fund.
The Fund seeks to achieve its investment objective by investing in exchange-traded futures on the index commodities comprising the Index (the “Index Commodities”), with a view to tracking the Index over time. The Index aims to reflect the return of an investment in a world production-weighted portfolio comprised of the principal physical commodities that are the subject of active, liquid futures markets. The Index employs a flexible and systematic futures contract rolling methodology which seeks to maximize yield from rolling long futures contracts in certain markets (backwardated markets) and minimize roll loss from rolling long futures contracts in certain markets (contangoed markets).
The Fund does not intend to outperform the Index. The Managing Owner seeks to cause the net asset value of the Fund to track the Index during periods in which the Index is flat or declining as well as when the Index is rising.
Performance Summary
This Report covers the three months ended November 30, 2012. The Fund commenced investment operations on June 1, 2012 and Fund Shares commenced trading on the NYSE Arca, Inc. (the “NYSE Arca”) on June 6, 2012 under the symbol “BNPC”. As of November 30, 2012, STREAM Enhanced Volatility Fund had seeded capital but had not commenced investment operations; therefore, this Report does not address STREAM Enhanced Volatility Fund and only addresses the results of the Fund which was in operation during the three months ended November 30, 2012.
22
Table of Contents
Performance of the Fund and the exchange traded Shares are detailed below in “Results of Operations.” Past performance of the Fund is not necessarily indicative of future performance.
The Index aims to reflect the return of an investment in a world production-weighted portfolio comprised of the principal physical commodities that are the subject of active, liquid futures markets. The Index employs a flexible and systematic futures contract rolling methodology which seeks to maximize yield from rolling long futures contracts in certain markets (backwardated markets) and minimize roll loss from rolling long futures contracts in certain markets (contangoed markets).
The section “Summary of S&P GSCI® Dynamic Roll Excess Return Index and the Underlying Designated Contracts Returns for the Three Months Ended November 30, 2012” below provides the changes in the closing levels of the Index by disclosing the percentage change of each of the Index Commodities as reflected by each corresponding underlying Designated Contract. Please note that the Fund’s objective is to track the Index and the Fund does not attempt to outperform or underperform the Index.
Summary of S&P GSCI® Dynamic Roll Excess Return Index and Underlying Designated Contracts Returns for the Three Months
Ended November 30, 2012
| Underlying Designated Contracts |
Returns for the Three Months Ended November 30, 2012 |
|||
| Chicago Wheat |
1.49 | % | ||
| Kansas City Wheat |
1.08 | % | ||
| Corn |
–2.23 | % | ||
| Soybeans |
–14.15 | % | ||
| Coffee |
–11.58 | % | ||
| Sugar #11 |
–5.26 | % | ||
| Cocoa |
–4.55 | % | ||
| Cotton #2 |
–5.23 | % | ||
| Lean Hogs |
10.84 | % | ||
| Live Cattle |
–1.68 | % | ||
| Feeder Cattle |
–3.01 | % | ||
| Crude Oil |
–6.25 | % | ||
| Heating Oil |
–2.09 | % | ||
| RBOB Gasoline |
0.29 | % | ||
| Brent Crude Oil |
–2.42 | % | ||
| Gasoil |
–2.04 | % | ||
| Natural Gas |
6.21 | % | ||
| Aluminum |
8.86 | % | ||
| Copper |
5.76 | % | ||
| Lead |
14.51 | % | ||
| Nickel |
10.30 | % | ||
| Zinc |
9.91 | % | ||
23
Table of Contents
| Underlying Designated Contracts |
Returns for the Three Months Ended November 30, 2012 |
|||
| Gold |
1.37 | % | ||
| Silver |
5.78 | % | ||
| AGGREGATE RETURN OF INDEX: |
–2.56 | % | ||
Pursuant to the rules and regulations of the Exchange Act, the above table discloses the change in levels of the Index for the period covered by this Report. If the Fund’s interest income from its holdings of fixed-income securities exceeds the Fund’s fees and expenses, then the amount of such excess is expected to be distributed periodically. The market price of the Shares is expected to closely track the Index. The aggregate return on an investment in the Fund over any period is the sum of the capital appreciation or depreciation of the Shares over the period, plus the amount of any distributions during the period.
Net Asset Value
Net Asset Value means the total assets of the Fund including, but not limited to, all cash and cash equivalents or other debt securities less total liabilities of the Fund, each determined on the basis of generally accepted accounting principles. In particular, Net Asset Value includes any unrealized profit or loss on open exchange-traded futures corresponding to the Index Commodities (the “Designated Contracts”), swap agreements cleared through the facilities of a centralized clearing house (“Cleared Swaps”), futures contracts referencing particular commodities other than the Index Commodities (the “Substitute Contracts”), forward agreements, exchange-traded cash settled options, swaps other than Cleared Swaps, and other over-the-counter transactions that serve as proxies for one or more Index Commodities (the “Alternative Financial Instruments”) (if any) and any other credit or debit accruing to the Fund but unpaid or not received by the Fund. All open commodity futures contracts traded on a U.S. or non-U.S. exchange will be calculated at their then current market value, which will be based upon the settlement price for that particular commodity futures contract traded on the applicable U.S. or non-U.S. exchange on the date with respect to which Net Asset Value is being determined; provided, that if a commodity futures contract traded on a U.S. or on a non-U.S. exchange could not be liquidated on such day, due to the operation of daily limits (if applicable) or other rules of the exchange upon which that position is traded or otherwise, the settlement price on the most recent day on which the position could have been liquidated will be the basis for determining the market value of such position for such day. The Managing Owner may in its discretion (and under extraordinary circumstances, including, but not limited to, periods during which a settlement price of a futures contract is not available due to exchange limit orders or force majeure type events such as systems failure, natural or man-made disaster, act of God, armed conflict, act of terrorism, riot or labor disruption or any similar intervening circumstance) value any asset of the Fund pursuant to such other principles as the Managing Owner deems fair and equitable so long as such principles are consistent with normal industry standards. Interest earned on the Fund’s commodity brokerage accounts is expected to accrue at least monthly. The amount of any distribution will be a liability of the Fund from the day when the distribution is declared until it is paid.
The value of Cleared Swaps is determined based on the value of the Designated Contract underlying the Index Commodity in connection with each specific Cleared Swap.
In calculating the Net Asset Value of the Fund, the settlement value of a Cleared Swap (if any) and an Alternative Financial Instrument (if any) is determined by either applying the then-current disseminated value for the Designated Contracts or the terms as provided under the applicable Cleared Swap or Alternative Financial Instrument, as applicable. However, in the event that the Designated Contracts are not trading due to the operation of daily limits or otherwise, the Managing Owner may in its sole discretion choose to value the Fund’s Cleared Swap or Alternative Financial Instrument (if any) on a fair value basis in order to calculate the Fund’s Net Asset Value.
Net Asset Value per Share is the Net Asset Value of the Fund divided by the number of its outstanding Shares.
24
Table of Contents
Critical Accounting Policies
The Fund’s critical accounting policies are as follows:
Preparation of the financial statements and related disclosures in accordance with U.S. generally accepted accounting principles (“U.S. GAAP”) requires the application of appropriate accounting rules and guidance, as well as the use of estimates. The Fund’s application of these policies involves judgments and the use of estimates. Actual results may differ from the estimates used and such differences could be material. The Fund will hold a significant portion of its assets in futures contracts and Cash Instruments, each of which, as applicable, will be held at fair value. The Fund may also invest in Cleared Swaps, Substitute Contracts and/or Alternative Financial Instruments.
Fair Value – Definition and Hierarchy
In accordance with U.S. GAAP, fair value is defined as the price that would be received to sell an asset or paid to transfer a liability (i.e., the “exit price”) in an orderly transaction between market participants at the measurement date.
In determining fair value, the Fund uses various valuation approaches. In accordance with U.S. GAAP, a fair value hierarchy for inputs is used in measuring fair value that maximizes the use of observable inputs and minimizes the use of unobservable inputs by requiring that the most observable inputs be used when available. Observable inputs are those that market participants would use in pricing the asset or liability based on market data obtained from sources independent of the Fund. Unobservable inputs reflect the Fund’s assumptions about the inputs market participants would use in pricing the asset or liability developed based on the best information available in the circumstances. The fair value hierarchy is categorized into three levels based on the inputs as follows:
Level 1—Valuations based on unadjusted quoted prices in active markets for identical assets or liabilities that the Fund has the ability to access. Valuation adjustments and block discounts are not applied to Level 1 securities. Since valuations are based on quoted prices that are readily and regularly available in an active market, valuation of these securities does not entail a significant degree of judgment.
Level 2—Valuations based on quoted prices in markets that are not active or for which all significant inputs are observable, either directly or indirectly.
Level 3—Valuations based on inputs that are unobservable and significant to the overall fair value measurement.
The availability of valuation techniques and observable inputs can vary from security to security and is affected by a wide variety of factors including the type of security, whether the security is new and not yet established in the marketplace, and other characteristics particular to the transaction. To the extent that valuation is based on models or inputs that are less observable or unobservable in the market, the determination of fair value requires more judgment. Those estimated values do not necessarily represent the amounts that may be ultimately realized due to the occurrence of future circumstances that cannot be reasonably determined. Because of the inherent uncertainty of valuation, those estimated values may be materially higher or lower than the values that would have been used had a ready market for the securities existed. Accordingly, the degree of judgment exercised by the Fund in determining fair value is greatest for securities categorized in Level 3. In certain cases, the inputs used to measure fair value may fall into different levels of the fair value hierarchy. In such cases, for disclosure purposes, the level in the fair value hierarchy, within which the fair value measurement in its entirety falls, is determined based on the lowest level input that is significant to the fair value measurement.
Fair value is a market-based measure considered from the perspective of a market participant rather than an entity-specific measure. Therefore, even when market assumptions are not readily available, the Fund’s own assumptions are set to reflect those that market participants would use in pricing the asset or liability at the measurement date. The Fund uses prices and inputs that are current as of the measurement date, including during periods of market dislocation. In periods of market dislocation, the observability of prices and inputs may be reduced for many securities. This condition could cause a security to be reclassified to a lower level within the fair value hierarchy. For instance, when Corn Futures Contracts on the Chicago Board of Trade (“CBOT”) are not actively trading due to a “limit-up” or limit-down” condition, meaning that the change in the Corn Futures Contracts has exceeded the limits established, the Trust and the Fund will revert to alternative verifiable sources of valuation of its assets. When such a situation exists on a quarter close, the Managing Owner will calculate the NAV on a particular day using the Level 1 valuation, but will later recalculate the NAV for the impacted Fund based upon the valuation inputs from these alternative verifiable sources (Level 2 or Level 3) and will report such NAV in its applicable financial statements and reports.
25
Table of Contents
The Fund records its derivative activities at fair value. Profits and losses from derivative contracts are included in the Statement of Operations. Derivative contracts include futures contracts related to commodity prices. Futures, which are listed on a national securities exchange, such as the CBOT or the New York Mercantile Exchange (“NYMEX”), or reported on another national market, are generally categorized in Level 1 of the fair value hierarchy. The Fund also trades futures contracts on the London Metals Exchange (“LME”). The valuation pricing for LME contracts is based on action of a committee that incorporates prices from the most liquid trading sessions of the day and can also rely on other inputs such as supply and demand factors and bid and asks from open outcry sessions. These are considered to be level 2 positions. OTC derivatives contracts (such as forward and swap contracts) which may be valued using models, depending on whether significant inputs are observable or unobservable, are categorized in Levels 2 or 3 of the fair value hierarchy. United States Treasury Bills are valued using over the counter prices which are provided by reputable pricing services; such instruments are categorized within Level 2 of the fair value hierarchy.
Liquidity and Capital Resources
All of the Fund’s source of capital is derived from the Fund’s offering of Shares to Authorized Participants. The Fund in turn allocates its net assets to commodities trading. A significant portion of the net asset value is held in Cash Instruments, which are used as margin for the Fund’s trading in commodities. The percentage that Cash Instruments bear to the total net assets will vary from period to period as the market values of the Fund’s commodity interests change. The balance of the net assets is held in the Fund’s commodity trading account. Interest earned on the Fund’s interest-bearing funds is paid to the Fund.
If the Fund invests in Cleared Swaps and/or Alternative Financial Instruments, a portion of its proceeds of the offering may be used to collateralize the Cleared Swaps and/or Alternative Financial Instruments, as applicable, in accordance with normal market practices.
Although the following percentages may vary substantially over time, as of the date of this report, the Fund estimates that up to approximately 10% of its Net Asset Value will be placed in segregated accounts (pursuant to the rules of the CFTC) in the name of the Fund with BNP Paribas Prime Brokerage, Inc., a Delaware corporation, which will serve as the Fund’s executing and clearing broker (“PBI”) and BNP Paribas Commodity Futures Limited, a limited company registered in England and Wales will serve as the Fund’s executing and clearing broker (“CFL”) (or another eligible financial institution, as applicable) in the form of Cash Instruments to margin positions of all futures contracts combined. The Fund maintains approximately 90% of its Net Asset Value in Cash Instruments over and above that which is needed to post as collateral for trading. The percentage that the Fund’s Cash Instruments will bear to the total net assets will vary from period to period as the market values of commodity interests change. The balance of the net assets will be held in the Fund’s segregated and custodial account with the Custodian or Commodity Broker. Interest earned on the Fund’s interest-bearing funds will be paid to the Fund.
“Initial” or “original” margin is the minimum amount of funds that must be deposited by a futures trader with his commodity broker in order to initiate futures trading or to maintain an open position in futures contracts. “Maintenance” margin is the amount (generally less than initial margin) to which a trader’s account may decline before he must deliver additional margin. Margin requirements are computed each day by a commodity broker. When the market value of a particular open futures interests contract position changes to a point where the margin on deposit does not satisfy maintenance margin requirements, a margin call is made by the commodity broker. The Fund will meet a margin call by either liquidating an appropriate amount of Cash Instruments, as applicable, or satisfy the margin call with cash. If the Fund does not have a sufficient amount of Cash Instruments to satisfy the margin call, the Fund will be required to liquidate its holdings of futures contracts, Cleared Swaps or Alternative Financial Instruments (if any). If the margin call is not met within a reasonable time, the broker may close out the Fund’s position.
The amount of margin that is required to establish and maintain a Cleared Swap is determined by the exchange which clears the applicable Cleared Swap. Additionally, the requirements and the logistics related to margin with respect to Cleared Swaps is substantially similar to futures contracts.
The Fund’s commodity futures contracts may be subject to periods of illiquidity because of market conditions, regulatory considerations and other reasons. For example, commodity exchanges limit fluctuations in certain commodity futures contract prices during a single day by regulations referred to as “daily limits.” During a single day, no trades may be executed at prices beyond the daily limit. Once the price of a futures contract for a particular commodity has increased or decreased by an amount equal to the daily limit, positions in the commodity futures contracts can neither be taken nor liquidated unless the traders are willing to effect trades at or within the limit. Commodity futures prices have occasionally moved the daily limit for several consecutive days with little or no trading. Such market conditions could prevent the Fund from promptly liquidating its commodity futures positions.
26
Table of Contents
The Fund’s Cleared Swaps and Alternative Financial Instruments, if any, may also be subject to periods of illiquidity because of market conditions, regulatory considerations and other reasons. For example, the Alternative Financial Instruments are not traded on an exchange, do not have uniform terms and conditions, and in general are not transferable without the consent of the counterparty. Entry into Alternative Financial Instruments (if any) may further impact liquidity because these contractual agreements are executed “off-exchange” between private parties and, therefore, the time required to offset or “unwind” these positions may be greater than that for exchange-traded instruments. This potential delay could be exacerbated to the extent a counterparty is not a U.S. person.
Because the Fund trades futures contracts, its capital is at risk due to changes in the market price of these contracts (market risk) or the inability of counterparties to perform under the terms of the contracts (credit risk). The Fund’s capital would be at risk in connection with its cleared swaps due to changes in the value of these cleared swaps (market risk) or the inability of counterparties to perform under the terms of the contracts (credit risk). Additionally, if the Fund invested in Alternative Financial Instruments, its capital would be at risk due to changes in the value of these Alternative Financial Instruments (market risk) or the inability of counterparties to perform under the terms of the Alternative Financial Instruments (credit risk).
Authorized Participants may also redeem Baskets of Shares. On any business day, an Authorized Participant may place an order with the Managing Owner to redeem one or more Baskets. Redemption orders must be placed by 10:00 a.m., New York time. The day on which the Managing Owner receives a valid redemption order is the redemption order date. Redemption orders are irrevocable. The redemption procedures allow only Authorized Participants to redeem Baskets. Individual Shareholders may not redeem directly from the Fund. By placing a redemption order, an Authorized Participant agrees to deliver the Baskets to be redeemed through DTC’s book-entry system to the Fund not later than noon, New York time, on the business day immediately following the redemption order date. By placing a redemption order, and prior to receipt of the redemption proceeds, an Authorized Participant’s DTC account is charged the non-refundable transaction fee due for the redemption order.
Market risk
Trading in futures contracts, Cleared Swaps and Alternative Financial Instruments (if any) involves the Fund entering into contractual commitments to purchase or sell a particular commodity at a specified date and price. The market risk associated with the Fund’s commitments to purchase commodities are limited to the gross or face amount of the futures contracts, the Cleared Swaps or the Alternative Financial Instruments (if any) held.
The Fund’s exposure to market risk is influenced by a number of factors including the volatility of interest rates and foreign currency exchange rates, the liquidity of the markets associated with the contracts and the relationships among the contracts held. The inherent uncertainty of the Fund’s trading as well as the development of drastic market occurrences could ultimately lead to a loss of all or substantially all of investors’ capital.
Credit risk
When the Fund enters into futures contracts, Cleared Swaps or Alternative Financial Instruments (if any), the Fund is exposed to credit risk that the counterparty to the contract will not meet its obligations.
The counterparty for futures contracts traded on U.S. and on most foreign futures exchanges is the clearing house associated with the particular exchange. In general, clearing houses are backed by their corporate members who may be required to share in the financial burden resulting from the nonperformance by one of their members and, as such, should significantly reduce this credit risk. In cases where the clearing house is not backed by the clearing members (i.e., some foreign exchanges), it may be backed by a consortium of banks or other financial institutions.
When the Fund enters into Cleared Swaps, the Fund will be exposed to credit risk that the clearinghouse for the Cleared Swaps will not meet its obligations. However, the Fund will not be subject to individual dealer counterparty risk that exists in over the counter swaps that are not cleared through a clearinghouse.
There can be no assurance that any counterparty, clearing member or clearing house will meet its obligations to the Fund.
27
Table of Contents
Cleared Swaps may not generally involve the delivery of the underlying assets either at the outset of a transaction or upon settlement. Because Cleared Swaps are cleared by a clearinghouse, the Fund is not subject to the counterparty risks associated with a swap agreement as described in the next paragraph. However, the Fund is subject to the risk that the clearinghouse may fail to clear the Cleared Swap and therefore may suffer a full loss.
Swap agreements do not generally involve the delivery of the underlying assets either at the outset of a transaction or upon settlement. Accordingly, if the counterparty to a swap agreement defaults, the Fund’s risk of loss consists of the net amount of payments that the Fund is contractually entitled to receive, if any. Swap counterparty risk is generally limited to the amount of any unrealized gains, although in the event of a counterparty bankruptcy, there could be delays and costs associated with recovery of collateral posted in segregated tri-party accounts at the Fund’s custodian bank.
Forward agreements do not involve the delivery of the underlying assets at the onset of a transaction, but may be settled physically in the underlying asset if such contracts are held to expiration. Thus, prior to settlement, if the counterparty to a forward contract defaults, the Fund’s risk of loss consists of the net amount of payments that the Fund is contractually entitled to receive, if any. However, if physically settled forwards are held until expiration (presently, there is no plan to do this), at the time of settlement, the Fund may be at risk for the full notional value of the forward contracts depending on the type of settlement procedures used.
The Managing Owner attempts to minimize these market and credit risks by requiring the Fund to abide by various trading limitations and policies, which include limiting margin accounts and trading only in liquid markets. The Managing Owner implemented procedures which include, but are not be limited to:
| • | executing and clearing trades with creditworthy counterparties; |
| • | limiting the amount of margin or premium required for any one futures contract or all futures contracts combined; and |
| • | generally limiting transactions to futures contracts which will be traded in sufficient volume to permit the taking and liquidating of positions. |
The Fund will enter into Alternative Financial Instruments (if any) with counterparties selected by the Managing Owner. The Managing Owner will select Alternative Financial Instrument (if any) counterparties giving due consideration to such factors as it deems appropriate, including, without limitation, creditworthiness, familiarity with the Index, and price. Under no circumstances will the Fund enter into an Alternative Financial Instrument (if any) with any counterparty whose credit rating is lower than investment-grade at the time a contract is entered into.
PBI, when acting as the Fund’s futures commission merchant in accepting orders for the purchase or sale of domestic futures contracts, will be required by CFTC regulations to separately account for and segregate as belonging to the Fund, all assets of the Fund held at PBI relating to domestic futures trading and PBI will not be allowed to commingle such assets with other assets of PBI. In addition, CFTC regulations will also require PBI to hold in a secure account assets of the Fund related to foreign futures trading.
CFL is subject to the rules and regulations of the Financial Services Authority.
Concentration
At November 30, 2012, BNP Paribas Arbitrage SNC, which is a related party, continued to be a majority shareholder and owned approximately 98% of the outstanding units. If it decided to redeem, it would substantially impact the Fund’s ability to operate.
Cash Flows
The primary cash flow activity of the Fund originates from Authorized Participants through the issuance of Shares of the Fund. This cash may be invested into the Fund where it is used to invest in Cash Instruments and to meet margin requirements as a result of the positions taken in futures contracts to match the fluctuations of the Index that the Fund is attempting to track.
28
Table of Contents
Operating Activities
Net cash flow used in operating activities was $1,040,381 for the three months ended November 30, 2012. This amount includes an increase in collateral due from brokers of $630,160 as reflected in the Statement of Financial Condition.
During the Three Months ended November 30, 2012, $17,296,512 was paid to purchase Cash Instruments and $16,199,939 was received from the sale and maturity of Cash Instruments.
Financing Activities
The Fund’s net cash flow provided by financing activities was $1,116,104 for the three months ended November 30, 2012 consisting of $1,116,104 from the sale of Shares to Authorized Participants and $0 paid on the redemption of Shares by Authorized Participants.
Results of Operations
The Fund commenced investment operations on June 1, 2012 at $25.00 per Share. The Shares have been trading on the NYSE Arca since June 6, 2012 under the symbol “BNPC”.
The Fund seeks to achieve its investment objective by investing in exchange-traded futures on the index commodities comprising the S&P GSCI® Dynamic Roll Excess Return Index (the “Index”), with a view to tracking the Index over time.
The Index is a set of rules applied to a body of data and does not represent the results of actual investment or trading. The Index is frictionless, in that it does not take into account fees or expenses associated with investing in the Fund. Also, because it does not represent actual futures positions, the Index is not subject to, and does not take into account the impact of, speculative position limits or certain other similar limitations on the ability of the Fund to trade the Index Commodities. The Fund, by contrast, invests actual money and trades actual futures contracts. As a result, the performance of the Fund involves friction, in that fees and expenses impose a drag on performance. The Fund may be subject to speculative position limits and certain other limitations on its ability to trade the Index Commodities, which may compel the Fund to trade Cleared Swaps, Substitute Contracts, or Alternative Financial Instruments, as applicable, as proxies for the Index Commodities. All of these factors can contribute to discrepancies between changes in net asset value per Share and changes in the level of the Index over any period of time. Fees and expenses always will tend to cause changes in the net asset value per Share to underperform changes in the value of the Index over any given period, all other things being equal.
The following graph illustrates changes in the price of the Shares (as reflected by the graph “Comparison of BNPC, BNPC NAV and the Index for the Three Months Ended November 30, 2012”).
29
Table of Contents
COMPARISON OF BNPC, BNPC NAV AND THE INDEX FOR
THE THREE MONTHS ENDED NOVEMBER 30, 2012
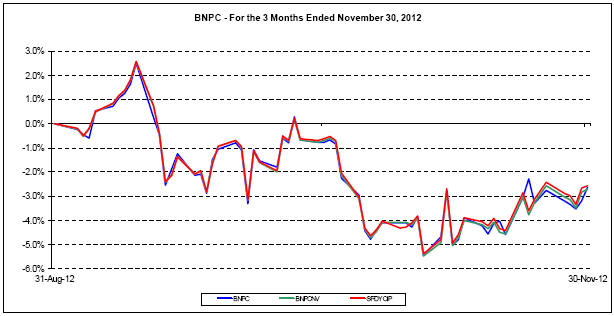
NEITHER THE PAST PERFORMANCE OF THE FUND NOR THE PRIOR INDEX LEVELS AND CHANGES,
POSITIVE OR NEGATIVE, SHOULD BE TAKEN AS AN INDICATION OF THE FUND’S FUTURE
PERFORMANCE.
See Additional Legend below.
30
Table of Contents
Additional Legends
The Index does not reflect (i) actual trading and (ii) any fees or expenses.
With respect to Index data, no representation is being made that the Index will or is likely to achieve annual or cumulative closing levels consistent with or similar to those set forth in the graph above. Similarly, no representation is being made that the Fund will generate profits or losses similar to the Fund’s past performance or the historical annual or cumulative changes in the Index closing levels. In fact, there are frequently sharp differences between hypothetical results and the actual results subsequently achieved by investment methodologies, whether active or passive.
No hypothetical record can completely account for the impact of financial risk in actual trading. For example, there are numerous factors, including those described in the “Risk Factors” set forth in the Fund’s Prospectus dated June 1, 2012, related to the relevant market segments in general or to the implementation of the Fund’s efforts to track the Index over time which cannot be, and have not been, accounted for in the preparation of the Index information set forth on the graph above, all of which can adversely affect actual performance results for the Fund. Furthermore, the Index information does not involve financial risk or account for the impact of fees and costs associated with the Fund.
The Managing Owner commenced operations on April 30, 2010. As managing owner, the Managing Owner and its trading principals have been managing the day-to-day operations for the Fund and, if applicable, related products and managing futures accounts. Because there are limited actual trading results to compare to the Index closing levels set forth above, current and prospective investors should be particularly wary of placing undue reliance on the cumulative Index results as reflected in the graph above.
With respect to the Fund Share price performance, it is noted that the BNPC performance reflected in the graph above utilizes a November 30, 2012 Share price of $27.96. Such amount reflects the average of the bid and ask as of the close of trading on November 30, 2012 and not the last traded price on that date which was $28.16. Refer to further discussion of Fund Share Price Performance below which explains why the average of the bid and ask is being included.
FOR THE THREE MONTHS ENDED NOVEMBER 30, 2012
Fund Share Price Performance
During the three months ended November 30, 2012, the NYSE Arca market value of each Share decreased 1.95% from $28.72 per Share on August 31, 2012 to $28.16 per Share, representing the closing price on November 30, 2012. The closing Share price high and low for the three months ended November 30, 2012 and related change from the Share price on August 31, 2012 was as follows: Shares traded from a high of $29.44 per Share (+2.51%) on September 14, 2012 to a low of $27.15 per Share (-5.47%) on November 5, 2012.
The Managing Owner notes that on November 30, 2012 there was a relatively wide spread between the bid and ask at the close of trading as well as there was a low volume of shares traded; as a result the Managing Owner determined that it was also relevant to depict the performance of the Shares using the average of the bid and ask as of the close of trading on November 30, 2012. The average of the bid and ask as of the close of trading on November 30, 2012 was $27.96. When using this amount, the market value performance declined 2.65%. Such amount is reflected in the previously presented graph entitled Comparison of BNPC, BNPC NAV, and the Index for the Three Months Ended November 30, 2012.
31
Table of Contents
Fund Share Net Asset Value Performance
For the three months ended November 30, 2012, the net asset value of each Share decreased 2.72% from $28.71 per Share to $27.93 per Share (NAV calculation methodology as described in the notes to the financial statements). Appreciation in futures contracts prices for RBOB Gasoline, Natural Gas, Lean Hogs, Chicago Wheat, Kansas City Wheat, Gold, Silver, Aluminum, Copper, Nickel, Lead and Zinc during the period from September 1, 2012 to November 30, 2012 was more than offset by falling prices for Crude Oil, Brent Crude Oil, Heating Oil, Gasoil, Live Cattle, Feeder Cattle, Corn, Soybeans, Coffee, Sugar #11, Cocoa, Cotton #2, during that same period, contributing to an overall 2.56% decrease in the level of the Index. No distributions were paid to Shareholders during the three months ended November 30, 2012. Therefore, the total return for the Fund on a net asset value basis was -2.72%.
Net loss for the three months ended November 30, 2012, was $470,861, resulting from $3,509 of interest income, net realized gain on investments and futures contracts of $540,288, net unrealized loss on futures contracts of $979,485, net unrealized gain on US Treasury obligations of $503 and net operating expenses of $35,676.
Off-Balance Sheet Arrangements and Contractual Obligations
In the normal course of its business, the Fund is party to financial instruments with off-balance sheet risk. The term “off-balance sheet risk” refers to an unrecorded potential liability that, even though it does not appear on the Statement of Financial Condition, may result in a future obligation or loss. The instruments used by the Fund are futures contracts, whose values are based upon an underlying asset and generally represent future commitments which have a reasonable possibility to be settled in cash or through physical delivery. The instruments are traded on an exchange and are standardized contracts.
The Fund has not utilized, nor does it expect to utilize in the future, special purpose entities to facilitate off-balance sheet financing arrangements and have no loan guarantee arrangements or off-balance sheet arrangements of any kind, other than agreements entered into in the normal course of business noted above, which may include indemnification provisions related to certain risks service providers undertake in performing services which are in the best interests of the Fund. While the Fund’s exposure under such indemnification provisions cannot be estimated, these general business indemnifications are not expected to have a material impact on the Fund’s financial position.
The Fund’s contractual obligations are with the Managing Owner and the Commodity Brokers. Management Fee payments made to the Managing Owner are calculated as a fixed percentage of the Fund’s net asset value, net of any applicable waivers. Commission payments to the Commodity Brokers are on a contract-by-contract, or round-turn, basis. As such, the Managing Owner cannot anticipate the amount of payments that will be required under these arrangements for future periods as net asset values are not known until a future date. These agreements are effective for one-year terms, renewable automatically for additional one-year terms unless terminated. Additionally, these agreements may be terminated by either party for various reasons.
32
Table of Contents
| ITEM 3. | QUANTITATIVE AND QUALITATIVE DISCLOSURES ABOUT MARKET RISK. |
Not Required.
| ITEM 4. | CONTROLS AND PROCEDURES. |
Evaluation of Disclosure Controls and Procedures
Under the supervision and with the participation of the management of the Managing Owner, including M. Andrews Yeo, its Chief Executive Officer, and George L. Parry, its Principal Financial Officer, the Fund carried out an evaluation of the effectiveness of the design and operation of its disclosure controls and procedures (as defined in Rule 13a-15(e) or 15d-15(e) of the Exchange Act), as of the end of the period covered by this quarterly report, and, based upon that evaluation, M. Andrews Yeo and George L. Parry, the Chief Executive Officer and the Principal Financial Officer, respectively, of the Managing Owner, concluded that the Fund’s disclosure controls and procedures were effective to ensure that information the Fund is required to disclose in the reports that it files or submits with the SEC under the Exchange Act is recorded, processed, summarized and reported, within the time periods specified in the SEC’s rules and forms, and to ensure that information required to be disclosed by the Fund in the reports that it files or submits under the Exchange Act is accumulated and communicated to management of the Managing Owner, including its Chief Executive Officer and Principal Financial Officer, as appropriate to allow timely decisions regarding required disclosure.
Changes in Internal Control over Financial Reporting
There has been no change in internal control over financial reporting (as defined in the Rules 13a-15(f) and 15d-15(f) of the Exchange Act) that occurred during the Fund’s last fiscal quarter that has materially affected, or is reasonably likely to materially affect, the Fund’s internal control over financial reporting.
33
Table of Contents
| ITEM 1. | LEGAL PROCEEDINGS. |
Not Applicable.
| ITEM 1A. | RISK FACTORS. |
Not Applicable.
| ITEM 2. | UNREGISTERED SALES OF EQUITY SECURITIES AND USE OF PROCEEDS. |
(a) There have been no unregistered sales of the Fund’s securities. No Fund securities are authorized for issuance by the Fund under equity compensation plans.
(b) The Registrant’s Registration Statement on Form S-1 (Registration No.: 333-170314-01) was declared effective on June 1, 2012 with information with respect to the use of proceeds from the sale of the Shares being disclosed therein. The Shares began trading on the NYSE Arca as of June 6, 2012.
For the three months ended November 30, 2012, 40,000 Shares were created for $1,116,104 million and 0 Shares were redeemed for $0. On November 30, 2012, 644,000 Shares were outstanding for a market capitalization of $18.135 million.
(c) The following table summarizes the redemptions by Authorized Participants during the three months ended November 30, 2012:
| Total Number of Shares Redeemed |
Average Price Paid per Share | |
| 0 | Not Applicable |
| ITEM 3. | DEFAULTS UPON SENIOR SECURITIES. |
None.
| ITEM 4. | MINE SAFETY DISCLOSURES. |
None.
| ITEM 5. | OTHER INFORMATION. |
None.
| ITEM 6. | EXHIBITS. |
| 31.1 | Certification required under Exchange Act Rules 13a-14 and 15d-14 (filed herewith) |
| 31.2 | Certification required under Exchange Act Rules 13a-14 and 15d-14 (filed herewith) |
| 32.1 | Certification of Chief Executive Officer pursuant to 18 U.S.C. Section 1350 as adopted pursuant to Section 906 of the Sarbanes-Oxley Act of 2002 (furnished herewith) |
| 32.2 | Certification of Principal Financial Officer pursuant to 18 U.S.C. Section 1350 as adopted pursuant to Section 906 of the Sarbanes-Oxley Act of 2002 (furnished herewith) |
34
Table of Contents
Pursuant to the requirements of the Securities Exchange Act of 1934, the Registrant has duly caused this report to be signed on its behalf by the undersigned, thereunto duly authorized.
| By: | BNP Paribas Quantitative Strategies, LLC, | |||||||
| Managing Owner of the Registrant | ||||||||
| By: | /s/ Bruno d’Illiers | |||||||
| Name: | Bruno d’Illiers | |||||||
| Title: | Director | |||||||
| Dated: January 14, 2013 | By: | /s/ M. Andrews Yeo | ||||||
| Name: | M. Andrews Yeo | |||||||
| Title: | Chief Executive Officer | |||||||
35
Table of Contents
| Exhibit Number |
Description of Document |
Page Number |
||||
| 31.1 | Certification required under Exchange Act Rules 13a-14 and 15d-14 (filed herewith) | E-2 | ||||
| 31.2 | Certification required under Exchange Act Rules 13a-14 and 15d-14 (filed herewith) | E-3 | ||||
| 32.1 | Certification of Chief Executive Officer pursuant to 18 U.S.C. Section 1350 as adopted pursuant to Section 906 of the Sarbanes-Oxley Act of 2002 (furnished herewith) | E-4 | ||||
| 32.2 | Certification of Principal Financial Officer pursuant to 18 U.S.C. Section 1350 as adopted pursuant to Section 906 of the Sarbanes-Oxley Act of 2002 (furnished herewith) | E-5 | ||||
| 101.INS | XBRL Instance Document | |||||
| 101.SCH | XBRL Schema Document | |||||
| 101.CAL | XBRL Calculation Linkbase Documents | |||||
| 101.DEF | XBRL Taxonomy Extension Definition Linkbase Document | |||||
| 101.LAB | XBRL Labels Linkbase Documents | |||||
| 101.PRE | XBRL Presentation Linkbase Documents | |||||