Attached files
| file | filename |
|---|---|
| 8-K - FORM 8-K - Howmet Aerospace Inc. | d466244d8k.htm |
| EX-99.1 - TRANSCRIPT OF ALCOA INC. FOURTH QUARTER 2012 EARNINGS CALL - Howmet Aerospace Inc. | d466244dex991.htm |
 4
Quarter Earnings Conference
January 8, 2013
Exhibit 99.2
[Alcoa Logo]
th |
 Cautionary Statement
2
[Alcoa Logo]
Forward-Looking Statements
This presentation contains statements that relate to future events and expectations and as
such constitute forward-looking statements. Forward-looking statements include those
containing such words as “anticipates,” “estimates,”
“expects,” “forecasts,” “intends,” “outlook,” “plans,” “projects,” “should,” “targets,” “will,” or other words of similar meaning. All
statements that reflect Alcoa’s expectations, assumptions, or projections about the
future other than statements of historical fact are forward-looking statements, including, without
limitation, forecasts concerning global demand growth for aluminum, end-market
conditions, supply/demand balances, and growth opportunities for aluminum in automotive,
aerospace and other applications, trend projections, targeted financial results or operating
performance, and statements about Alcoa’s strategies, outlook, and business and
financial prospects. Forward-looking statements are subject to a number of known and
unknown risks, uncertainties, and other factors and are not guarantees of future
performance. Important factors that could cause actual results to differ materially from
those in the forward-looking statements include: (a) material adverse changes in aluminum
industry conditions, including global supply and demand conditions and fluctuations in
London Metal Exchange-based prices for primary aluminum, alumina, and other products,
and fluctuations in indexed-based and spot prices for alumina; (b) deterioration in
global economic and financial market conditions generally; (c) unfavorable changes in the
markets served by Alcoa, including automotive and commercial transportation, aerospace,
building and construction, distribution, packaging, defense, and industrial gas turbine; (d)
the impact of changes in foreign currency exchange rates on costs and results, particularly
the Australian dollar, Brazilian real, Canadian dollar, euro, and Norwegian kroner; (e)
increases in energy costs, including electricity, natural gas, and fuel oil, or the
unavailability or interruption of energy supplies; (f) increases in the costs of other raw materials,
including calcined petroleum coke, caustic soda, and liquid pitch; (g) Alcoa’s
inability to achieve the level of revenue growth, cash generation, cost savings, improvement in
profitability and margins, fiscal discipline, or strengthening of competitiveness and
operations (including moving its alumina refining and aluminum smelting businesses down on the
industry cost curves and increasing revenues in its Global Rolled Products and Engineered
Products and Solutions segments) anticipated from its restructuring programs and
productivity improvement, cash sustainability, and other initiatives; (h) Alcoa's inability
to realize expected benefits, in each case as planned and by targeted completion dates, from
sales of non-core assets, or from newly constructed, expanded, or acquired facilities,
such as the upstream operations in Brazil and the investments in hydropower projects in
Brazil, or from international joint ventures, including the joint venture in Saudi Arabia;
(i) political, economic, and regulatory risks in the countries in which Alcoa operates or sells
products, including unfavorable changes in laws and governmental policies, civil unrest, or
other events beyond Alcoa’s control; (j) the outcome of contingencies, including legal
proceedings, government investigations, and environmental remediation; (k) the business or
financial condition of key customers, suppliers, and business partners; (l) adverse
changes in tax rates or benefits; (m) adverse changes in discount rates or investment
returns on pension assets; (n) the impact of cyber attacks and potential information
technology or data security breaches; and (o) the other risk factors summarized in Alcoa's
Form 10-K for the year ended December 31, 2011, Forms 10-Q for the quarters ended
March 31, 2012, June 30, 2012 and September 30, 2012, and other reports filed with the
Securities and Exchange Commission. Alcoa disclaims any obligation to update publicly
any forward-looking statements, whether in response to new information, future events or
otherwise, except as required by applicable law. Non-GAAP Financial Measures
Some of the information included in this presentation is derived from
Alcoa’s consolidated financial information but is not presented in Alcoa’s financial statements prepared in
accordance with U.S. generally accepted accounting principles (GAAP). Certain of these data
are considered “non-GAAP financial measures” under SEC rules. These non-GAAP
financial measures supplement our GAAP disclosures and should not be considered an
alternative to the GAAP measure. Reconciliations to the most directly comparable GAAP
financial measures and management’s rationale for the use of the non-GAAP financial
measures can be found in the Appendix to this presentation and on our website at
www.alcoa.com under the “Invest” section. Any reference during the discussion
today to EBITDA means adjusted EBITDA, for which we have provided calculations and
reconciliations in the Appendix and on our website. |
 Chuck McLane
Executive Vice President and Chief Financial Officer
3
January 8, 2013
[Alcoa Logo] |
 4 Quarter 2012 Financial Overview
See appendix for reconciliations to GAAP and additional information
4
[Alcoa Logo]
Income
from
Continuing
Operations
of
$242
million,
or
$0.21
per
share;
Excluding
impact
of
restructuring
and
other
special
items:
•
Income
from
continuing
operations
of
$64
million,
or
$0.06
per
share
Revenue
at
$5.9
billion
Adjusted
EBITDA
of
$597
million
Midstream
and
Downstream
achieve
record
fourth
quarter
results
Positive
Free
Cash
Flow
of
$535
million
Days
Working
Capital
at
24
days,
an
all-time
low
Debt-to-Capital
of
35%,
Net
Debt-to-Capital
of
30%
Cash
on
hand
of
$1.9
billion
Net
Debt
of
$7.0
billion,
lowest
year
end
since
2006
th |
 Income Statement Summary
5
$ Millions, except per-share amounts
4Q11
3Q12
4Q12
Sequential
Change
Revenue
$5,989
$5,833
$5,898
$65
Cost of Goods Sold
$5,228
$5,266
$4,968
($298)
COGS % Revenue
87.3%
90.3%
84.2%
(6.1 % pts.)
Selling,
General Administrative, Other
$268
$234
$277
$43
SGA % Revenue
4.5%
4.0%
4.7%
0.7 % pts.
Other Income, Net
($40)
($2)
($345)
($343)
Restructuring and Other Charges
$232
$2
$60
$58
Effective Tax Rate
31.0%
15.9%
35.8%
19.9 % pts.
(Loss) Income from Continuing Operations
($193)
($143)
$242
$385
(Loss) Income Per Diluted Share
($0.18)
($0.13)
$0.21
$0.34
[Alcoa Logo] |
 [Alcoa
Logo] Restructuring and Other Special Items
See appendix for Adjusted Income reconciliation
6
$ Millions, except per-share amounts
3Q12
4Q12
Income Statement
Classification
Segment
(Loss)/Income
($143)
$242
(Loss)/Income
($0.13)
$0.21
Tapoco
Asset Sale
-
$161
Other Income, Net
Primary
Metals /
Corporate
Restructuring-Related
($2)
($54)
Restructuring
and
Other Charges
Corporate
Discrete Tax Items
($26)
$58
Income Taxes
Corporate
Mark-to-Market Energy Contracts
($3)
$12
Other Income, Net
Corporate
Interest Income
-
$8
Other Income, Net
Corporate
Massena
Fire
($9)
($7)
Revenue, COGS
and
Other
Income, Net
Primary
Metals/EPS
Environmental Reserve
($120)
-
COGS
Corporate
Litigation Reserve
($15)
-
COGS
Corporate
Special
Items
($175)
$178
Income
from
Continuing
Ops
excl
Special
Items
$32
$64
$0.03
$0.06
from
Continuing
Ops
Per
Diluted
Share
Income
per
Diluted
Share
excl
Special
Items |
 [Alcoa
Logo] 4th
Quarter 2012 vs. 3rd
Quarter 2012 Earnings Bridge
See appendix for Adjusted Income reconciliation
7
Income from Continuing Operations Excluding Restructuring & Other Special Items
($ millions) +$78m
-$1m
-$38m
64
32
14
Productivity
4Q 2012
Cost
Increases Curtailment
/ Other
37
Raw
Materials
13
Energy
Portovesme
7
3Q 2012
LME
79
1
25
Price
/Mix
8
Volume
34
Currency
th
rd
[Alcoa Logo] |
 [Alcoa
Logo] Alumina
8
1
Quarter Outlook
Alumina 4Q12 Results and 1Q13 Outlook
4Q 11
3Q 12
4Q 12
Production (kmt)
4,178
4,077
4,079
3
Party Shipments (kmt)
2,378
2,368
2,440
3
Party Revenue ($ Millions)
847
764
803
ATOI ($ Millions)
125
(9)
41
48%
of 3
party shipments on spot or alumina price
index with
30 day lag
for 2013
Production
and shipments decrease by 90 kmt
Crusher move
in Australia drives mining cost increase
of $5 million
Productivity
improvements continue
Higher
3
party shipments
driven by lower internal
shipments
API and spot pricing
more stable than LME aluminum
pricing
Productivity
of
$10 million
Higher
fuel oil
and
natural gas
prices
Working capital improved 1 day vs. prior year quarter
Productivity of $190 million
for full year 2012
4
Quarter Performance Bridge
4
Quarter Business Highlights
4
Quarter Results
4Q
2012
$41
Cost
Decr.
$9
Raw Mat.
$3
3Q
2012
-$9
Product.
$10
Energy
-$2
Price/ Mix
-$21
Volume
-$7
Currency
$6
LME
$52
Market
Performance
$ Millions
+$58m
$8m
-
th
th
th
st
rd
rd
rd
rd |
 9
Production decrease due to completed Italy curtailment
Price/Mix improvement as regional premiums rise
Productivity
of $11 million
Seasonal energy
price increases
Completed Tapoco Hydropower asset sale
Productivity of $245 million
for full year 2012
4
Quarter Results
4
Quarter Business Highlights
1
Quarter Outlook
Pricing
to follow 15 day lag
to LME
Production
and shipments decrease by 20 kmt
Carbon pricing
expected to remain level
Rockdale and Anglesea power
generation outages of
$15 million
Saudi Arabia JV
equity costs of $20 million
Primary Metals 4Q12 Results and 1Q13 Outlook
4Q 11
3Q 12
4Q 12
Production (kmt)
962
938
912
3
rd
Party Shipments (kmt)
805
768
768
3
rd
Party Revenue ($ Millions)
1,991
1,794
1,890
3
rd
Party Price ($/MT)
2,374
2,222
2,325
ATOI ($ Millions)
(32)
(14)
316
Quarter Performance Bridge
$ Millions
market
performance
4Q
2012
Tapoco
Sale
PV
Curtail
Cost
Decreases
Volume
Price
/Mix
3Q
2012
Prod-
uctivity
-
Currency
Energy
Raw
Materials
LME
th
th
st
[Alcoa Logo]
4
th |
 ATOI ($ Millions)
4Q 11
3Q 12
4Q 12
Global Rolled Products,
excl Russia, China & Other
32
89
62
Russia, China & Other
(6)
9
7
Total ATOI
26
98
69
Adjusted EBITDA/mt
225
395
344
4
th
Quarter Results
4
Quarter Business Highlights
1
Quarter Outlook
4
Quarter Performance Bridge
$6
$4
$69
$98
4Q 2012
Other Items
-$4
Cost Increase
-$8
Productivity
Price/Mix
Volume
-$27
3Q 2012
Record 4Q ATOI
and adjusted
EBITDA per metric ton
ATOI
up
165%
vs. year-over-year quarter
Seasonal decline
in Packaging volume
Aerospace
and automotive remained strong
Productivity
of
$6 million
Working capital improved 8 days vs. prior year quarter
Aerospace and automotive
demand expected to
remain strong
European and North America industrial flat
and
uncertain
Productivity
improvements continue
$ Millions
[Alcoa Logo]
Global Rolled Products
Global Rolled Products 4Q12 Results and 1Q13 Outlook
10
See appendix for Adjusted EBITDA reconciliation
th
th
st |
 [Alcoa
Logo] Engineered Products and Solutions
See appendix for Adjusted EBITDA reconciliation
11
Engineered Products and Solutions 4Q12 Results and 1Q13 Outlook
$ Millions
4Q 11
3Q 12
4Q 12
Party Revenue
1,355
1,367
1,348
ATOI
122
160
137
Adjusted EBITDA Margin
16.2%
20.3%
17.7%
Quarter Results
Quarter Outlook
4
Quarter Performance Bridge
Quarter Business Highlights
$ Millions
Record 4Q ATOI
and adjusted EBITDA margin
4Q
adjusted
EBITDA
margin
at
17.7%,
up
1.5
points
year-over-year
Year-over-year
ATOI
up
$15
million
on
$7
million
less
revenue
Productivity
of $2 million
Aerospace
market
remains
strong
European
Non-Residential
Construction
market
continues
to
decline
–
Normal
seasonal
decline
in
N.A.
market
Heavy
Duty
truck
market
flat
in
N.A.
and
Europe
Share gains
through innovation continue
across all
market sectors
Productivity
improvements continue
th
4
th
4
th
1
st
3
rd
$2
$137
-$2
-$4
-$12
-$6
-$1
$160 |
 [Alcoa
Logo] See appendix for Free Cash Flow and Net Debt-to-Capital
reconciliations 4 Quarter Cash Flow Overview
12
($ Millions)
4Q11
3Q12
4Q12
Net (Loss) Income
($163)
($175)
$257
DD&A
$368
$366
$363
Change in Working Capital
$797
$88
$539
Pension Contributions
($119)
($163)
($46)
Taxes / Other Adjustments
$259
$147
($180)
Cash from Operations
$1,142
$263
$933
Dividends to Shareholders
($33)
($32)
($33)
Change in Debt
$52
($273)
($692)
Distributions to Noncontrolling Interest
($4)
($1)
($24)
Contributions from Noncontrolling Interest
$33
$22
$39
Other Financing Activities
$1
$2
($2)
Cash from Financing Activities
$49
($282)
($712)
Capital Expenditures
($486)
($302)
($398)
Other Investing Activities
($97)
$40
$605
Cash from Investing Activities
($583)
($262)
$207
4Q12 FCF
$535 million
$1.9 billion
of cash
3 Day DWC
reduction vs.
4Q 2011
Quarter
2012 Cash Flow Overview
Debt-to-Cap
at 35%;
Net Debt-to-
Cap at 30%
th
4
th |
 [Alcoa
Logo] 13
2012 FULL YEAR RESULTS |
 [Alcoa
Logo] Executing and Delivering in a Challenging Environment
See appendix for Adjusted EBITDA reconciliation
14
Delivering Results
Productivity &
Overhead
Working Capital
Capital Spend
and Investments
Maintain
Debt-to-Capital
Target: $850m
Actual: $1.3b
Positive Free
Cash Flow
Target: 1.5 days
Actual: 3.5 days
Target: $1.7b
Actual: $1.4b
Target: 30%-35%
Actual: 34.8%
API
or
spot
pricing
net
benefit
of
$35M
4%
point
reduction
on
smelting
cost
curve
Record
annual
midstream
ATOI
of
$358M;
35%
YOY
improvement
Record
midstream
full
year
adjusted
EBITDA/mt
of
$390
Downstream
delivered
record
annual
ATOI
of
$612M;
14%
YOY
improvement
All-time
high
full
year
adjusted
EBITDA
margin
of
19.2%
for
downstream
Net
debt
at
$7.0
billion,
lowest
year
end
since
2006
Achieving Our Targets |
 [Alcoa
Logo] Taking Necessary Steps to Maintain Liquidity
15
See appendix for Free Cash Flow reconciliation
($ Millions)
2012
Cash from Operations
$1,497
Capital Expenditures
($1,261)
Free Cash Flow
$236
Saudi Arabia Investments
($164)
Proceeds from sale of assets
$615
$687 |
 [Alcoa Logo]
Generating Positive FCF Amid A Volatile Environment
16
See appendix for Free Cash Flow reconciliation
Free Cash Flow
($ millions)
-39
246
-506
656
164
526
-440
1,005
176
87
-22
761
-186
-90
-742
-409
535
2009
-$257
2010
$1,246
2011
$906
2012
$236 |
 [Alcoa Logo]
Exceeding $850 Million Productivity and Overhead Target
*All figures are pretax and pre-minority interest. 2009/2010 represent net
productivity; 2011/2012 represent gross productivity 17
1
5,542
1,291
1,099
742
2,410
Total
2012
2011
2010
2009
Alcoa Productivity ($millions)* |
 [Alcoa Logo]
2012 Actions More Than Offset Significant Headwinds
See appendix for Adjusted Income reconciliation
18
Income from Continuing Operations Excluding Restructuring & Other Special Items ($ millions)
-$885m
+$1,005m
-$670m
262
812
Cost
Increases
/ Other
559
Raw
Materials
91
Energy
20
Productivity
786
Price
/Mix
127
Volume
92
Currency
129
LME
1,014
2011
2012 |
 [Alcoa Logo]
Achieving Sustainable Days Working Capital Reductions
See appendix for days working capital reconciliation
19
3 days
lower
Days Working Capital since Fourth Quarter 2008
3 days
lower
10 days
lower
33
33
32
38
38
39
43
44
41
48
50
55
20
25
30
35
40
45
50
55
43
30
33
27
-3
days
24
3 days
lower
Record Low
4
th
Quarter |
 [Alcoa Logo]
Significantly Strengthening Our Liquidity Position
See appendix for Net Debt-to-Capital reconciliation
20
Net debt
reduction of 29%
since 2008
Debt to Cap
Net Debt
Cash
Debt, Net Debt and Debt
-
to
-
Capital %
(millions)
Commitment to Investment Grade: Improving Net Debt Position
Net debt
reduction of 29%
since 2008
762
1,481
1,543
1,939
1,861
2009
9,819
8,338
2008
10,578
9,816
2012
8,829
6,968
2011
9,371
7,432
2010
9,165
7,622
38.7%
42.5%
34.9%
35.3%
34.8% |
 [Alcoa Logo]
New Aggressive Targets Set to Maximize Cash In 2013
21
Positive
Free Cash
Flow
Maintain 30%-35% Debt-to-Capital
Manage Growth Capital of $550M
Generate Productivity Gains of $750M
Target Saudi JV Investment of $350M
Overarching 2013 Financial Target
Control Sustaining Capital of $1.0B
Taking the right actions
2013 Targets: Key Actions to Execute 2013 Cash Sustainability Program
|
 [Alcoa Logo]
Successfully Executing for Cash; Continued Focus in 2013
22
Debt to Cap
Net Debt
Cash |
 [Alcoa Logo]
Klaus Kleinfeld
Chairman and Chief Executive Officer
January 8, 2013 |
 [Alcoa Logo]
Source: Alcoa analysis
2013 Market Conditions
24
Alcoa End Markets: Current Assessment of 2013 vs. 2012
North America
China
Global
Europe
Aerospace
Automotive
Heavy Truck &
Trailer
Beverage Can
Packaging
Commercial Building
and Construction
Industrial Gas
Turbine |
 [Alcoa Logo]
Aluminum Market Fundamentals Are Intact
25
2012: Aluminum Demand Strong and
Outpacing 10-Year Forecast
Global Aluminum Demand Grows in 2013
Inventories Stable; Financing Driving Premiums
Markets Essentially Balanced |
 [Alcoa Logo]
26
Source: Alcoa analysis, Brook Hunt, CRU, Harbor Intelligence
Short Term Demand Exceeding Long Term Expectations
In 2010, we said demand to roughly double…
25.4
46.1
Rest of World
China
2012
20.7
2010
39.5
23.0
16.5
2020 Forecast
39.5
Rest of World
China
73.4
35.7
37.7
2010
23.0
16.5
Million MT
12%
5%
9%
4%
Million MT
…run rate ahead of projection
6.5%
CAGR
8.0%
CAGR |
 [Alcoa Logo]
27
Source: Alcoa analysis, IMF, OECD
Global Aluminum Demand Accelerates to 7% in 2013
2013 Primary Aluminum Consumption (mmt), Annualized Growth (%) and Change (% pts)
by Region (1)
Other includes Middle East, Latin America ex Brazil, Eastern Europe and Rest of
World -1%
-2%
2013 Global Demand
(4Q12 estimate)
49.4 mmt
Annualized Growth
(4Q12 estimate)
1%
1%
3%
3%
2%
0%
1%
2%
Russia
Brazil
India
Other
(1)
Asia ex. China
North America
Europe
China
Change in Growth
(2012 to 2013 in % pts.)
1%
Global
1%
World ex China
2013 Global Demand
Growth Rate 7% vs. 2012
(World ex China 4%)
2012
2013E
China
Europe
North America
Asia ex. China
Other
(1)
India
Brazil
Russia
23.0
6.5
6.2
5.9
3.8
2.0
1.0
1.0
11%
9%
4%
4%
5%
7%
6%
7%
6%
9%
1%
4%
5%
6% |
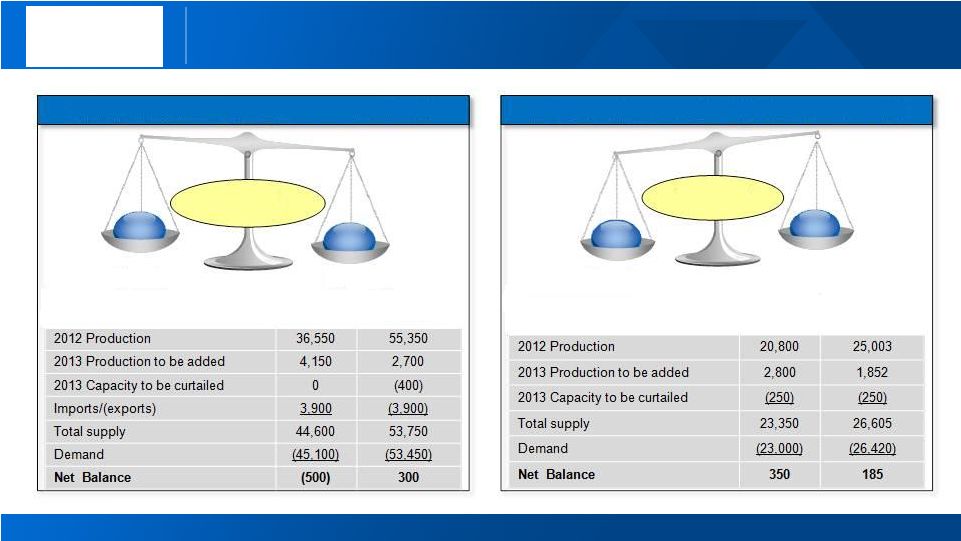 [Alcoa Logo]
2013E Aluminum Supply/Demand Balance
Supply
Demand
Surplus
535
‘000 mt
China
Rest of
World
2013E Alumina Supply/Demand Balance
‘000 mt
China
Rest of
World
Supply
Demand
Deficit
(200)
Source: Alcoa analysis, Brook Hunt, CRU, CNIA, NBS, Chinese Customs
Markets Essentially Balanced in 2013
28 |
 [Alcoa Logo]
29
Source: Alcoa analysis, LME, SHFE, CRU, IAI, Marubeni Corp.
Primary Aluminum Inventories Remain Below 2009 Peak
Decline 28 days
from the ’09 peak
Cancelled Warrants:
1.6M
tons
above year end 2011;
all-time record high
China
stocks: Only
7 days
of
global demand
Producer
stocks
: Record
low <
10
days
Days of
Consumption
Days of
Consumption
102 days
LME Price
$2,214/MT
Days of
Consumption
80 days
LME Price
$2,686/MT
Days of
Consumption
74 days
LME Price
$2,098/MT
Global Inventories
Global Inventories vs. LME Price Over Time |
 [Alcoa Logo]
Source: Month end pricing -
Platts Metals Week and Metal Bulletin
Regional Premiums Continue To Be Strong
30
0
50
100
150
200
250
300
$0
$50
$100
$150
$200
$250
$300
Regional Premiums over time
$ per metric
ton
$ per metric
ton |
 [Alcoa Logo]
Macro Events Continue to Drive Price Movements
Movement in LME Cash Prices After Economic Announcements
Nov 20
th
Greece Aid
Resolution
LME $1,952
Dec 7
th
Positive U.S. Labor
News
LME $2,078
Positive China PMI
LME $1,916
Dec 31
st
Improved Sentiment
Cliff Deal Will Be
Reached
LME $2,040
Dec 18
th
Uncertainty over Fiscal
Cliff Negotiations
LME $2,081
31
Source: LME, Bloomberg
Nov 22
nd |
 [Alcoa Logo]
2012/2013 Common Thread: Disciplined Execution
32
Solid operating performance in a volatile year
Achieving strategic investment milestones
Financial targets set to maximize cash |
 [Alcoa Logo]
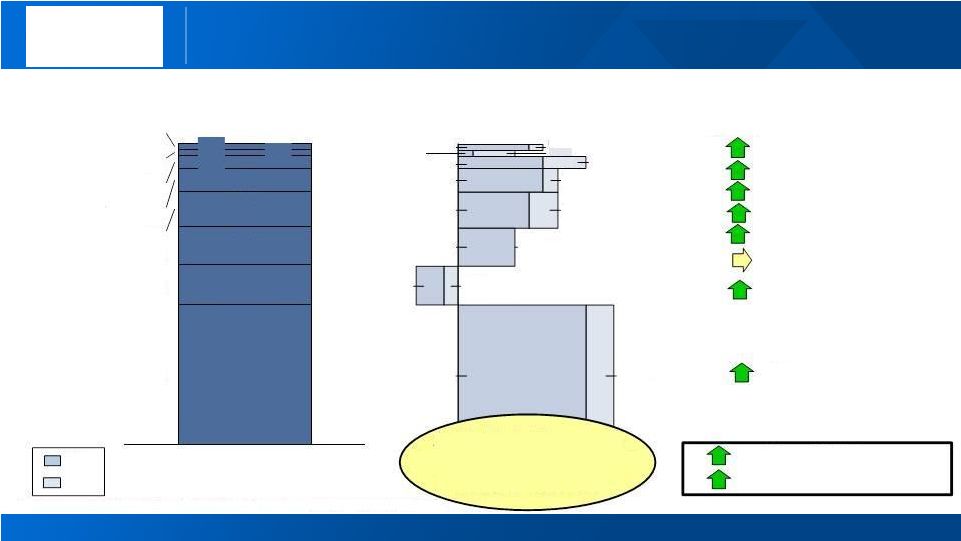
Alumina: Focused on Sustainable Cost Reductions
33
Clear Strategic Direction:
Improving cost competitiveness
0
100
200
300
400
500
600
700
0
20,000
40,000
60,000
80,000
100,000
120,000
Cumulative Production
(000MT)
Alcoa 2010
30
th
Percentile
Alumina Cost Curve
Alcoa 2015
23
rd
Percentile
Refining Cost Curve Holding Steady
$/mt
-7 points
Alcoa 2012
30
th
Percentile
Atlantic refinery curtailments: 390k mtpy
Creeping low-cost capacity: increased
production
in Australia by 400tpd in 2012
Productivity
gains: ~$190 million for
2012 and ~$390 million since 2010
First
concrete
pour
Saudi
Arabia
refinery in February 2012
2012 Strategic Actions
Progress on energy solutions in Spain
at |
 [Alcoa Logo]
Primary Metals: Moving Down the Cost Curve
34
Smelting Cost Curve Down 4% Points
-10 points
Clear Strategic Direction: Improving cost competitiveness
Curtailments:
240k mtpy
in Spain and Italy
Permanent
closures: 291k mtpy
Securing
energy solutions:
Power contracts for Mt. Holly and Intalco
Estreito
hydro electric dam
commissioned
Brazilian
regulatory improvements
Spanish
energy framework implemented
and ~
$480 million
since 2010
2012 Strategic Actions
0
500
1,000
1,500
2,000
2,500
3,000
3,500
0
20,000
40,000
60,000
Cumulative Production (000MT)
Alcoa 2015
41
st
Percentile
Alcoa 2010
51
st
Percentile
Aluminum Cost Curve
$/mt
Alcoa 2012
47
th
Percentile
Saudi Arabia JV First Hot Metal achieved
in December 2012
Productivity
gains:
~
$245 million
for 2012
Tapoco
sale
: ~
$600 million
gross proceeds
in the U.S. |
 [Alcoa Logo]
Global Rolled Products: Generating Record Margins
See appendix for Adjusted EBITDA reconciliations
35
273
253
249
276
226
201
108
119
314
327
390
2002
2003
2004
2005
2006
2007
2008
2009
2010
2011
2012
Revenue growth from new products and share gains
GRP-Growing profitability at record levels
$ Billions
Adjusted EBITDA per MT
10-YR Average ~ $235/MT
$7.6
2013 Target
Normalized
$8.4b
2012
Actual
$7.4b
2010
Actual
$6.3b
$2,019
$2,143**
** 2010 LME price of $2,143 assumed to normalize 2013 target
LME:
$2,143
Midstream Strategy: Profitable Growth
* $1.5 billion revenue growth from share gains and new products and $1.0 billion
revenue growth from metal and market |
 [Alcoa Logo]
Engineered Products & Solutions: Growing Profitably
See appendix for Adjusted EBITDA reconciliations
36
Downstream Strategy: Profitable Growth
Record margins exceeding historical levels
Adjusted EBITDA Margin
$ Billions
8%
9%
12%
11%
12%
13%
15%
13%
17%
18%
19%
2002
2003
2004
2005
2006
2007
2008
2009
2010
2011
2012
2013
$5.6
2012
$5.5
2010
$4.6
$6.2
Markets
Revenue growth from share gains and innovation
* $1.0 billion revenue growth from share gains and innovation and $600 million revenue
growth from the market |
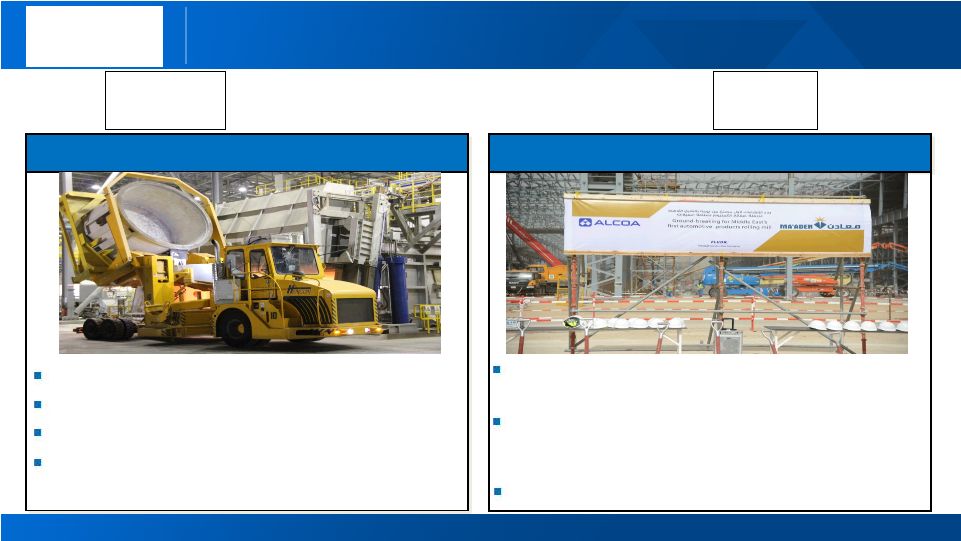  [Alcoa
Logo] Saudi Arabia JV: Achieving Significant Milestones
37
[Alcoa Logo]
Achieved smelter First Hot Metal
Auto capability groundbreaking
Lowest cost, integrated aluminum facility in the world
Successful commissioning of first smelting pots First hot metal in 25 months from
first concrete Expected to produce ~250k tons in 2013
Contributes 2% point reduction on the smelting cost curve
Integrated
rolling and surface treatment
complex
Expanding
capability
to produce up to
100k tons
of downstream products, including
automotive
heat-treated and non-heat-treated sheet
Production
planned to start at the
end of 2014
[Ma’aden Logo] |
 [Alcoa Logo]
Focus Remains on Cash In 2013
38
Positive
Free Cash
Flow
Maintain 30%-35% Debt-to-Capital
Manage Growth Capital of $550M
Generate Productivity Gains of $750M
Target Saudi JV Investment of $350M
Overarching 2013 Financial Target
Control Sustaining Capital of $1.0B
Taking the right actions
Key Actions to Execute 2013 Cash Sustainability Program
|
 [Alcoa Logo]
Market and Fundamentals Intact; Sentiment Moves Price
39 |
 [Alcoa Logo]
Executing Mid-Term Strategy; Continued Cash Focus
40 |
 41
[Alcoa Logo] |
 [Alcoa Logo]
Kelly Pasterick
Director, Investor Relations
Alcoa
390 Park Avenue
New York, NY 10022-4608
Telephone: (212) 836-2674
www.alcoa.com
Additional Information
42 |
 [Alcoa Logo]
Annual Sensitivity Summary
Currency Annual Net Income Sensitivity
+/-
$100/MT = +/-
$240 million
LME Aluminum Annual Net Income Sensitivity
Australian $
+/-
$11 million
per 0.01 change in USD / AUD
Brazilian $
+/-
$ 3 million
per 0.01 change in BRL / USD
Euro €
+/-
$ 2 million
per 0.01 change in USD / EUR
Canadian $
+/-
$ 5 million
per 0.01 change in CAD / USD
Norwegian Kroner
+/-
$ 5 million
per 0.10 change in NOK / USD
43 |
 [Alcoa Logo]
Revenue Change by Market
0%
1%
(1%)
(7%)
(4%)
5%
(8%)
37%
5%
5%
3%
7%
5%
(11%)
2%
8%
6%
(17%)
(5%)
(5%)
4Q’12 Third-Party Revenue
Sequential
Change
Year-Over-Year
Change
44
16%
3%
6%
5%
8%
2%
13%
2%
13%
32%
Aerospace
Automotive
B&C
Comm. Transport
Industrial Products
IGT
Packaging
Distribution/Other*
Alumina
Primary Metals |
 [Alcoa Logo]
Reconciliation of ATOI to Consolidated Net (Loss) Income
Attributable to Alcoa
45
(in millions)
4Q
11
2011
1
Q
12
2
Q12
3
Q
12
4
Q
12
20
12
$
$
$
$
$
$
$
Unallocated amounts (net of tax):
Impact of LIFO
Interest expense
Noncontrolling interests
Corporate expense
Restructuring and other charges
Discontinued operations
Other
Alcoa
$
$
$
$
$
$
$
235
(7)
(81)
32
(62)
(2)
–
(258)
(143)
563
8
(78)
(15)
(87)
(56)
–
(93)
242
1,369
20
(319)
29
(282)
(75)
–
(551)
191
275
19
(80)
17
(69)
(10)
–
(154)
(2)
296
–
(80)
(5)
(64)
(7)
–
(46)
94
1,893
(38)
(340)
(194)
(290)
(196)
(3)
(221)
611
241
11
(81)
(28)
(71)
(161)
2
(104)
(191)
Consolidated net (loss) income attributable to
Total segment ATOI |
 [Alcoa Logo]
Reconciliation
of Adjusted Income
46
(Loss) income from continuing operations attributable to Alcoa – as adjusted is a non-GAAP
financial measure. Management believes that this measure is meaningful to investors because management reviews the operating results of Alcoa excluding the impacts of restructuring and other charges, discrete
tax items, and other special items (collectively, “special items”). There can be no
assurances that additional special items will not occur in future periods. To compensate for this limitation, management believes that it is appropriate to consider both (Loss) income from continuing operations attributable to
Alcoa determined under GAAP as well as (Loss) income from continuing operations attributable to Alcoa
– as adjusted. * Discrete tax items include the following:
•
for the quarter ended December 31, 2012, a benefit related to the interim period treatment of
losses in jurisdictions for which no tax benefit was recognized during the nine months ended September 30, 2012 ($39); a benefit for a capital loss on an investment ($13); and a net benefit for other
miscellaneous items ($6);
•
for the quarter ended September 30, 2012, an unfavorable impact related to the interim period
treatment of losses in jurisdictions for which no tax benefit was recognized ($35), a benefit as a result of including the anticipated gain from the sale of the Tapoco Hydroelectric Project in the calculation of the
estimated annual effective tax rate ($12), and a net charge for other miscellaneous items ($3);
•
for the quarter ended December 31, 2011, charges for a tax rate change in Hungary and a tax law
change regarding the utilization of net operating losses in Italy ($8), a charge related to the 2010 change in the tax treatment of federal subsidies received related to prescription drug benefits provided
under certain retiree health benefit plans ($7), and a net benefit for other miscellaneous items ($3);
•
for the year ended December 31, 2012, a benefit for a capital loss on an investment ($13); a
benefit as a result of including the then anticipated gain from the sale of the Tapoco Hydroelectric Project in the calculation of the estimated annual effective tax rate applied to the results for the nine months
ended September 30, 2012 ($12); a charge related to prior year U.S. taxes on certain depletable assets
($8); and a net benefit for other miscellaneous items ($5); and •
for the year ended December 31, 2011, charges for a tax rate change in Hungary and a tax law
change regarding the utilization of net operating losses in Italy ($8); a charge related to the 2010 change in the tax treatment of federal subsidies received related to prescription drug benefits provided under
certain retiree health benefit plans ($7); a net benefit for adjustments made related to the filing of
2010 tax returns in various jurisdictions ($5); and a net benefit for other miscellaneous items ($8).
** Other special items include the following:
•
for the quarter ended December 31, 2012, a gain on the sale of the Tapoco Hydroelectric Project
($161: $275 is included in the Primary Metals segment and $(114) is included in Corporate); a net favorable change in certain mark-to-market energy derivative contracts ($12); interest income on an
escrow deposit ($8); and uninsured losses related to fire damage to the cast house at the Massena, NY
location ($7); •
for the quarter ended September 30, 2012, an increase in the environmental reserve mostly
related to the Grasse River remediation in Massena, NY and two new remediation projects at the smelter sites in Baie Comeau, Quebec, Canada and Mosjøen, Norway ($120), a litigation reserve ($15),
uninsured losses related to fire damage to the cast house at the Massena, NY location ($9), and a net
unfavorable change in certain mark-to-market energy derivative contracts ($3); •
for the quarter ended December 31, 2011, a gain on the sale of land in Australia ($18),
uninsured losses, including costs related to flood damage to a plant in Pennsylvania caused by Hurricane Irene, ($14), a net favorable change in certain mark-to-market energy derivative contracts ($8), and the write
off of inventory related to the permanent closure of a smelter in the U.S ($4);
•
for the year ended December 31, 2012, a gain on the sale of the Tapoco Hydroelectric Project
($161: $275 is included in the Primary Metals segment and $(114) is included in Corporate); a net increase in the environmental reserve related to the Grasse River remediation in Massena, NY, remediation
at two former locations, East St. Louis, IL and Sherwin, TX, and two new remediation projects at the
smelter sites in Baie Comeau, Quebec, Canada and Mosjøen, Norway ($133); a litigation reserve ($33); uninsured losses related to fire damage to the cast house at the Massena, NY location ($28);
interest income on an escrow deposit ($8); and a net favorable change in certain mark-to-market
energy derivative contracts ($5); and •
for the year ended December 31, 2011, a net favorable change in certain mark-to-market
energy derivative contracts ($36); a net charge comprised of expenses for the early repayment of Notes set to mature in 2013 due to the premiums paid under the tender offers and call option and gains from the
termination of related “in-the-money” interest rate swaps ($32); uninsured losses,
including costs related to flood damage to a plant in Pennsylvania caused by Hurricane Irene, ($25); a gain on the sale of land in Australia ($18); costs related to acquisitions of the aerospace fastener business of
TransDigm Group Inc. and full ownership of carbothermic smelting technology from ORKLA ASA ($8); and
the write off of inventory related to the permanent closure of a smelter in the U.S ($4).
(in millions, except per-
share amounts)
(Loss) Income
Diluted EPS
Quarter ended
Year ended
Quarter ended
Year ended
December 31,
September 30,
December 31,
December 31,
December 31,
December 31,
September 30,
December 31,
December 31,
December 31,
2011
2012
2012
2011
2012
2011
2012
2012
2011
2012
Net (loss) income
attributable to Alcoa
$ (191)
$ (143)
$ 242
$ 611
$ 191
$ (0.18)
$ (0.13)
$ 0.21
$ 0.55
$ 0.18
Income (loss) from
discontinued
operations
2
–
–
(3)
–
(Loss) income from
continuing
operations
attributable to Alcoa
(193)
(143)
242
614
191
(0.18)
(0.13)
0.21
0.55
0.18
Restructuring and other
charges
155
2
54
181
73
Discrete tax items*
12
26
(58)
2
(22)
Other special items**
(8)
147
(174)
15
20
(Loss) income from
continuing operations
attributable to Alcoa
-
as adjusted
$ (34)
$ 32
$ 64
$ 812
$ 262
(0.03)
0.03
0.06
0.72
0.24 |
 [Alcoa Logo]
Reconciliation
of Alcoa Adjusted EBITDA
47
($ in millions)
2002
2003
2004
2005
2006
2007
2008
2009
2010
2011
2012
4Q11
3Q12
4Q12
Net
income (loss)
attributable to
Alcoa
420
938
1,310
1,233
2,248
2,564
(74)
(1,151)
$
254
611
191
$
(191)
(143)
$
242
Add:
Net income (loss)
attributable to
noncontrolling
interests
181
212
233
259
436
221
61
138
194
(29)
28
(32)
15
Cumulative effect
of accounting
changes
(34)
47
–
2
–
–
–
–
–
–
–
–
–
–
Loss (income)
from discontinued
operations
101
–
27
50
(22)
250
303
166
8
3
–
(2)
–
–
Provision (benefit)
for income taxes
307
367
546
464
853
1,623
342
(574)
148
255
162
(74)
(33)
143
Other (income)
expenses, net
(175)
(278)
(266)
(478)
(236)
(1,920)
(59)
(161)
5
(87)
(341)
(40)
(2)
(345)
Interest expense
350
314
271
339
384
401
407
470
494
524
490
125
124
Restructuring and
other charges
398
(28)
(29)
266
507
268
939
237
207
281
87
232
2
60
Provision for
depreciation,
depletion, and
amortization
1,037
1,227
1,252
1,244
1,234
1,311
1,450
1,479
1,460
367
366
362
Adjusted EBITDA
2,585
2,682
3,234
3,362
4,795
359
2,704
3,260
2,020
445
282
597
Sales
18,879
21,370
28,950
26,901
18,439
21,013
24,951
23,700
5,833
5,898
Adjusted EBITDA
Margin
14%
14%
19%
16%
12%
2%
13%
13%
9%
7%
5%
10%
17,691
15%
1,110
1,142
15%
24,149
120
3,313
5,422
5,989
29,280
Alcoa’s definition of Adjusted EBITDA (Earnings before interest, taxes, depreciation, and
amortization) is net margin plus an add-back for depreciation, depletion, and amortization. Net margin is equivalent to Sales
minus the following items: Cost of goods sold; Selling, general administrative, and other expenses;
Research and development expenses; and Provision for depreciation, depletion, and amortization. Adjusted EBITDA
is a non-GAAP financial measure. Management believes that this measure is meaningful to
investors because Adjusted EBITDA provides additional information with respect to Alcoa’s operating performance and the
Company’s ability to meet its financial obligations. The Adjusted EBITDA presented may not
be comparable to similarly titled measures of other companies. $
$
$
$
$
$
$
$
$
$
$
$
$
$
$
$
$
$
$
$
$
$
$
$
$
$
$
$
$
$
$
$
$
365
$
$
$
$
$
$ |
 [Alcoa Logo]
Reconciliation
of Alumina Adjusted EBITDA
48
($ in millions, except
per metric ton
amounts
)
2002
2003
2004
2005
2006
2007
2008
2009
2010
2011
2012
4Q11
3Q12
4Q12
After-tax operating
income (ATOI)
$ 315
$ 415
$ 632
$ 682
$ 1,050
$ 956
$
727
$ 112
$ 301
$ 607
$ 90
$ 125
$ (9)
$ 41
Add:
Depreciation,
depletion, and
amortization
139
147
153
172
192
267
268
292
406
444
455
112
120
107
Equity (income)
loss
(1)
–
(1)
–
2
(1)
(7)
(8)
(10)
(25)
(5)
2
(2)
(1)
Income taxes
130
161
240
246
428
340
277
(22)
60
179
(27)
33
(22)
2
Other
(14)
(55)
(46)
(8)
(6)
2
(26)
(92)
(5)
(44)
(8)
(43)
(1)
(4)
Adjusted EBITDA
$ 569
$ 668
$ 978
$ 1,092
$ 1,666
$
1,564
$ 1,239
$ 282
$ 752
$ 1,161
$ 505
$ 229
$
86
$ 145
Production
(thousand metric
tons) (kmt)
13,027
13,841
14,343
14,598
15,128
15,084
15,256
14,265
15,922
16,486
16,342
4,178
4,077
4,079
Adjusted EBITDA/
Production ($ per
metric ton)
$ 44
$ 48
$ 68
$ 75
$ 110
$ 104
$ 81
$ 20
$ 47
$ 70
$ 31
$ 55
$ 21
$ 36
Alcoa’s definition of Adjusted EBITDA (Earnings before interest, taxes, depreciation, and
amortization) is net margin plus an add-back for depreciation, depletion, and amortization. Net margin is equivalent to Sales
minus the following items: Cost of goods sold; Selling, general administrative, and other expenses;
Research and development expenses; and Provision for depreciation, depletion, and amortization. The Other line
in the table above includes gains/losses on asset sales and other nonoperating items. Adjusted
EBITDA is a non-GAAP financial measure. Management believes that this measure is meaningful to investors
because Adjusted EBITDA provides additional information with respect to Alcoa’s operating
performance and the Company’s ability to meet its financial obligations. The Adjusted EBITDA presented may not be
comparable to similarly titled measures of other companies. |
 [Alcoa Logo]
Reconciliation
of Primary Metals Adjusted EBITDA
($ in millions, except
per metric ton
amounts)
2002
2003
2004
2005
2006
2007
2008
2009
2010
2011
2012
4Q11
3Q12
4Q12
After-tax operating
income (ATOI)
$ 650
$ 657
$ 808
$ 822
$ 1,760
$ 1,445
$ 931
$ (612)
$ 488
$ 481
$ 309
$ (32)
$ (14)
$ 316
Add:
Depreciation,
depletion, and
amortization
300
310
326
368
395
410
503
560
571
556
532
136
130
134
Equity (income) loss
(44)
(55)
(58)
12
(82)
(57)
(2)
26
(1)
7
27
3
5
11
Income taxes
266
256
314
307
726
542
172
(365)
96
92
106
(37)
(19)
157
Other
(47)
12
20
(96)
(13)
(27)
(32)
(176)
(7)
2
(422)
1
2
(423)
Adjusted EBITDA
$ 1,125
$ 1,180
$ 1,410
$ 1,413
$ 2,786
$ 2,313
$ 1,572
$ (567)
$ 1,147
$ 1,138
$ 552
$ 71
$ 104
$ 195
Production
(thousand metric
tons) (kmt)
3,500
3,508
3,376
3,554
3,552
3,693
4,007
3,564
3,586
3,775
3,742
962
938
912
Adjusted EBITDA /
Production ($ per
metric ton)
$ 321
$ 336
$ 418
$ 398
$ 784
$ 626
$ 392
$ (159)
$ 320
$ 301
$ 148
$ 74
$ 111
$ 214
Alcoa’s definition of Adjusted EBITDA (Earnings before interest, taxes, depreciation, and
amortization) is net margin plus an add-back for depreciation, depletion, and amortization. Net margin is equivalent to Sales minus the following
items: Cost of goods sold; Selling, general administrative, and other expenses; Research and
development expenses; and Provision for depreciation, depletion, and amortization. The Other line in the table above includes gains/losses on
asset sales and other nonoperating items. Adjusted EBITDA is a non-GAAP financial
measure. Management believes that this measure is meaningful to investors because Adjusted EBITDA provides additional information with respect to
Alcoa’s operating performance and the Company’s ability to meet its financial
obligations. The Adjusted EBITDA presented may not be comparable to similarly titled measures of other companies.
49 |
 [Alcoa Logo]
Reconciliation of Global Rolled Products Adjusted
EBITDA
($ in millions, except
per metric ton
amounts)
2002
2003
2004
2005
2006
2007
2008
2009
2010
2011
2012
4Q11
3Q12
4Q12
After-tax operating
income (ATOI)
$ 225
$ 222
$ 254
$ 278
$ 233
$ 178
$ (3)
$ (49)
$ 220
$ 266
$ 358
$ 26
$ 98
$ 69
Add:
Depreciation,
depletion, and
amortization
184
190
200
220
223
227
216
227
238
237
229
58
57
58
Equity loss
4
1
1
–
2
–
–
–
–
3
6
3
1
2
Income taxes
90
71
75
121
58
92
35
48
92
104
167
10
44
31
Other
(8)
(5)
1
1
20
1
6
(2)
1
1
(2)
1
(2)
–
Adjusted EBITDA
$ 495
$ 479
$ 531
$ 620
$ 536
$ 498
$ 254
$ 224
$ 551
$ 611
$ 758
$ 98
$ 198
$ 160
Total shipments
(thousand metric
tons) (kmt)
1,814
1,893
2,136
2,250
2,376
2,482
2,361
1,888
1,755
1,866
1,943
436
501
465
Adjusted EBITDA
/
Total shipments
($ per metric ton)
$ 273
$ 253
$ 249
$ 276
$ 226
$ 201
$ 108
$ 119
$ 314
$ 327
$ 390
$ 225
$ 395
$ 344
Alcoa’s definition of Adjusted EBITDA (Earnings before interest, taxes, depreciation, and
amortization) is net margin plus an add-back for depreciation, depletion, and amortization. Net margin is equivalent to Sales minus the following
items: Cost of goods sold; Selling, general administrative, and other expenses; Research and
development expenses; and Provision for depreciation, depletion, and amortization. The Other line in the table above includes gains/losses
on asset sales and other nonoperating items. Adjusted EBITDA is a non-GAAP financial
measure. Management believes that this measure is meaningful to investors because Adjusted EBITDA provides additional information with
respect to Alcoa’s operating performance and the Company’s ability to meet its financial
obligations. The Adjusted EBITDA presented may not be comparable to similarly titled measures of other companies.
50 |
 [Alcoa Logo]
Reconciliation of Engineered Products and Solutions
Adjusted EBITDA
51
($ in millions)
2002
2003
2004
2005
2006
2007
2008
2009
2010
2011
2012
4Q11
3Q12
4Q12
After-tax operating
income (ATOI)
$ 63
$ 124
$ 156
$ 271
$ 365
$ 435
$ 533
$ 315
$ 415
$ 539
$ 612
$ 122
$ 160
$ 137
Add:
Depreciation,
depletion, and
amortization
150
166
168
160
152
163
165
177
154
158
158
39
39
40
Equity loss
(income)
–
–
–
–
6
–
–
(2)
(2)
(1)
–
–
–
–
Income taxes
39
55
65
116
155
192
222
139
195
260
297
59
79
69
Other
35
11
106
(11)
(2)
(7)
2
1
–
(1)
(8)
–
(1)
(7)
Adjusted EBITDA
$ 287
$ 356
$ 495
$ 536
$ 676
$ 783
$ 922
$ 630
$ 762
$ 955
$ 1,059
$ 220
$ 277
$ 239
Total sales
$ 3,492
$ 3,905
$ 4,283
$ 4,773
$ 5,428
$ 5,834
$ 6,199
$ 4,689
$ 4,584
$ 5,345
$ 5,525
$ 1,355
$ 1,367
$ 1,348
Adjusted EBITDA
Margin
8%
9%
12%
11%
12%
13%
17%
18%
19%
16%
20%
18%
Alcoa’s definition of Adjusted EBITDA (Earnings before interest, taxes, depreciation, and
amortization) is net margin plus an add-back for depreciation, depletion, and amortization. Net margin is equivalent to
Sales minus the following items: Cost of goods sold; Selling, general administrative, and other
expenses; Research and development expenses; and Provision for depreciation, depletion, and amortization. The
Other line in the table above includes gains/losses on asset sales and other nonoperating items.
Adjusted EBITDA is a non-GAAP financial measure. Management believes that this measure is meaningful to
investors because Adjusted EBITDA provides additional information with respect to Alcoa’s
operating performance and the Company’s ability to meet its financial obligations. The Adjusted EBITDA presented
may not be comparable to similarly titled measures of other companies.
15%
13% |
 [Alcoa Logo]
Reconciliation
of Free Cash Flow
52
(in
millions)
Quarter ended
Year ended
March 31,
2011
June 30,
2011
September 30,
2011
December 31,
2011
March 31,
2012
June 30,
2012
September30,
2012
December 31,
2012
December 31,
2011
December 31,
2012
Cash from
operations
$
(236)
$ 798
$ 489
$ 1,142
$ (236)
$ 537
$ 263
$ 933
$ 2,193
$ 1,497
Capital
expenditures
(204)
(272)
(325)
(486)
(270)
(291)
(302)
(398)
(1,287)
(1,261)
Free cash
flow
$ (440)
$ 526
$ 164
$ 656
$ (506)
$ 246
$ (39)
$ 535
$ 906
$ 236
Free Cash Flow is a non-GAAP financial measure. Management believes that this measure is meaningful
to investors because management reviews cash flows generated from operations after taking into
consideration capital expenditures due to the fact that these expenditures are considered necessary to
maintain and expand Alcoa’s asset base and are expected to generate future cash flows from operations.
It is important to note that Free Cash Flow does not represent the residual cash flow available for
discretionary expenditures since other non-discretionary expenditures, such as mandatory debt service
requirements, are not deducted from the measure.
|
 [Alcoa Logo]
Reconciliation of Free Cash Flow, con’t
53
Cash from
operations
$ 608
$ (271)
$
$
184
$ 1,124
$ 199
$ 300
$ 392
$ 1,370
Capital
expenditures
Free cash
flow
328
$ (409)
$ (742)
$
(90)
$ (186)
$ 761
$ (22)
$ 87
$ 176
$ 1,005
(418)
(221)
(213)
(216)
(365)
(471)
(370)
(363)
(1,017)
Free Cash Flow is a non-GAAP financial measure. Management believes that this measure is
meaningful to investors because management reviews cash flows generated from operations after taking into consideration capital expenditures due to
the fact that these expenditures are considered necessary to maintain and expand Alcoa’s asset
base and are expected to generate future cash flows from operations. It is important to note that Free Cash Flow does not represent the residual
cash flow available for discretionary expenditures since other non-discretionary expenditures, such
as mandatory debt service requirements, are not deducted from the measure. Quarter ended
(in millions)
December 31,
2008
March 31,
2009
June 30,
2009
September 30,
2009
December 31,
2009
March 31,
2010
June 30,
2010
September 30,
2010
December 31,
2010 |
 [Alcoa Logo]
Days
Working Capital
54
($ in millions)
Quarter ended
December 31,
2011
March 31,
2012
June 30,
2012
September 30,
2012
December 31,
2012
Receivables from customers, less
allowances
$ 1,571
$ 1,526
$ 1,575
$ 1,619
$ 1,322
Add: Deferred
purchase price receivable*
–
254
141
81
71
Receivables from customers, less
allowances, as adjusted
1,571
1,780
1,716
1,700
1,393
Add: Inventories
2,899
3,097
3,051
2,973
2,825
Less: Accounts payable, trade
2,692
2,734
2,633
2,590
2,692
Working Capital
$ 1,778
$ 2,143
$ 2,134
$ 2,083
$ 1,526
Sales
$ 5,989
$ 6,006
$ 5,963
$ 5,833
$ 5,898
Days Working Capital
27
32
33
33
24
Days Working Capital = Working Capital divided by
(Sales/number of days in the quarter).
.
.
*
The deferred purchase price receivable relates to an arrangement to sell certain customer
receivables to a financial institution on a recurring basis. Alcoa is adding back
this receivable for the purposes of the Days Working Capital calculation. |
 [Alcoa Logo]
Reconciliation
of Net Debt
55
(in millions)
December 31,
2006
2007
2008
2009
2010
2011
2012
Short-term borrowings
$ 46
0
$ 563
$ 478
$ 176
$ 92
$ 62
$ 53
Commercial paper
340
856
1,535
–
–
224
–
Long-term debt due within
one year
510
202
56
669
231
445
465
Long-term debt, less amount
due within one year
5,909
6,371
8,509
8,974
8,842
8,640
8,311
Total debt
7,2
19
7,992
10,578
9,819
9,165
9,371
8,829
Less: Cash and cash
equivalents
Net debt
$ 6,71
3
$ 7,509
$ 9,816
$ 8,338
$ 7,622
$ 7,432
$ 6,968
Net debt is a non-GAAP financial measure. Management believes that this measure is meaningful
to investors because management assesses Alcoa’s leverage position after factoring in available cash that could be used to repay outstanding
debt.
506
483
762
1,481
1,543
1,939
1,861 |
 [Alcoa Logo]
Reconciliation
of Net Debt-to-Capital
56
($
in millions)
Debt-to-Capital
Cash and Cash
Net Debt-to-
Capital
Total Debt
$
Commercial paper
–
one year
465
due within one year
8,311
Numerator
1,861
$
6,968
Total Capital
Total debt
$
Total equity
Denominator
Ratio
December 31, 2012
Short-term borrowings
Long-term debt due within
Long-term debt, less amount
53
$
8,829
16,507
$
34.8%
$
1,861
$
23,475
29.7%
$
Net debt-to-capital is a non-GAAP financial measure. Management believes that this measure
is meaningful to investors because management assesses Alcoa’s leverage position after
factoring in available cash that could be used to repay outstanding debt.
8,829
25,336
Equivalents |
 [Alcoa Logo]
Composition of Upstream Production Costs
57
Refining Cost Structure
Smelting Cost Structure
1
Natural gas information corresponds to Point Comfort, as Australia is priced on a
rolling 16 quarter average Fuel Oil
14%
Natural gas
10%
Caustic
11%
Bauxite
23%
Conversion
42%
Alumina
32%
Carbon
15%
Power
25%
Materials
6%
Conversion
22%
Input Cost
Inventory flow
Pricing
convention
Annual ATOI
Sensitivity
Fuel oil
1 –
2 months
Prior month
$4m per $1/bbl
Natural gas
N/A
Spot
1
$16m per $1/GJ
1
Caustic soda
3 -
6 months
Spot & semi-
annual
$9m per
$10/DMT
Input Cost
Inventory flow
Pricing convention
Annual ATOI
Sensitivity
Coke
1 -
2 months
Spot, quarterly &
semi-annual
$9m per
$10/MT
Pitch
1 -
2 months
Spot, quarterly &
semi-annual
$2.5m per
$10/MT |