Attached files
| file | filename |
|---|---|
| EX-99.1 - THE PRESS RELEASE, DEEMED "FILED" UNDER THE SECURITIES EXCHANGE ACT OF 1934 - WELLS FARGO & COMPANY/MN | d450286dex991.htm |
| 8-K - FORM 8-K - WELLS FARGO & COMPANY/MN | d450286d8k.htm |
 4Q12 Quarterly Supplement
January 11, 2013
Exhibit 99.2 |
 Wells Fargo
4Q12 Supplement 1
Appendix
Pages 23-38
-
Non-strategic/liquidating loan portfolio risk reduction
24
-
Purchased credit-impaired (PCI) portfolios
25
-
PCI nonaccretable difference
26
-
PCI accretable yield
27
-
PCI accretable yield (Commercial & Pick-a-Pay)
28
-
Pick-a-Pay mortgage portfolio
29
-
Pick-a-Pay credit highlights
30
-
Real estate 1-4 family first mortgage portfolio
31
-
Home equity portfolio
32
-
Credit card portfolio
33
-
Auto portfolios
34
-
Student lending portfolio
35
Tier 1 common equity under Basel I
36
Tier 1 common equity under Basel III
(Estimated)
37
Forward-looking statements and
additional information
38
Table of contents
4Q12 Results
-
4Q12 Results
Page 2
-
2012 Results
3
-
Strong diversification
4
-
Selected 4Q12 items
5
-
Independent Foreclosure Review Settlement
6
-
Balance Sheet and credit overview
7
-
Income Statement overview
8
-
Loans
9
-
Deposits
10
-
Net interest income
11
-
Noninterest income
12
-
Noninterest expense and efficiency ratio
13
-
Environmentally-elevated costs
14
-
Community Banking
15
-
Wholesale Banking
16
-
Wealth, Brokerage and Retirement
17
-
Credit quality
18-19
-
Mortgage servicing
20
-
Capital
21
-
Summary –
strong 4Q12
22 |
 Wells Fargo
4Q12 Supplement 2
Record earnings of $5.1 billion, up 24% year-
over-year (YoY) and 3% linked quarter (LQ)
Record diluted earnings per common share of
$0.91, up 25% YoY and 3% LQ
Total revenue of $21.9 billion up 7% YoY and 3%
LQ on growth in noninterest income
Efficiency ratio of 58.8%
(1)
Pre-tax pre-provision profit
(2)
of $9.1 billion, up
12% YoY and down $49 million LQ
Strong credit performance
ROA = 1.46%, up 21 bps YoY and up 1 bp LQ
ROE = 13.35%, up 138 bps YoY and down
3 bps LQ
Capital levels remained strong
-
10.12% Tier 1 common equity ratio under Basel I
and estimated Tier 1 common equity ratio under
Basel III of 8.18%
(3)
4Q12 Results
Wells Fargo Net Income
($ in millions)
4,107
4,248
4,622
4,937
5,090
4Q11
1Q12
2Q12
3Q12
4Q12
(2) Pre-tax pre-provision profit (PTPP) is total revenue less noninterest
expense. Management believes PTPP is a useful financial measure because it enables
investors and others to assess the Company’s ability to generate capital to cover credit
losses through a credit cycle. (3) Estimated Basel III calculation based on management’s current interpretation of
the Basel III capital rules proposed by federal banking agencies in notices of proposed
rulemaking announced in June 2012. The proposed rules and interpretations and assumptions used in estimating Basel III calculations are
subject to change depending on final promulgation of Basel III capital rules. See pages
36-37 for additional information regarding Tier 1 common equity ratios. (1) Efficiency ratio defined as noninterest
expense divided by total revenue (net interest income plus noninterest income). |
 Wells Fargo
4Q12 Supplement 3
15.9
18.9
2011
2012
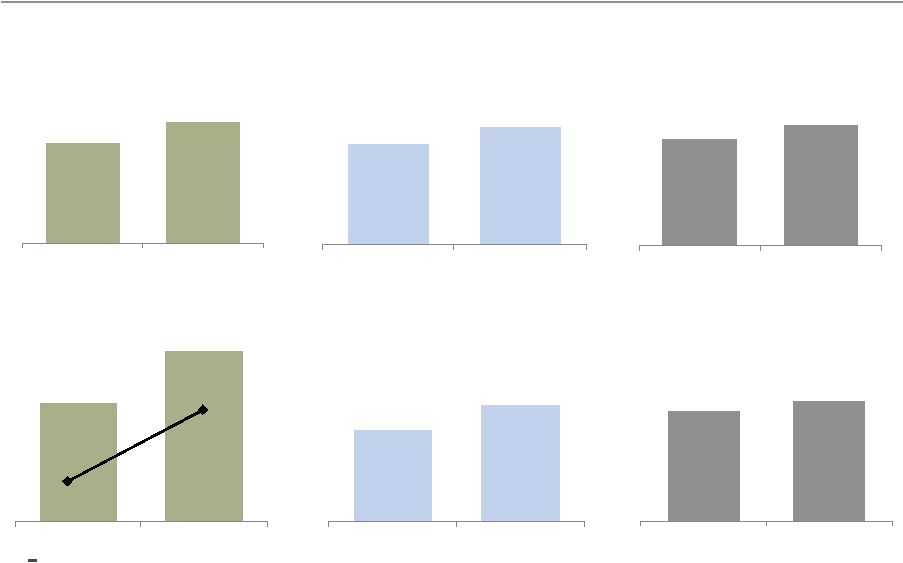
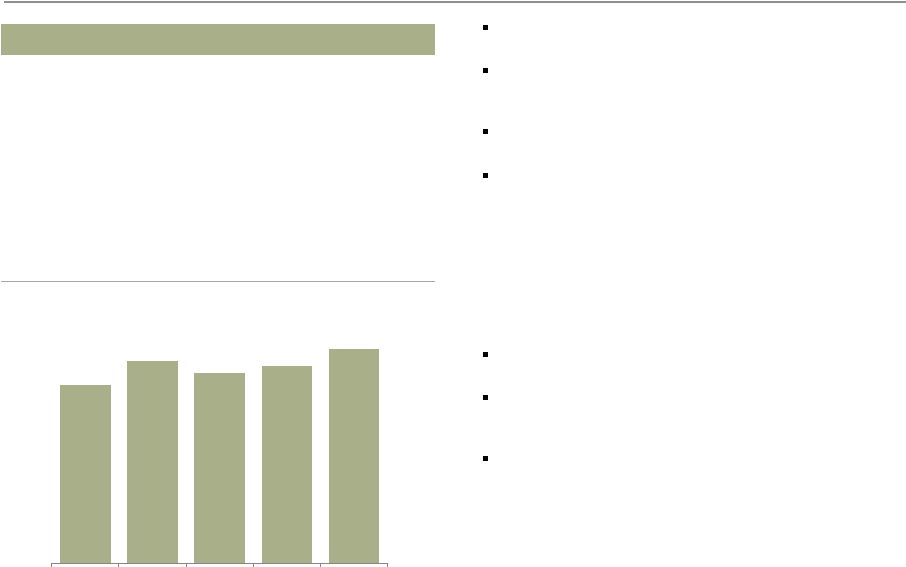
2012 Results
Revenue
($ in billions)
Net Income
($ in billions, except EPS)
Diluted earnings per common share
Period-end Loans
($ in billions)
Return on Assets
$2.82
$3.36
1.25%
1.41%
2011
2012
Return on Equity
11.93%
12.95%
2011
2012
769.6
799.6
2011
2012
Period-end Core Deposits
($ in billions)
872.6
945.7
2011
2012
80.9
86.1
2011
2012 |
 Wells Fargo
4Q12 Supplement 4
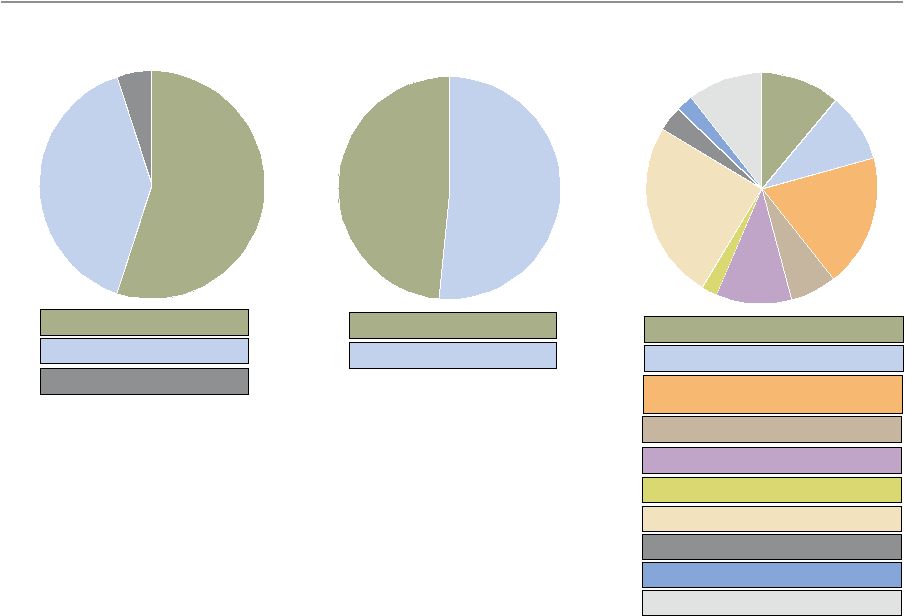
Balanced Spread and
Fee Income
Diversified Fee
Generation
Deposit Service Charges
11%
Card Fees
6%
Other Banking Fees
11%
Mortgage Servicing, net
2%
Insurance
3%
Net Gains from Trading
2%
Noninterest Income
52%
Net Interest Income
48%
Diversified Loan
Portfolio
Commercial Loans
40%
Consumer Loans
55%
Strong diversification
Foreign Loans
5%
Mortgage Orig./Sales, net
25%
Trust, Investment & IRA fees
10%
Commissions & All Other
Investment Fees
19%
Other
Noninterest
Income
(1)
55%
40%
5%
52%
48%
11%
10%
19%
6%
11%
2%
25%
3%
2%
11%
11%
All data is for 4Q12. (1) Other noninterest income includes net gains (losses) on debt
securities available for sale, equity investments, operating leases and all other
noninterest income. |
 Wells Fargo
4Q12 Supplement 5
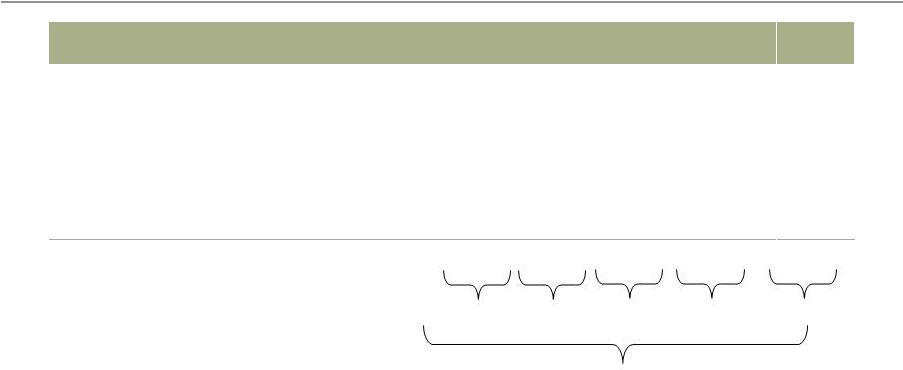
Selected 4Q12 items
(Pre-tax except for tax expense and EPS)
$ in millions
EPS
(1)
Comments
Noninterest
income:
Above-average
quarterly
equity
gains
(2)
393
$
0.05
$
Equity gains reflect strong business results including
the gain on the sale of Becker Underwood
Noninterest
expense:
Elevated operating losses
(644)
(0.09)
Incremental accrual to fully reserve for Wells
Fargo's costs associated with the Independent
Foreclosure Review Settlement and additional
remediation-related costs
Wells Fargo Foundation Contribution
(250)
(0.03)
Included in other noninterest expense
Taxes
Lower tax expense
332
0.06
Effective tax rate of 27.4% included a $332 million
benefit associated with the realization for tax
purposes of a previously written-down Wachovia life
insurance investment
4Q12
(1) 4Q12 effective tax rate of 27.4% used in the calculations of EPS. (2) 4Q12 net gains
from equity investments of $715 million were $393 million higher than previous seven quarter average net gains of $322 million.
Selected item and Financial Statement line affected
|
 Wells Fargo
4Q12 Supplement 6
Independent Foreclosure Review (IFR) Settlement
On 1/7/13, 10 servicers, including Wells Fargo, entered into settlement agreements with the OCC
and FRB As part of the settlement servicers have agreed to:
-
Make direct cash payments of $3.3 billion
-
Provide $5.2 billion in additional assistance, such as modifications to consumers
Wells Fargo’s portion of the cash settlement is $766 million
-
$644 million incremental accrual in 4Q12 to fully reserve for settlement and additional
remediation costs Wells Fargo has committed to an additional $1.2 billion for
foreclosure prevention -
Covered through allowance for credit losses and purchased credit-impaired nonaccretable
difference Settlement ends the Independent Foreclosure Review programs created by the
April 2011 Interagency Consent Order which cost Wells Fargo ~$125 million per quarter
in 2012 |
 Wells Fargo
4Q12 Supplement 7
Balance Sheet and credit overview
Balance Sheet
Loans
Total period-end loans up $17.0 billion
-
Core loans increased $21.1 billion reflecting $8.7 billion in commercial growth
and the retention of $9.7 billion of 1-4 family conforming first mortgage
production
-
Non-strategic/liquidating
portfolio
decreased
$4.1
billion
(1)
Short-term investments/
Fed funds sold
Up $36.9 billion driven by strong deposit growth
Securities available for
sale (AFS)
Up $5.8 billion driven by new investments
-
Agency MBS purchases occurred late in the quarter as rates rose and yields
became more attractive
Deposits
Up $50.6 billion on growth across the franchise
Long-term debt
Down $3.4 billion as $4.4 billion in maturities were partially offset by $1.8 billion in
issuances
Common stock
repurchases
Purchased 42.1 million common shares in the quarter and an additional estimated
5.9
million
shares
through
a
forward
repurchase
transaction
that
is
expected
to
settle in 1Q13
Credit
Strong
credit
performance;
$250
million
reserve
release
(3)
on
strong
credit
and
incorporates estimated losses attributable to Hurricane Sandy
4Q12 effect of 3Q12
OCC guidance
(2)
implementation on credit
$394
million
increase
in
nonaccrual
loans
($264
million
from
the
completion
of
implementation and $130 million from 4Q12 activity)
$321 million in net charge-offs ($271 million from the completion of implementation
and $50 million from 4Q12 activity)
Period-end balances. All result comparisons are 4Q12 compared with 3Q12. (1) See pages 9
and 24 for additional information regarding core loans and the non-strategic/liquidating portfolio, which comprises the Pick-a-Pay,
liquidating home equity, legacy WFF indirect auto, legacy WFF debt consolidation, Education
Finance-government guaranteed, and legacy Wachovia commercial & industrial,
commercial real estate, foreign and other PCI loan portfolios.
(2) Office of the Comptroller of the Currency update to the Bank Accounting Advisory
Series issued third quarter 2012 (OCC guidance). The OCC guidance requires
write-down of performing consumer loans discharged in bankruptcy to net realizable collateral value.
(3) Provision expense minus net charge-offs. |
 Wells Fargo
4Q12 Supplement 8
Income Statement overview
Total revenue
Revenue of $21.9 billion, up $735 million, or 3%
Net interest income
NII essentially flat
Net interest margin (NIM) down 10 bps to 3.56% driven by strong deposit growth
Noninterest income
Mortgage banking up $261 million
-
Net servicing income up $53 million
-
Gain on sale revenue up $208 million (despite $340 million in forgone revenue
resulting
from
the
retention
of
conforming
production)
on
higher
margins
and
lower repurchase reserve build
Trust & investment fees up $245 million on stronger investment banking and higher
asset based fees in retail brokerage
Market sensitive revenues
(1)
up $231 million
-
Gains on equity investments more than offset weaker trading and losses on debt
securities
Noninterest expense
Operating losses up $672 million reflecting the $644 million incremental accrual to fully
reserve for the settlement costs associated with the IFR Settlement and additional
remediation-related costs
All other expense up $267 million driven by the $250 million contribution to the
Foundation
Personnel expense down $88 million and included $82 million lower deferred
compensation expense (P&L neutral)
All result comparisons are 4Q12 compared with 3Q12.
(1) Includes net gains from trading activities, net gains (losses) on debt securities
available for sale and net gains from equity investments. |
 Wells Fargo
4Q12 Supplement 9
657.3
658.3
672.1
684.0
705.1
112.3
108.2
103.1
98.6
94.5
769.6
766.5
775.2
782.6
799.6
4Q11
1Q12
2Q12
3Q12
4Q12
Core loans
Non-strategic/liquidating loans
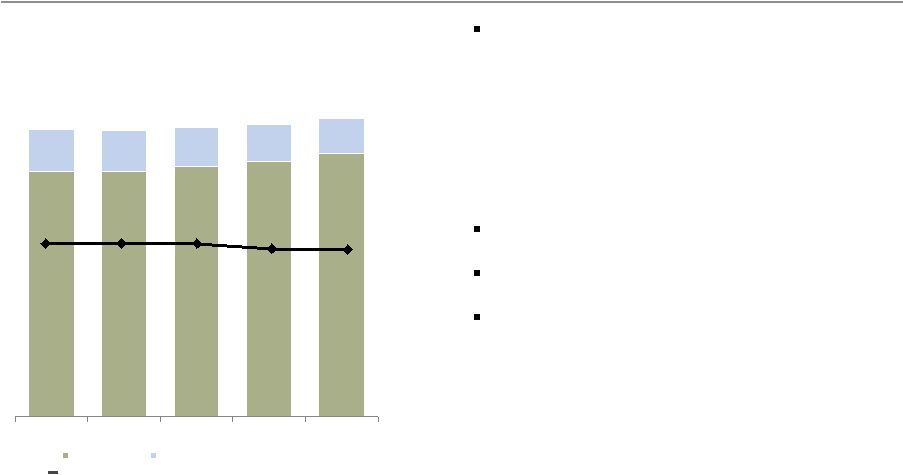
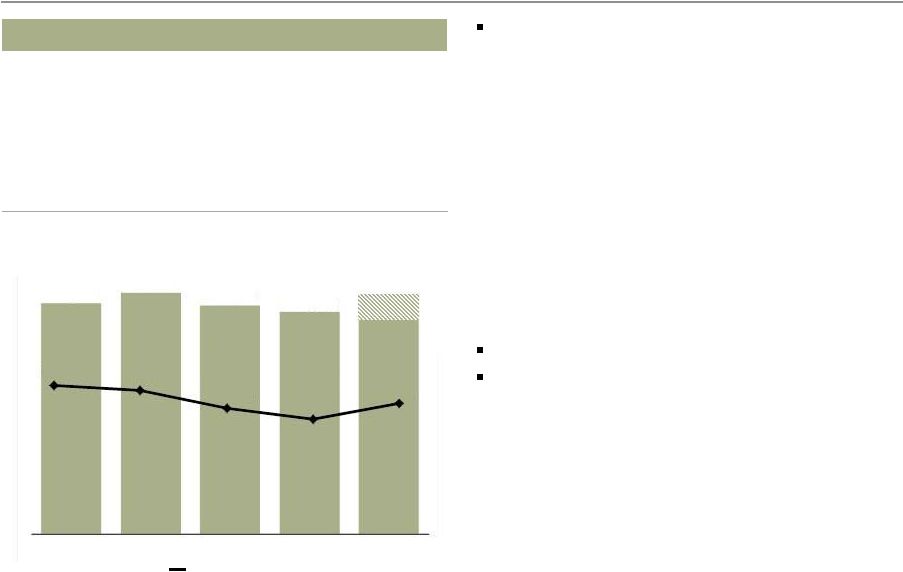
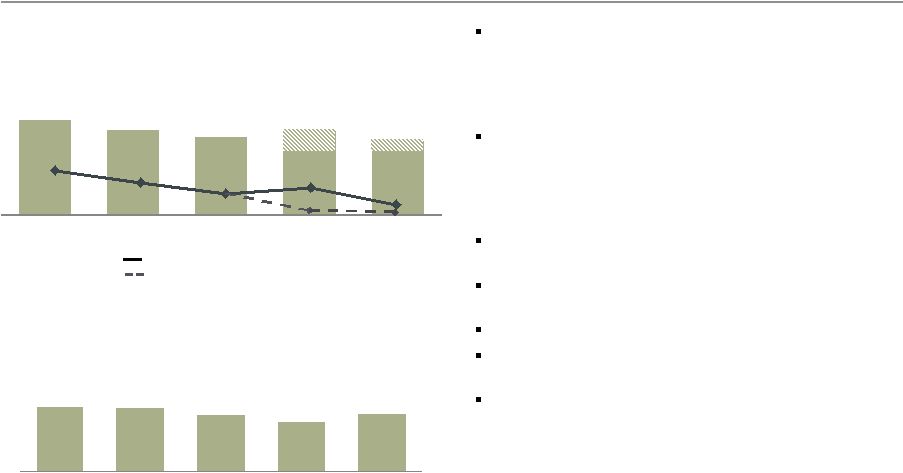
Loans
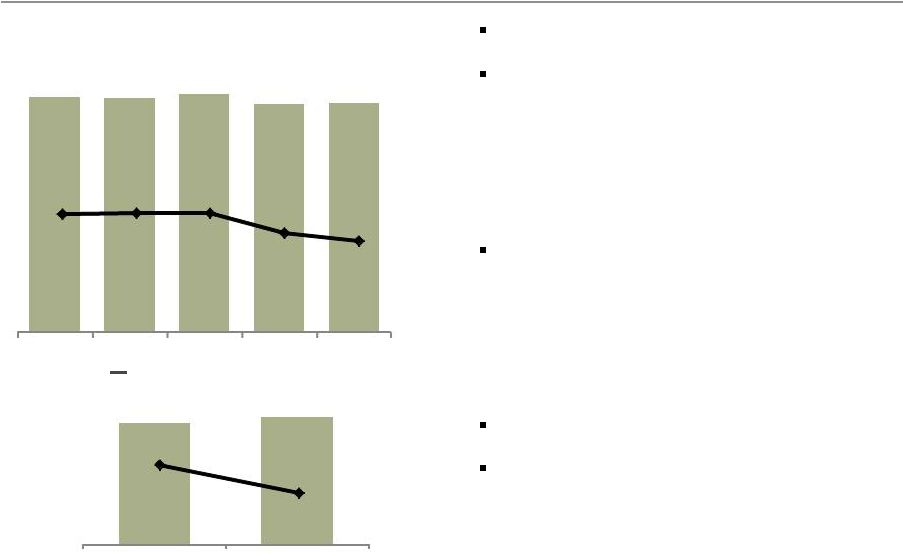
Strong core loan growth
Period-end loans up $30.0 billion YoY and $17.0
billion from 3Q12
-
Commercial loans up $8.7 billion LQ on growth
in C&I and CRE
-
Consumer loans up $8.3 billion LQ as growth in
first mortgage, auto, credit card and private
student lending was partially offset by a $2.6
billion decline in junior lien mortgage
•
Includes retention of $9.7 billion of 1-4 family
conforming first mortgages
Non-strategic/liquidating loans
(1)
down $17.8
billion YoY and $4.1 billion from 3Q12
Core loans grew $47.8 billion YoY and $21.1
billion LQ
Total average loan yield of 4.58% down 5 bps LQ
-
Core loan yield excluding the non-strategic/
liquidating portfolio was down 5 bps
-
Non-strategic/liquidating portfolio yield
of 5.17%
Period-end balances.
(1) See page 24 for additional information regarding the non-strategic/liquidating
portfolio, which comprises the Pick-a-Pay, liquidating home equity, legacy WFF
indirect auto, legacy WFF debt consolidation, Education Finance-government guaranteed, and
legacy Wachovia commercial & industrial, commercial real estate, foreign and other
PCI loan portfolios. Period–end Loans Outstanding
($ in billions)
(1)
Total average loan yield
4.81%
4.81%
4.83%
4.63%
4.58% |
 Wells Fargo
4Q12 Supplement 10
Deposits
Strong growth and reduced average cost
Average deposits up $64.0 billion YoY and $29.6
billion LQ driven by growth across the franchise
Average core deposits of $928.8 billion up $63.9
billion YoY and $33.5 billion from 3Q12
-
118% of average loans
-
Average retail core deposits up 6% YoY and
10% annualized LQ
Average core checking and savings up $72.0
billion, or 9% YoY, and $34.9 billion, or 4% from
3Q12
-
94% of average core deposits
Average deposit cost of 16 bps down 2 bps
from 3Q12
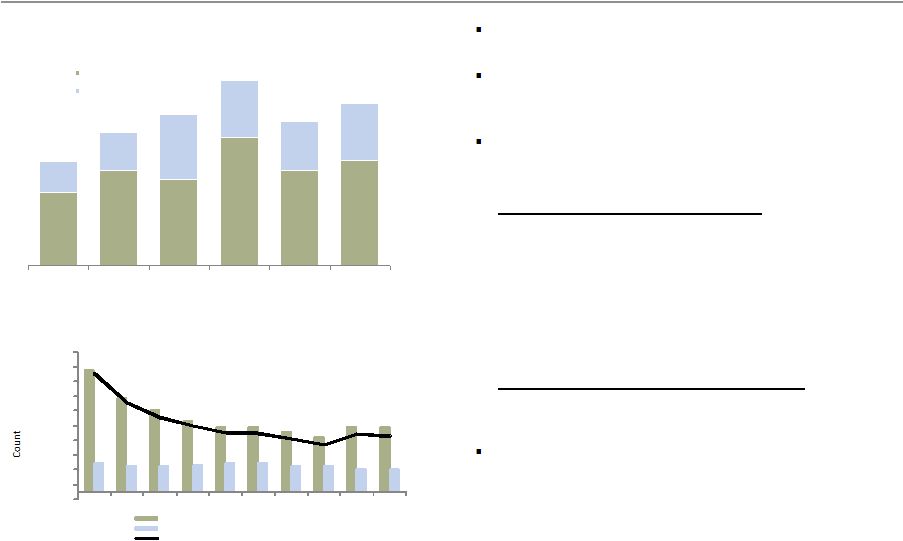
Average Deposits and Rates
($ in billions)
Average Core Checking and Savings
($ in billions)
800.1
837.2
872.1
4Q11
3Q12
4Q12
0.22%
0.18%
0.16%
665.4
679.3
689.2
246.7
267.2
286.9
912.1
946.5
976.1
4Q11
3Q12
4Q12
Interest-bearing deposits
Noninterest-bearing deposits
Average deposit cost |
 Wells Fargo
4Q12 Supplement 11
Tax-equivalent net interest income
(1)
essentially flat LQ
Average earning assets up $35.6 billion or 3%
LQ
-
Short-term investments/fed funds sold up
$25.5 billion
-
Loans up $10.5 billion
-
AFS securities up $2.9 billion
-
Trading assets up $2.5 billion
-
Mortgages held for sale declined $4.9 billion
NIM of 3.56%, down 10 bps, from 3Q12 on:
-
Strong deposit inflows with proceeds
invested in short-term investments/fed funds
sold = (8) bps
-
Continued balance sheet repricing = (5) bps
•
Securities (3) bps and loans (2) bps
-
Variable income = +3 bps
2012 tax-equivalent NII increase driven by lower
funding costs and growth in earning assets
2012 NIM decline driven by strong deposit flows
Net interest income
Net Interest Income (TE)
(1)
($ in millions)
Net Interest Margin (NIM)
(1)
11,083
11,058
11,213
10,820
10,841
4Q11
1Q12
2Q12
3Q12
4Q12
3.89%
3.91%
3.91%
3.66%
3.56%
43,459
43,931
2011
2012
3.94%
3.76%
Tax-equivalent net interest income is based on the federal statutory rate of 35% for the
periods presented. Net interest income was $10,892 million, $10,888 million, $11,037
million, $10,662 million, $10,643 million, $42,763 million and $43,230 million for 4Q11, 1Q12, 2Q12, 3Q12, 4Q12, 2011 and 2012
respectively.
|
 Wells Fargo
4Q12 Supplement 12
Noninterest income
Deposit service charges up 3% LQ reflecting product
and pricing changes
Trust and investment fees up 8% LQ primarily due to
stronger investment banking and retail brokerage
asset-based fees
Other fees up $96 million, or 9% LQ, on stronger
investment banking advisory fees
Mortgage banking up $261 million, or 9%, LQ
-
Net servicing income up $53 million as higher
net MSR/servicing hedge results were partially
offset by higher unreimbursed foreclosure costs
-
Gain on sale revenue up $208 million on higher
margins and $83 million lower repurchase
reserve build
-
$340 million in forgone revenue from the
retention of conforming production
Insurance down 5% LQ reflecting crop insurance
seasonality
Trading gains down $254 million LQ on lower volumes
and $95 million lower deferred compensation plan
investment income
Equity gains up $551 million reflecting strong
business results including the gain on the sale of
Becker Underwood
9,713
10,748
10,252
10,551
11,305
4Q11
1Q12
2Q12
3Q12
4Q12
vs
vs
($ in millions)
4Q12
3Q12
4Q11
Noninterest income
Service charges on deposit accounts
$
1,250
3
%
15
Trust and investment fees
3,199
8
20
Card fees
736
(1)
8
Other fees
1,193
9
9
Mortgage banking
3,068
9
30
Insurance
395
(5)
(15)
Net gains from trading activities
275
(48)
(36)
(63)
n.m.
n.m.
Net gains from equity investments
715
n.m.
n.m.
Operating leases
170
(22)
183
Other
367
(11)
(52)
Total noninterest income
$
11,305
7
%
16
Net losses on debt securities available
for sale |
 Wells Fargo
4Q12 Supplement 13
Noninterest expense and efficiency ratio
(1)
Noninterest expense up $784 million from 3Q12
and included $894 million in higher operating
losses and a foundation contribution
(2)
-
Personnel expense down $88 million, or 1%, on
lower benefits expense including lower deferred
compensation
-
Equipment expense up $32 million reflecting
seasonality
-
Other expense up $892 million and included:
•
Operating losses up $672 million on $644
million incremental accrual to fully reserve for
settlement costs associated with the IFR
Settlement and additional remediation-related
costs
•
Foundation contribution expense of $250
million
Efficiency ratio of 58.8% in 4Q12
Continue to target an efficiency ratio of 55%-
59%
Efficiency Ratio
12,508
12,993
12,397
12,112
12,896
894
(2)
12,002
60.7%
60.1%
58.2%
57.1%
58.8%
4Q11
1Q12
2Q12
3Q12
4Q12
(1) Efficiency ratio defined as noninterest expense divided by total revenue (net
interest income plus noninterest income). (2) Includes $644 million for IFR
Settlement and additional remediation-related costs and $250 million Foundation contribution.
vs
vs
($ in millions)
4Q12
3Q12
4Q11
Noninterest expense
Salaries
$
3,735
2
%
1
Commission and incentive compensation
2,365
-
5
Employee benefits
891
(16)
(12)
Equipment
542
6
(11)
Net occupancy
728
-
(4)
Core deposit and other intangibles
418
-
(10)
FDIC and other deposit assessments
307
(14)
(2)
Other
3,910
30
15
Total noninterest expense
$
12,896
6
%
3 |
 Wells Fargo
4Q12 Supplement 14
Environmentally-elevated costs
($ in millions)
Expense description
4Q12
2012
OCC Consent Order:
Independent consultant expense
$
~100
~400
Internal costs associated with foreclosure reviews
~25
~100
Foreclosed asset expense
221
1,061
Mortgage repurchase reserve build
(1)
313
1,665
MSR servicing and foreclosure costs
(2)
127
677
(1)
Contra revenue item. Change in estimate.
(2) Contra revenue item. MSR valuation adjustments include costs to service and
unreimbursed foreclosure costs. |
 Wells Fargo
4Q12 Supplement 15
Community Banking
Net income of $2.9 billion, up 14% YoY
and 5% LQ
Noninterest expense increased $631 million LQ
as higher operating losses and the contribution to
the Wells Fargo Foundation were only partially
offset by lower employee benefit costs
Regional Banking
Continued franchise and cross-sell growth
(1)
-
Consumer checking
(2)
essentially flat to
prior year
-
Business checking
(2)
up a net 3.7% YoY
-
Retail bank cross-sell of 6.05 products per
household up from 5.93 in 4Q11
Consumer Lending
Credit card penetration
(1) (3)
rose to 33.1%, up
from 32.1% in 3Q12 and 29.2% in 4Q11
Consumer auto originations of $5.4 billion, down
15% LQ and up 8% YoY
Mortgage originations of $125 billion down
10% LQ and up 4% YoY
-
12% of originations were from HARP
(4)
Quarter-end pipeline of $81 billion down 16% LQ
and up 13% YoY
Managed residential mortgage servicing of $1.9
trillion up 3% YoY
(1) Metrics reported on a one-month lag from reported quarter-end; for
example 4Q12 cross-sell is as of November 2012.
(2) Checking account growth is 12-months ending for each respective period.
(3) Household penetration as of November 2012 and defined as the percentage
of retail banking deposit households that have a credit card with Wells Fargo.
Household
penetration
has
been
redefined
to
include
legacy
Wells
Fargo
Financial accounts.
(4) Home Affordable Refinance Program.
vs
vs
($ in millions)
4Q12
3Q12
4Q11
Net interest income
$
7,166
(1)
%
(3)
Noninterest income
6,616
13
18
Provision for credit losses
1,757
8
(13)
Noninterest expense
8,033
9
10
Income tax expense
918
(27)
(15)
Segment earnings
$
2,869
5
%
14
($ in billions)
Avg loans, net
$
493.1
2
1
Avg core deposits
608.9
2
7
vs
vs
($ in billions)
4Q12
3Q12
4Q11
Consumer Lending
Credit card payment volumes (POS)
$
12.6
5
%
14
Credit card penetration
(1)(3)
33.1
%
10
bps
39
Home Mortgage
Applications
$
152
(19)
%
(3)
Application pipeline
81
(16)
13
Originations
125
(10)
4
Managed residential
mortgage servicing
($ in trillions)
$
1.9
-
3
4Q12
3Q12
4Q11
Regional Banking
Consumer checking account growth
(1)(2)
-
%
-
3.9
Business checking account growth
(1)(2)
3.7
3.9
3.7
Retail Bank household cross-sell
(1)
6.05
6.04
5.93 |
 Wells Fargo
4Q12 Supplement 16
Wholesale Banking
Record net income of $2.0 billion, up 24% YoY
and 2% LQ
Net interest income up 2% LQ driven by strong
loan and deposit growth
-
Average loans up 1% and average core deposits
up 7%
Noninterest income down 1% LQ driven by lower
trading volumes
Provision was $60 million in 4Q12 and included
higher net charge-offs
Expenses up 3% LQ driven by higher personnel
expense and investments in the business
Key Metrics
Cross-sell
of
6.8
products
per
relationship
(1)
up
1% LQ and 4% YoY
Treasury Management
Commercial card spend volume of $4.3 billion up
6% LQ and 25% YoY
Investment Banking
2012 Investment Banking fees from Commercial
and Corporate Banking customers up 30%
from 2011
2012 U.S. investment banking market
share
(2)
of 5.1%
Asset Management
Total AUM up $1.4 billion LQ from growth in
long-term assets
(1) Cross-sell reported on a quarter lag.
(2) Source: Dealogic U.S. investment banking fee market share.
vs
vs
($ in millions)
4Q12
3Q12
4Q11
Net interest income
$
3,092
2
%
1
Noninterest income
2,901
(1)
24
Provision for credit losses
60
n.m.
94
Noninterest expense
3,007
3
2
Income tax expense
892
(19)
10
Segment earnings
$
2,032
2
%
24
($ in billions)
Avg loans, net
$
279.2
1
5
Avg core deposits
240.7
7
8
vs
vs
($ in billions)
4Q12
3Q12
4Q11
Key Metrics:
Cross-sell
(1)
6.8
1
%
4
Commercial card spend
volume
$
4.3
6
25
YTD U.S. investment banking
market
share
%
(2)
5.1
-
bps
-
Total AUM
$
451.8
-
%
-
Advantage Funds AUM
217.0
4
2 |
 Wells Fargo
4Q12 Supplement 17
Wealth, Brokerage and Retirement
Record net income up 13% YoY and 4% LQ
Net interest income up 1% LQ; average core
deposits up 5%
Noninterest income up 2% LQ; excluding $37
million lower deferred compensation plan
investment results, noninterest income was up
4% due to higher asset-based fees
Noninterest expense was up 2%, excluding $34
million in lower deferred compensation expense,
expenses increased 4% due to higher personnel
expense
Provision expense down $15 million LQ on lower
net charge-offs; both current quarter and prior
quarter reflect credit reserve releases
Retail Brokerage
Managed
account
assets
up
2%
LQ
and
20%
YoY
driven by strong net flows and market
performance
Wealth Management
Wealth
Management
client
assets
up
2%
LQ
and
3% YoY
Retirement
IRA assets up 1% LQ and 11% YoY
Institutional Retirement plan assets up 2% LQ
and 13% YoY
(1) Includes deposits.
(2) Data as of November 2012.
vs
vs
($ in millions)
4Q12
3Q12
4Q11
Net interest income
$
689
1
%
(6)
Noninterest income
2,405
2
4
Provision for credit losses
15
(50)
(25)
Noninterest expense
2,513
2
-
Income tax expense
215
3
13
Segment earnings
$
351
4
%
13
($ in billions)
Avg loans, net
$
43.3
2
1
Avg core deposits
143.4
5
6
vs
vs
($ in billions, except where noted)
4Q12
3Q12
4Q11
Key Metrics:
WBR Clients Assets
(1)
($ in trillions)
$
1.4
1
%
7
Cross-sell
(2)
10.27
-
2
Retail
Brokerage
Financial Advisors
15,414
1
1
Managed account assets
$
304
2
20
Client assets
(1)
($ in trillions)
1.2
1
8
Wealth
Management
Client assets
(1)
204
2
3
Retirement
IRA Assets
297
1
11
Institutional Retirement
Plan Assets
266
2
13 |
 Wells Fargo
4Q12 Supplement 18
2.6
2.4
2.2
2.4
2.1
4Q11
1Q12
2Q12
3Q12
4Q12
2.0
2.0
1.8
1.6
1.8
4Q11
1Q12
2Q12
3Q12
4Q12
Credit quality
Trends showed continued improvement
Net charge-offs of $2.1 billion were down $277
million LQ; consumer losses included $321 million
from OCC guidance
(2)
vs. $567 million in 3Q12.
Excluding this effect:
-
0.89% net charge-off rate, down 3 bps LQ
NPAs declined $744 million LQ on a $558 million
decline in nonaccrual loans and a $186 million
decline in foreclosed assets
-
Included $394 million in NPLs from OCC
guidance
(3)
Provision expense of $1.8 billion, up $240 million
from 3Q12
Early stage consumer delinquency balances
decreased 7% and rates declined 18 bps LQ
Allowance for credit losses = $17.5 billion
Remaining PCI nonaccretable = 22.9% of
remaining UPB
(4)
Absent significant deterioration in the economy
we continue to expect future reserve releases in
2013, though at a lower level than 2012
Net Charge-offs
($ in billions)
Provision Expense
($ in billions)
1.36%
1.25%
1.15%
1.21%
1.05%
1.8
0.6
(1)
0.89%
Net charge-off rate (as reported)
Net charge-off rate (as adjusted)
0.3
(1)
1.8
0.92%
(1) OCC guidance. (2)
Includes $271 million from the completion of implementation and $50 million from 4Q12 activity.
(3) Includes $264 million from the completion of implementation and $130 million from
4Q12 activity.
(4) Unpaid principal balance for PCI loans that have not had a UPB
charge-off. |
 Wells Fargo
4Q12 Supplement 19
21.3
22.0
20.6
19.7
20.5
4.7
4.6
4.3
4.2
4.0
26.0
26.6
24.9
25.3
24.5
4Q11
1Q12
2Q12
3Q12
4Q12
Nonaccrual loans
Foreclosed assets
1.5
1.2
1.1
1.2
1.1
0.5
0.4
0.3
0.3
0.3
2.0
1.6
1.4
1.5
1.4
4Q11
1Q12
2Q12
3Q12
4Q12
Consumer
Commercial
8.3
6.8
6.6
6.9
6.5
$0
$5
$10
4Q11
1Q12
2Q12
3Q12
4Q12
2.40%
2.00%
1.94%
1.97%
1.79%
Credit quality
Nonperforming Assets
($ in billions)
Consumer Loans 30-89 DPD &
Still
Accruing
(3)(4)
(Balances and rates)
Loans
90+
DPD
and
Still
Accruing
(3)(4)
($ in billions)
(1)
1.4
(2)
(1)
Includes $1.7 billion at March 31, 2012, resulting from implementation of Interagency
Supervisory Guidance on Allowance for Loan and Lease Losses Estimation Practices for
Loans and Lines of Credit Secured by Junior Liens on 1-4 Family Residential Properties issued January 31, 2012.
(2)
OCC guidance impact.
(3)
Consumer includes mortgage loans held for sale 30-89 days and 90 days or more past due and
still accruing. (4) Excludes mortgage loans insured/guaranteed by the FHA or VA,
reverse mortgages, margin loans and student loans whose repayments are
predominantly guaranteed by guarantee agencies on behalf of the U.S. Department of Education
under the Federal Family Education Loan Program. Also excludes the carrying value of
PCI loans contractually delinquent. |
 Wells Fargo
4Q12 Supplement 20
5.19
6.72
6.09
9.07
6.75
7.43
2.13
2.67
4.62
3.97
3.42
3.99
7.32%
9.40%
10.70%
13.04%
10.17%
11.42%
Wells Fargo
Citi
JPM Chase
Bank of
America
Industry
Industry ex
WFC
Deliquency Rate
Foreclosure Rate
3Q12 Servicing Portfolio Delinquency
Performance
(1)
Total
Outstanding
Repurchase
Demands
(3)
and
Agency New Demands for 2006-2008 Vintages
Mortgage servicing
Delinquency and outstanding repurchase demands
(1) Inside Mortgage Finance, data as of September 30, 2012. Industry excluding
WFC performance calculated based on IMF data.
(2) Industry is all large servicers ($6.0 trillion) including WFC, C, JPM and BAC.
(3) Includes mortgage insurance rescissions.
(2)
3Q12 Wells Fargo delinquency and foreclosure ratio
continued to be significantly lower than peers
Wells Fargo’s total delinquency and foreclosure
ratio for 4Q12 was 7.04%, down 28 bps LQ and
down from 7.96% in 4Q11
Number and balance of total outstanding
repurchase demands were down slightly LQ
and YoY
Agency demands outstanding
-
Agency repurchase demands outstanding
essentially flat from 3Q12 on lower resolutions
-
New agency demands in total and in the 2006-
2008 vintages down LQ
-
Demands on newer vintage originations
continued to emerge consistent with our
estimates
Non-Agency demands outstanding
-
Balance of non-agency repurchase demands
outstanding down LQ
Repurchase reserves of $2.2 billion increased $173
million LQ on lower losses/reserve usage and
included a $379 million reserve addition vs. $462
million in 3Q12
-
Incorporates current demand levels
-
Considers all vintages
-
Anticipates future expected demands
$3.84
$2.95
$2.49
$2.24
$2.02
$2.01
$1.86
$1.67
$2.00
$1.94
(1,000)
1,000
3,000
5,000
7,000
9,000
11,000
13,000
15,000
17,000
19,000
3Q10
4Q10
1Q11
2Q11
3Q11
4Q11
1Q12
2Q12
3Q12
4Q12
Number of Outstanding Demands
Agency New Demands for 2006-2008 Vintages
Original Loan Balance of Outstanding Demands ($ in B) |
 Wells Fargo
4Q12 Supplement 21
Capital
9.46%
9.98%
10.08%
9.92%
10.12%
4Q11
1Q12
2Q12
3Q12
4Q12
Capital remained strong
Tier 1 common equity ratio under Basel I
of 10.12% increased 20 bps LQ
Tier 1 common equity ratio under Basel III is
estimated
to
be
8.18%
at
12/31/12
(1)
Purchased 42.1 million common shares in 4Q12
and entered into a $200 million 4Q12 forward
repurchase transaction, estimated to be 5.9
million shares, that is expected to settle in 1Q13
Tier 1 Common Equity Ratio
Under Basel I
See Appendix page 36 for additional information on Tier 1 common equity.
4Q12 capital ratios are preliminary estimates.
(1) Estimated Basel III calculation based on management’s current interpretation of
the Basel III capital rules proposed by federal banking agencies in notices of proposed
rulemaking announced in June 2012. The proposed rules and interpretations and assumptions used in estimating Basel III calculations are subject to
change depending on final promulgation of Basel III capital rules. See pages 36-37 for
additional information regarding Tier 1 common equity ratios. |
 Wells Fargo
4Q12 Supplement 22
Summary -
strong 4Q12
Record earnings of $5.1 billion, up $983 million, or 24% from 4Q11
Record diluted earnings per share of $0.91, up 25%
PTPP of $9.1 billion up $955 million, or 12%
Revenue up $1.3 billion, or 7%
4Q12 efficiency ratio
(1)
of 58.8% down 190 bps
Strong credit performance
Solid returns
-
ROA = 1.46%, up 21 bps
-
ROE = 13.35%, up 138 bps
Capital levels increased
Returned more capital to shareholders in 2012
(1)
Noninterest expense and our efficiency ratio may be affected by a variety of factors,
including business and economic cyclicality, seasonality, changes in our business
composition and operating environment, growth in our business and/or acquisitions, and unexpected expenses relating to, among
other things, litigation and regulatory matters.
All comparisons are 4Q12 vs. 4Q11. |
 Wells Fargo
4Q12 Supplement 23
Appendix |
 Wells Fargo
4Q12 Supplement 24
(1) Net of purchase accounting adjustments.
-$78.5
Non-strategic/liquidating loan portfolio risk reduction
-$4.1
-$5.1
-$4.5
-$4.1
($ in billions)
4Q12
3Q12
2Q12
1Q12
4Q11
4Q08
Pick-a-Pay mortgage
(1)
$
58.3
60.1
62.0
64.0
65.7
95.3
Liquidating home equity
4.6
5.0
5.2
5.5
5.7
10.3
Legacy WFF indirect auto
0.8
1.1
1.5
1.9
2.5
18.2
Legacy WFF debt consolidation
14.5
15.0
15.5
16.0
16.5
25.3
Education Finance -
gov't guaranteed
12.5
13.0
13.8
14.8
15.4
20.5
Legacy WB C&I, CRE and foreign PCI loans
(1)
3.2
3.8
4.3
5.2
5.7
18.7
Legacy WB other PCI loans
(1)
0.6
0.6
0.8
0.8
0.8
2.5
Total
$
94.5
98.6
103.1
108.2
112.3
190.8
-$96.3 |
 Wells Fargo
4Q12 Supplement 25
Purchased credit-impaired (PCI) portfolios
Legacy Wachovia PCI loans continued to perform better than originally expected
($ in billions)
(1)
December 31, 2008
September 30, 2012
December 31, 2012
12/31/08 Nonaccretable difference
Addition of nonaccretable difference due to acquisitions
Losses from loan resolutions and write-downs
Release of nonaccretable difference since merger
12/31/12 Remaining nonaccretable difference
Additional provision since 2008 merger
Release of nonaccretable difference since 2008 merger
Net performance
Commercial
Pick-a-Pay
Other
consumer
Total
Life-to-date
net
performance
Nonaccretable
difference
rollforward
Adjusted
unpaid
principal
balance
$
29.2
62.5
6.5
98.2
5.9
33.1
1.5
40.5
5.0
32.0
1.4
38.4
$
10.4
26.5
4.0
40.9
0.2
-
-
0.2
(6.9)
(17.3)
(2.8)
(27.0)
(3.3)
(3.0)
(0.8)
(7.1)
(2)
0.4
6.2
0.4
7.0
$
(1.7)
-
(0.1)
(1.8)
3.3
3.0
0.8
7.1
(2)
1.6
3.0
0.7
5.3
(2) Reflects releases of $1.8 billion for loan resolutions and $5.3 billion from the
reclassification of nonaccretable difference to the accretable yield, which will result
in increasing income over the remaining life of the loan or pool of loans.
(1)
Includes write-downs taken on loans where severe delinquency (normally 180 days) or other
indications of severe borrower financial stress exist that indicate there will be a
loss of contractually due amounts upon final resolution of the loan. |
 Wells Fargo
4Q12 Supplement 26
$135 million in nonaccretable difference reclassified to accretable yield this quarter
$86 million of the $509 million in losses from loan resolutions and write-downs in the
quarter was the result of the OCC guidance
$7.0
billion
in
nonaccretable
difference
remains
to
absorb
losses
on
PCI
loans
-
Remaining
nonaccretable
=
22.9%
of
unpaid
principal
balance
(UPB)
(5)
•
Remaining
Pick-a-Pay
nonaccretable
=
24.4%
of
Pick-a-Pay
UPB
(5)
PCI nonaccretable difference
Analysis of nonaccretable difference for PCI loans
($ in millions)
Pick-a-Pay
Total
Balance, September 30, 2012
$
557
6,679
Addition of nonaccretable difference due to acquisitions
7
-
-
Release of nonaccretable difference due to:
Loans
resolved
by
settlement
with
borrower
(1)
(5)
-
-
Loans
resolved
by
sales
to
third
parties
(2)
-
-
-
-
Reclassification
to
accretable
yield
for
loans
with
improving
credit-related
cash
flows
(3)
(127)
-
Use of nonaccretable difference due to:
Losses
from
loan
resolutions
and
write-downs
(4)
(10)
(447)
Balance, December 31, 2012
$
422
6,232
(52)
(509)
310
6,964
(5)
(8)
(135)
Other
consumer
Commercial
370
7,606
7
(1) Release of the nonaccretable difference for settlement with borrower, on
individually accounted PCI loans, increases interest income in the period of
settlement. Pick-a-Pay and Other consumer PCI loans do not reflect nonaccretable
difference releases for settlements with borrowers due to pool accounting for those
loans, which assumes that the amount received approximates the pool performance expectations.
(2) Release of the nonaccretable difference as a result of sales to third parties
increases noninterest income in the period of the sale. (3) Reclassification of nonaccretable difference to accretable yield for loans with
increased cash flow estimates will result in increased interest income as a prospective
yield adjustment over the remaining life of the loan or pool of loans. (4)
Write-downs to net realizable value of PCI loans are absorbed by the nonaccretable
difference when severe delinquency (normally 180 days) or other indications of severe
borrower financial stress exist that indicate there will be a loss of contractually due amounts upon final resolution of the loan.
(5) Unpaid principal balance of loans without write-downs. |
 Wells Fargo
4Q12 Supplement 27
Accretable yield balance decreased $364 million LQ and included:
-
Accretion into interest income of $513 million, up modestly LQ
Balance of $18.5 billion expected to accrete to income over the remaining life of the
underlying loans PCI accretable yield
(1) Includes accretable yield released as a result of settlements with borrowers, which
is included in interest income. (2) Includes accretable yield released as a
result of sales to third parties, which is included in noninterest income. (3)
Represents changes in cash flows expected to be collected due to changes in interest rates on variable rate PCI loans, changes in prepayment
assumptions and the impact of modifications.
Cumulative
Accretable yield rollforward
since
($ in millions)
4Q12
3Q12
merger
Total, beginning of period
$
18,912
15,153
10,447
Addition of accretable yield due to acquisitions
3
-
131
Accretion
into
interest
income
(1)
(513)
(495)
(9,351)
Accretion
into
noninterest
income
due
to
sales
(2)
-
-
(242)
Reclassification from nonaccretable difference for loans with improving credit-related
cash flows 135
687
5,354
Changes
in
expected
cash
flows
that
do
not
affect
nonaccretable difference
11
3,567
12,209
Total, end of period
$
18,548
18,912
18,548
(3) |
 Wells Fargo
4Q12 Supplement 28
PCI accretable yield (Commercial
(1)
and Pick-a-Pay)
Commercial accretion
(2)
decreased $22
million and accretable yield percentage
of 16.77% was in line with 3Q12
Pick-a-Pay accretable yield balance
declined to $16.9 billion while
accretable yield percentage increased to
4.7% reflecting the 3Q12 increase in
the balance
-
Weighted average life decreased to
12.5 years
Pick-a-Pay PCI Accretable Yield
($ in millions)
4Q12
3Q12
2Q12
PCI interest income
Accretion
$
312
287
303
Average carrying value
26,560
27,260
28,041
Accretable yield percentage
4.70
%
4.21
4.32
Accretable yield balance
$
16,879
17,189
13,466
Weighted average life (years)
12.5
12.7
11.4
Commercial
(1)
PCI Accretable Yield
($ in millions)
4Q12
3Q12
2Q12
PCI interest income
Accretion
and
resolution
income
$
182
204
323
Average carrying value
4,332
4,914
5,629
Accretable yield percentage
(2)
16.77
%
16.62
22.95
Accretable yield balance
$
941
978
1,008
Weighted average life (years)
2.9
2.8
2.2
(1) Includes both legacy Wachovia PCI loans as well as recently purchased PCI
loans.
(2) Includes resolution income. |
 Wells Fargo
4Q12 Supplement 29
Pick-a-Pay mortgage portfolio
Carrying
value
of
$58.3
billion
in
first
lien
loans
outstanding,
down
$1.8
billion
from
3Q12
and
down
$37.0
billion from 4Q08 on paid-in-full loans and loss mitigation efforts
Adjusted unpaid principal balance of $63.8 billion, down $2.3 billion from 3Q12 and down $51.9
billion from 4Q08
$5.1 billion in modification principal forgiveness since acquisition reflects over 111,000
completed full-term modifications; additional $427 million of conditional
forgiveness that can be earned by borrowers through performance over the next 3 years
Modification redefault rate has been consistently better than the industry average (as
measured by 60+ DPD after six months)
49% of the adjusted UPB are option payment loans vs. 86% in 4Q08
($ in millions)
Product type
Adjusted
unpaid
principal
balance
% of total
Adjusted
unpaid
principal
balance
% of total
Adjusted
unpaid
principal
balance
% of total
Option
payment
loans
(1)
$
31,510
49
%
$
33,364
50
%
$
99,937
86
%
Non-option payment adjustable-rate and
fixed-rate
loans
(1)(2)
8,781
14
8,974
14
15,763
14
Full-term loan modifications
(1)
23,528
37
23,736
36
-
-
Total
adjusted
unpaid
principal
balance
(1)(2)
$
63,819
100
%
$
66,074
100
%
$
115,700
100
%
Total carrying value
58,274
60,080
95,315
At 12/31/2008
At 9/30/2012
(3)
At 12/31/2012
(3)
(1)
Adjusted unpaid principal includes write-downs taken on loans where severe delinquency
(normally 180 days) or other indications of severe borrower financial stress
exist that indicate there will be a loss of contractually due amounts upon final resolution of the loan.
(2)
Includes loans refinanced under the Consumer Relief Refinance Program. (3)
Reflects OCC guidance. |
 Wells Fargo
4Q12 Supplement 30
Pick-a-Pay credit highlights
Non-PCI portfolio
Loans down 3% LQ driven by loans paid-in-full
85% of portfolio current
Nonaccrual loans increased $182 million,
or 5%, LQ
$209 million increase related to OCC guidance
$142 million of nonaccrual TDRs reclassified to
accruing TDR status based on borrower payment
performance
$4.2 billion in nonaccruals includes $1.9 billion
of nonaccruing TDRs
Net charge-offs of $138 million down $39
million LQ
45% of portfolio with LTV
(2)
80%
PCI portfolio
Carrying value down 2%
67% of portfolio current
Life-of-loan losses continued to be lower than
originally projected at time of merger
(1)
The carrying value, which does not reflect the allowance for loan losses, includes purchase
accounting adjustments, which, for PCI loans, are the nonaccretable
difference
and
the
accretable
yield,
and
for
all
other
loans,
an
adjustment
to
mark
the
loans
to
a
market
yield
at
date
of
merger
less
any
subsequent
charge-offs.
(2) The current loan-to-value (LTV) ratio is calculated as the net carrying
value (defined in (1) above) divided by the collateral value. (3)
The adjusted unpaid principal balance includes write-downs taken on loans where severe
delinquency (normally 180 days) or other indications of severe borrower financial
stress exist that indicate there will be a loss of contractually due amounts upon final resolution of the loan.
($ in millions)
4Q12
3Q12
Non-PCI
loans
Carrying
value
(1)
$
31,940
33,096
Nonaccrual loans
4,200
4,018
as a % of loans
13.15
%
12.14
Net charge-offs
$
138
177
as % of avg loans
1.68
%
2.09
90+ days past due
as % of loans
10.30
10.09
Current
average
LTV
(2)
83
%
84
Current average FICO
682
683
Contractual average loan size
$
202,000
204,000
Contractual average age of loans
8.79
years
8.54
% of loans in California
49
%
49
($ in millions)
4Q12
3Q12
PCI
loans
Adjusted
unpaid
principal
balance
(3)
$
32,003
33,107
Carrying
value
(1)
26,334
26,984
Current
average
LTV
(2)
88
%
90
Current average FICO
618
617
Contractual average loan size
$
299,000
304,000
Contractual average age of loans
6.75
years
6.50
% of loans in California
68
%
68 |
 Wells Fargo
4Q12 Supplement 31
Real estate 1-4 family first mortgage portfolio
First lien mortgage loans up 4% as growth in core
first lien mortgage was partially offset by
continued run-off in the liquidating portfolio
Pick-a-Pay non-PCI portfolio down 3%
PCI portfolio down 3%
Debt consolidation first lien down 3%
Core first lien up $11.7 billion, or 7%, reflecting
strong origination volumes and the decision to
retain $9.7 billion of conforming production
•
Nonconforming mortgages increased $3.6
billion to $49.0 billion
Core net charge-offs up $47 million on higher
losses from OCC guidance
(1) Ratios on Legacy WFF debt consolidation first mortgage loan portfolio only.
(2) Ratios on non run-off first lien mortgage loan portfolio only.
($ in millions)
4Q12
3Q12
Total real estate 1-4 family first mortgage
$
249,900
240,554
Less consumer non-strategic/liquidating portfolios:
Pick-a-Pay non-PCI first lien mortgage
31,940
33,096
PCI first lien mortgage
26,838
27,535
Debt consolidation first mortgage portfolio
14,178
14,640
Core first lien mortgage
176,944
165,283
Nonaccrual loans
$
2,363
2,279
as % of loans
16.67 %
15.57
Net charge-offs
$
182
214
as % of average loans
5.03 %
5.77
Nonaccrual loans
$
4,892
4,898
as % of loans
2.76 %
2.96
Net charge-offs
$
329
282
as % of loans
0.74 %
0.69
Core
first
lien
mortgage
loan
performance
(2)
Legacy
WFF
debt
consolidation
first
mortgage
loan
performance
(1) |
 Wells Fargo
4Q12 Supplement 32
Home equity portfolio
Core
Portfolio
(1)
Outstandings
down 3%
-
High
quality
new
originations
with
weighted
average CLTV of 61%, 778 FICO, and 30% total
debt service ratio
4Q12 losses decreased $313 million mainly due to
the implementation of OCC guidance in 3Q12
2+ delinquencies decreased $188 million
Delinquency rate for loans with a CLTV >100%
improved 38 bps
Liquidating
Portfolio
Outstandings down 6%
4Q12 losses decreased $47 million
2+ delinquencies declined $21 million
Delinquency rate for loans with a CLTV >100%
improved 34 bps
21%
in
1
lien
position
40% in junior lien position behind WFC owned or
serviced
1
lien
-
Current
1
lien,
Current
junior
lien
=
96.0%
-
Current 1 lien, Delinquent junior lien = 1.0%
-
Delinquent
1
lien,
Current
junior
lien
=
1.3%
-
Delinquent
1
lien,
Delinquent
junior
lien
=
1.7%
39%
in
junior
lien
position
behind
third
party
1
lien
st
st
st
st
st
st
($ in millions)
4Q12
3Q12
Core Portfolio
(1)
Outstandings
$
90,427
92,979
Net charge-offs
622
935
as % of avg loans
2.69
%
3.93
2+ payments past due
$
2,497
2,685
as % loans
2.77
%
2.90
% CLTV > 100%
(2)
34
35
2+ payments past due
3.52
3.90
% Unsecured balances
(3)
15
16
% 1st lien position
22
21
Liquidating
Portfolio
Outstandings
$
4,647
4,951
Net charge-offs
101
148
as % of avg loans
8.33
%
11.60
2+ payments past due
$
178
199
as % loans
3.82
%
4.03
% CLTV > 100%
(2)
71
72
2+ payments past due
3.73
4.07
% 1st lien position
4
4
st
Excludes purchased credit-impaired loans.
(1)
Includes equity lines of credit and closed-end junior liens associated with the
Pick-a-Pay portfolio totaling $1.3 billion at December 31, 2012 and $1.4
billion at September 30, 2012.
(2)
CLTV is calculated based on outstanding balance plus unused lines of credit
divided by estimated home value. Estimated home values are determined
predominantly based on automated valuation models updated through
December 2012.
(3)
Unsecured balances, representing the percentage of outstanding balances
above the most recent home value.
Total
home
equity
portfolio
$95
billion
= |
 Wells Fargo
4Q12 Supplement 33
Credit card portfolio
Record $24.6 billion credit card outstandings, up
4% from 3Q12 on seasonal holiday spending and
8% YoY on strong account growth
-
Consumer credit card new accounts increased
11% YoY with household penetration increasing
to 33.1%
(1)
-
Record $12.6 billion purchase dollar volume in
4Q12, increased 5% LQ and 14% YoY
-
Purchase transactions grew 6% LQ and
17% YoY
Net charge-offs up $10 million, or 4 bps, LQ a
return to pre-recession seasonality and down $34
million, or 92 bps, YoY reflecting continued steady
improvement
(1) Household penetration as of November 2012 and defined as the percentage of retail
banking deposit households that have a credit card with Wells Fargo. Household
penetration has been redefined to include Wells Fargo Financial accounts. ($ in
millions) 4Q12
3Q12
Credit card outstandings
$
24,640
23,692
Net charge-offs
222
212
as % of avg loans
3.71
%
3.67
Key Metrics:
Purchase volume
$
12,609
12,066
Penetration
(1)
33.1
%
32.1 |
 Wells Fargo
4Q12 Supplement 34
Auto portfolios
(1)
Core Consumer Portfolio
Core auto outstandings of $46.1 billion flat LQ and
up 9% YoY
4Q12 originations of $5.4 billion down 15% LQ
from prior quarter reflecting seasonality and
increased competition and up 8% YoY
Nonaccrual loans decreased $44 million LQ
Net charge-offs were up $48 million LQ reflecting
seasonality and include $26 million in losses from
OCC guidance
December Manheim index of 124.1, up 3% LQ
and down 1% from December 2011
30+ days past due increased $188 million LQ
reflecting seasonality
Commercial Portfolio
Loans of $7.4 billion up 12% LQ and 31% YoY as
dealer floorplan utilization rates hit highest levels
since the merger
Continued strong credit performance
(1)
Legacy Wells Fargo Financial indirect portfolio balance as of December 31, 2012, was $830
million. ($ in millions)
4Q12
3Q12
Auto outstandings
$
43,841
43,613
Nonaccrual loans
185
218
as % of loans
0.42
%
0.50
Net charge-offs
$
102
57
as % of avg loans
0.93
%
0.52
30+ days past due
$
797
609
as % of loans
1.82
%
1.40
Auto outstandings
$
2,306
2,357
Nonaccrual loans
35
46
as % of loans
1.52
%
1.95
Net charge-offs
$
9
6
as % of avg loans
1.46
%
1.02
30+ days past due
$
30
30
as % of loans
1.30
%
1.27
Commercial Portfolio
Auto outstandings
$
7,396
6,599
Nonaccrual loans
-
-
as % of loans
-
%
-
Net charge-offs (recoveries)
$
-
-
as % of avg loans
n.m.
%
n.m.
Core Indirect Consumer Portfolio
Core Direct Consumer Portfolio |
 Wells Fargo
4Q12 Supplement 35
Student lending portfolio
$23.1 billion student lending outstandings down
2% LQ
Private Portfolio
$10.7 billion private loans outstandings up 1% LQ
and up 7% YoY
Applications decreased 57% LQ due to
peak season in 3Q12
Dollar originations decreased 54% LQ due
to seasonality
Continued to originate high quality loans with
an average FICO of 764 and 81% of new loans
co-signed
Net charge-offs up $11 million LQ due to
seasonality of repayments on loans
Government Portfolio
$12.5 billion liquidating government guaranteed
outstandings declined 4% LQ and 19% YoY
($ in millions)
4Q12
3Q12
Education
Finance
Total outstandings
$
23,119
23,504
Private
Portfolio
Private outstandings
$
10,654
10,553
Net charge-offs
38
27
as % of avg loans
1.41
%
1.02
30 days past due
$
233
231
as % of loans
2.19
%
2.19
Government
Guaranteed
Portfolio
Government outstandings
$
12,465
12,951 |
 Wells Fargo
4Q12 Supplement 36
Tier 1 common equity under Basel I
(1)
Wells Fargo & Company and Subsidiaries
FIVE
QUARTER
TIER
1
COMMON
EQUITY
UNDER
BASEL
I
Dec. 31,
Sept. 30
June 30,
Mar. 31,
Dec. 31,
($ in billions)
2012
2012
2012
2012
2011
Total equity
158.9
$
156.1
149.4
146.8
141.7
Noncontrolling interests
(1.3)
(1.4)
(1.3)
(1.3)
(1.5)
Total Wells Fargo stockholders' equity
157.6
154.7
148.1
145.5
140.2
Adjustments:
Preferred equity
(12.0)
(11.3)
(10.6)
(10.6)
(10.6)
Goodwill and intangible assets (other than MSRs)
(32.9)
(33.4)
(33.5)
(33.7)
(34.0)
Applicable deferred assets
3.2
3.3
3.5
3.7
3.8
Deferred tax asset limitation
-
-
-
-
-
MSRs over specified limitations
(0.7)
(0.7)
(0.7)
(0.9)
(0.8)
Cumulative other comprehensive income
(5.6)
(6.4)
(4.6)
(4.1)
(3.1)
Other
(0.5)
(0.4)
(0.5)
(0.4)
(0.4)
Tier 1 common equity
(A)
109.1
$
105.8
101.7
99.5
95.1
Total risk-weighted assets
(2)
(B)
1,077.9
$
1,067.1
$
1,008.6
996.8
1,005.6
Tier 1 common equity to total risk-weighted assets
(2)
(A)/(B)
10.12
%
9.92
10.08
9.98
9.46
(1) Tier 1 common equity is a non-generally accepted
accounting principle (GAAP) financial measure that is used by investors, analysts and bank regulatory
agencies to assess the capital position of financial services
companies. Management reviews Tier 1 common equity along with other measures of capital as
part of its financial analyses and has included this non-GAAP
financial information, and the corresponding reconciliation to total equity, because of current
interest in such information on the part of market participants.
(2) Under the regulatory guidelines for risk-based
capital, on-balance sheet assets and credit equivalent amounts of derivatives and off-balance sheet items are
assigned to one of several broad risk categories according to the
obligor, or, if relevant, the guarantor or the nature of any collateral. The aggregate dollar
amount in each risk category is then multiplied by the risk weight
associated with that category. The Company’s December 31, 2012, risk-weighted assets
and resulting Tier 1 common equity to total risk-weighted assets
are preliminary and reflect total estimated on-balance sheet and total estimated derivative
and off-balance sheet risk-weighted assets of $861.6 billion
and $216.3 billion, respectively. Effective September 30, 2012, the Company refined its
determination of the risk weighting of certain unused lending
commitments that provide for the ability to issue standby letters of credit and commitments
to issue standby letters of credit under syndication arrangements
where the Company has an obligation to issue in a lead agent or similar capacity beyond
its contractual participation level.
(1) |
 Wells Fargo
4Q12 Supplement 37
Tier 1 common equity under Basel III (Estimated)
(1)
Wells Fargo & Company and Subsidiaries
Dec. 31,
(in billions)
2012
Tier 1 common equity under Basel I
109.1
$
Adjustments
from
Basel
I
to
Basel
III
(3)(5)
:
Cumulative other comprehensive income related to AFS securities and
defined benefit pension plans
5.3
$
0.2
5.5
Threshold
deductions,
as
defined
under
Basel
III
(4) (5)
(0.7)
Tier 1 common equity anticipated under Basel III
(C)
113.9
$
Total
risk-weighted
assets
anticipated
(6)
(D)
1,393.1
$
Tier 1 common equity to total risk-weighted assets anticipated
under Basel III (C)/(D)
8.18
%
Other
Total adjustments from Basel I to Basel III
(1)
Tier 1 common equity is a non-generally accepted accounting
principle (GAAP) financial measure that is used by investors, analysts and bank regulatory
agencies to assess the capital position of financial services
companies. Management reviews Tier 1 common equity along with other measures of capital
as part of its financial analyses and has included this non-GAAP
financial information, and the corresponding reconciliation to total equity, because of
current interest in such information on the part of market
participants. (2)
The Basel III Tier 1 common equity and risk-weighted assets are
calculated based on management’s current interpretation of the Basel III capital rules
proposed by federal banking agencies in notices of proposed rulemaking
announced in June 2012. The proposed rules and interpretations and
assumptions used in estimating Basel III calculations are subject to
change depending on final promulgations of Basel III capital rules
(3)
Adjustments from Basel I to Basel III represent reconciling
adjustments, primarily certain components of cumulative other comprehensive income
deducted for Basel I purposes, to derive Tier 1 common equity under
Basel III. (4)
Threshold deductions, as defined under Basel III, include individual
and aggregate limitations, as a percentage of Tier 1 common equity, with respect to
MSRs, deferred tax assets and investments in unconsolidated financial
companies. (5)
Volatility in interest rates can have a significant impact on the
valuation of cumulative other comprehensive income and MSRs and therefore, may impact
adjustments from Basel I to Basel III, and MSRs subject to threshold
deductions, as defined under Basel III, in future reporting periods.
(6)
Under current Basel proposals, risk-weighted assets incorporate
different classifications of assets, with certain risk weights based on a borrower's credit
rating or Wells Fargo's own risk models, along with adjustments to
address a combination of credit/counterparty, operational and market risks, and other
Basel III elements. The amount of risk-weighted assets anticipated
under Basel III is preliminary and subject to change depending on final promulgation
of Basel III capital rulemaking and interpretations thereof by
regulatory authorities. TIER
1
COMMON
EQUITY
UNDER
BASEL
III
(ESTIMATED)
(1)(2)
under
Basel
III |
| Wells Fargo
4Q12 Supplement 38
Forward-looking statements and additional information
Forward-looking statements:
This Quarterly Supplement and management’s related presentation contain
forward-looking statements about our future financial performance.
These
forward-looking
statements
include
statements
using
words
such
as
“believe,”
“expect,”
“anticipate,”
“estimate,”
“target”, “should,”
“may,”
“can,”
“will,”
“outlook,”
“appears”
or similar expressions. These forward-looking statements may include,
among others, statements about: future credit quality and performance, including our current
expectation of future loan loss reserve releases; mortgage repurchase exposure;
exposure related to mortgage practices, including foreclosures and servicing; our
noninterest
expense
and
efficiency
ratio,
including
our
targeted
efficiency
ratio
range
as
part
of
our
expense
management
initiatives;
the future economic environment; loan growth; net interest income in a low interest rate
environment; our net interest margin, including our expectations regarding continued
pressure on our net interest margin given the low interest rate environment; reduction
or mitigation
of
risk
in
our
loan
portfolios;
future
effects
of loan modification programs; life-of-loan loss estimates; the
estimated impact of regulatory reform on our financial results and business and expectations
regarding our efforts to mitigate such impact;
our
estimated
Tier
1
common
equity
ratio
as
of December 31, 2012, under proposed Basel III capital rules; and future
common stock dividends, common share repurchases and other uses of capital. Investors
are urged to not unduly rely on forward- looking statements as actual results could
differ materially from expectations. Forward-looking statements speak only as of the date
made,
and
we
do
not
undertake
to
update
them
to
reflect
changes
or
events
that
occur
after
that
date.
For
more
information
about
factors that
could cause actual results to differ materially from expectations, refer
to pages 15-16 of Wells Fargo’s press release
announcing our fourth quarter 2012 results, as well as Wells Fargo’s reports filed with
the Securities and Exchange Commission, including the discussion under “Risk
Factors” in our Annual Report on Form 10-K for the year ended December 31,
2011. Purchased credit-impaired loan portfolio:
Loans that were acquired from Wachovia that were considered credit impaired were written down
at acquisition date in purchase accounting to an amount estimated to be collectible and
the related allowance for loan losses was not carried over to Wells Fargo’s
allowance. In addition, such purchased credit-impaired loans are not classified as
nonaccrual or nonperforming, and are not included in loans that were contractually 90+
days past due and still accruing. Any losses on such loans are charged against the nonaccretable
difference established in purchase accounting and are not reported as charge-offs (until
such difference is fully utilized). As a result of accounting for purchased loans with
evidence of credit deterioration, certain ratios of the combined company are not comparable to a
portfolio that does not include purchased credit-impaired loans.
In certain cases, the purchased credit-impaired loans may affect portfolio credit ratios
and trends. Management believes that the presentation of information adjusted to
exclude the purchased credit-impaired loans provides useful disclosure regarding the credit
quality of the non-impaired loan portfolio. Accordingly, certain of the loan balances and
credit ratios in this Quarterly Supplement have been adjusted to exclude the purchased
credit-impaired loans. References in this Quarterly Supplement to impaired loans mean
the
purchased
credit-impaired
loans.
Please
see
pages
31-33
of
the
press
release
for
additional
information
regarding
the
purchased
credit-impaired loans. |