Attached files
| file | filename |
|---|---|
| 8-K - CURRENT REPORT OF MATERIAL EVENTS OR CORPORATE CHANGES - Behringer Harvard Opportunity REIT I, Inc. | a13-2703_18k.htm |
Exhibit 99.1
|
|
Behringer Harvard Opportunity REIT I, Inc. 2012 Estimated Value Per Share Frisco Square, Frisco, TX |
|
|
Forward-Looking Statements Forward-looking statements that were true at the time made may ultimately prove to be incorrect or false. Behringer Harvard Opportunity REIT I, Inc. (the “REIT”) cautions investors not to place undue reliance on forward-looking statements, which reflect the REIT’s management’s view only as of the date of this presentation. The REIT undertakes no obligation to update or revise forward-looking statements to reflect changed assumptions, the occurrence of unanticipated events, or changes to future operating results. Factors that could cause actual results to differ materially from any forward-looking statements made in this presentation include changes in general economic conditions, changes in real estate conditions, availability of cash flow from operating activities for capital expenditures, the REIT’s level of debt and the terms and limitations imposed on it by its debt agreements, availability of credit generally and any failure to refinance or extend the REIT’s debt as it comes due or a failure to satisfy the conditions and requirements of that debt, the need to invest additional equity in connection with debt financings as a result of reduced asset values and requirements to reduce overall leverage, the REIT’s ability to raise capital in the future by issuing additional equity or debt securities, selling its assets or otherwise, construction cost overruns, construction delays, increases in interest rates, lease-up risks, conflicts of interest arising out of the REIT’s relationships with its advisor and its affiliates. The forward-looking statements should be read in light of the risk factors identified in the “Risk Factors” section of the REIT’s Annual Report on Form 10-K for the year ended December 31, 2011, as filed with the SEC on March 29, 2012, and the risks identified in Part II, Item 1A of its subsequent quarterly reports on Form 10-Q as filed with the SEC on August 14, 2012 and November 13, 2012. The REIT’s filings are available free of charge at the SEC’s website at sec.gov or at the website maintained for the REIT at behringerharvard.com. 3 |
|
|
Valuation Process Rigorous process consistent with the REIT’s Estimated Valuation Policy Asset-by-asset evaluation of each property by Advisor Analysis and review by, and consultations with, Robert A. Stanger & Co. Board obtained Robert A. Stanger & Co.’s opinion regarding reasonableness and appropriateness of methods used by Advisor Methodology: Discounted cash flow Sales comparables Cost analysis Appraisals Sales contracts; purchase offers; and valuation information provided by Advisor Board unanimously approved the $3.58 estimated per-share value Central Europe Portfolio 4 |

|
|
Valuation Summary 2011 Estimated Value Per Share $4.12 Real Estate Portfolio: Royal Island (0.38) Rio Salado (0.11) Frisco Square 0.18 Other real estate assets 0.02 Debt-Related: Interest and financing costs and loan prepayments (0.06) Asset Sales, Reinvestment in Existing Assets and Other Items: Asset sales, reinvestment in portfolio, and other operating costs (0.19) 2012 Estimated Value Per Share $3.58 Change in Value Per Share: $(0.54) 5 |

|
|
Asset Sales Provided Important Liquidity 2012 Asset Sales Santa Clara Tech Center Tanglewood at Voss Bowen Road Data Center Bent Tree Green Improved Cash Position (in millions) Sept. 30, 2012 March 31, 2012 Dec. 31, 2011 Cash and cash equivalents $51.4 $10.8 $13.5 Chase Park Plaza, St. Louis, MO 6 |

|
|
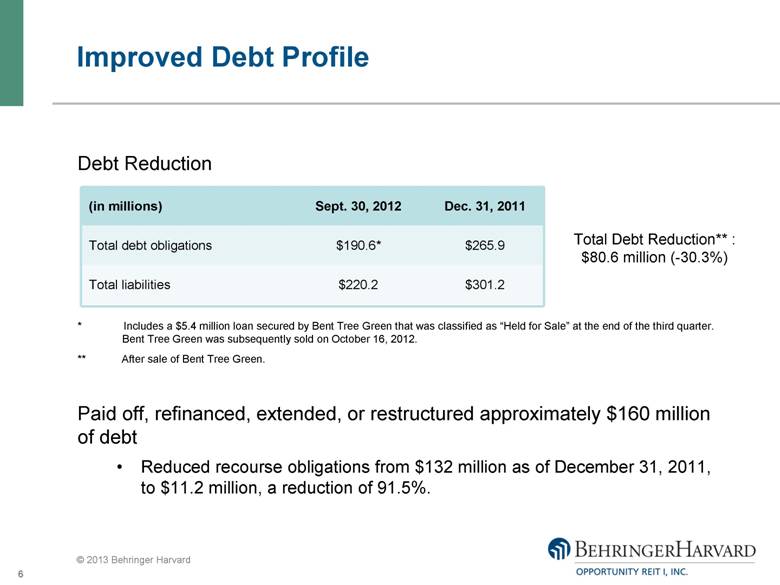
Improved Debt Profile Debt Reduction * Includes a $5.4 million loan secured by Bent Tree Green that was classified as “Held for Sale” at the end of the third quarter. Bent Tree Green was subsequently sold on October 16, 2012. ** After sale of Bent Tree Green. Paid off, refinanced, extended, or restructured approximately $160 million of debt Reduced recourse obligations from $132 million as of December 31, 2011, to $11.2 million, a reduction of 91.5%. Chase Park Plaza, St. Louis, MO (in millions) Sept. 30, 2012 Dec. 31, 2011 Total debt obligations $190.6* $265.9 Total liabilities $220.2 $301.2 Total Debt Reduction** : $80.6 million (-30.3%) 7 |
|
|
Success at Frisco Square Voluntary Chapter 11 bankruptcy filing in June 2012 Filed Plan of Reorganization in October 2012 Bankruptcy Court confirmed Plan in December 2012 On December 27, 2012, entered into a modification and extension of loans secured by Frisco Square $16.5 million cash pay down 5-year term, with 2-year extension option Total current balance of Frisco Square loans is $31.9 million On January 2, 2013, emerged from bankruptcy Bankruptcy filing preserved value for shareholders Frisco Square’s 2012 estimated per-share value is $0.18 greater than 2011* Frisco Square, Frisco, TX * Based on appraised value of $79.8 million as of August 12, 2012 by McRoberts & Co. |

|
|
Royal Island, Bahamas 2012 valuation reflects lack of sales of comparable properties and tepid demand from opportunistic investors and developers 2012 estimated per-share value is $0.38 lower than 2011 Do not plan to invest significant additional capital in Royal Island Continuing to evaluate strategies to recapitalize and develop, or sell Rio Salado, Phoenix, Arizona Continuing to market for sale Local-market fundamentals remain weak for industrial development properties 2012 estimated per-share value is $0.11 lower than 2011 Royal Island and Rio Salado 9 |
