Attached files
| file | filename |
|---|---|
| 8-K - FORM 8-K - OCCIDENTAL PETROLEUM CORP /DE/ | form8k-20130108.htm |
EXHIBIT 99.1
Occidental Petroleum Corporation
Goldman Sachs Global Energy Conference 2013
Goldman Sachs Global Energy Conference 2013
Stephen I. Chazen
President and Chief Executive Officer
President and Chief Executive Officer
January 8 - 9, 2013
1

2

Christopher G. Stavros
Vice President and Treasurer
212-603-8184 | chris_stavros@oxy.com
Christopher M. Degner
Senior Director - Investor Relations
212-603-8185 | christopher_degner@oxy.com
Vice President and Treasurer
212-603-8184 | chris_stavros@oxy.com
Christopher M. Degner
Senior Director - Investor Relations
212-603-8185 | christopher_degner@oxy.com
Anthony J. Cottone
Manager - Investor Relations
212-603-8188 | anthony_cottone@oxy.com
Manager - Investor Relations
212-603-8188 | anthony_cottone@oxy.com
3
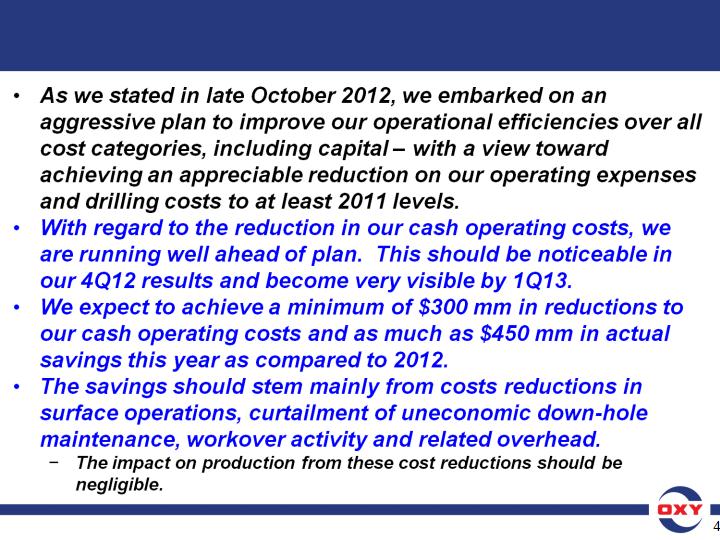
Oil & Gas - Improved Capital Efficiency &
Operating Cost Reduction Program
Operating Cost Reduction Program
Oil & Gas - Improved Capital Efficiency &
Operating Cost Reduction Program
Operating Cost Reduction Program
4
Oil & Gas - Improved Capital Efficiency &
Operating Cost Reduction Program
Operating Cost Reduction Program
Oil & Gas - Improved Capital Efficiency &
Operating Cost Reduction Program
Operating Cost Reduction Program
5

This page left intentionally blank.
6
7
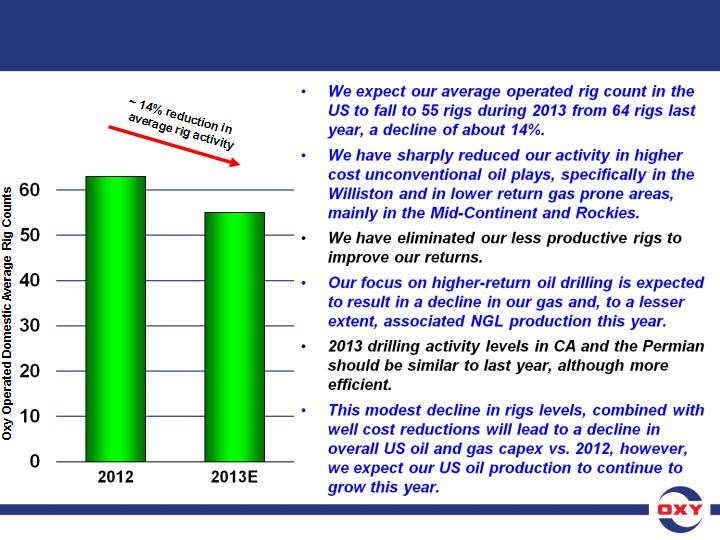
64
Oxy’s US Operated Rig Activity
55
7

8
First Nine Months 2012 Results - Summary
First Nine Months 2012 Results - Summary
|
|
YTD 2012
|
YTD 2011
|
|
• Income from continuing operations
|
$4,271
|
$4,999
|
|
• EPS (diluted) from continuing operations
|
$5.26
|
$6.14
|
|
|
|
|
|
• Net Income
|
$4,262
|
$5,137
|
|
• Reported EPS (diluted)
|
$5.25
|
$6.31
|
|
|
|
|
|
• Worldwide oil and gas production volumes
(mboe/d) +5% |
762
|
728
|
|
• US oil and gas production volumes
(mboe/d) +10% |
462
|
420
|
|
|
|
|
|
• Capital Spending
|
$7,716
|
$4,969
|
|
• Cash Flow from Operations
|
$8,500
|
$8,600
|
|
|
|
|
|
|
|
|
|
|
|
|
|
|
|
|
($ in millions, except EPS data)
8

9
Overriding Goal is to Maximize Total Shareholder Return
• We believe this can be achieved through a combination of:
• Growing our oil and gas production by 5% to 8% per year on
average over the long term;
average over the long term;
• Allocating and deploying capital with a focus on achieving
well above cost-of-capital returns (ROE and ROCE);
well above cost-of-capital returns (ROE and ROCE);
– Return Targets*
• Domestic - 15+%
• International - 20+%
• Consistent dividend growth, that is superior to that of our
peers.
peers.
*Assumes Moderate Product Prices
What Is Our Philosophy & Strategy?
What Is Our Philosophy & Strategy?
9

This page left intentionally blank.
10

11
1. Base/Maintenance Capital
2. Dividends
3. Growth Capital
4. Acquisitions
5. Share Repurchase
Cash Flow Priorities
11

12
• Our ability to pay dividends is indicated by our free cash
flow generation.
flow generation.
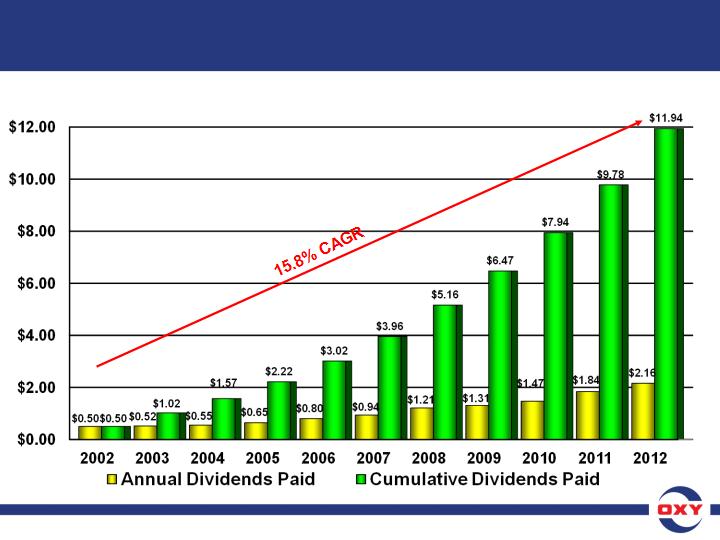
• In February 2012 the Board of Directors increased the
company’s dividend by 17% to an annualized rate of $2.16
per share, compared to the previous annual rate of $1.84.
company’s dividend by 17% to an annualized rate of $2.16
per share, compared to the previous annual rate of $1.84.
• We have now increased our dividend every year for 10
consecutive years, and a total of 11 times during that
period.
consecutive years, and a total of 11 times during that
period.
• This increase brings the company’s compound annual
dividend growth rate over the last 10 years to 15.8%.
dividend growth rate over the last 10 years to 15.8%.
• We expect to increase our dividends again this year and
in the future at a rate that would maximize returns to our
stockholders.
in the future at a rate that would maximize returns to our
stockholders.
Consistent Dividend Growth
12
13
Consistent Dividend Growth
Note: Dividends paid as per the Record Date
($/share)
13
14
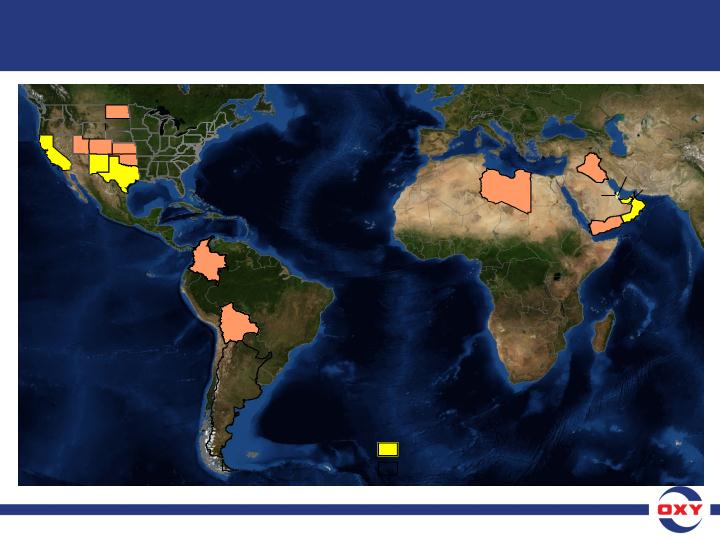
Worldwide Oil & Gas Producing Areas
Colombia
Colombia
Libya
Libya
Oman
Oman
UAE
UAE
Yemen
Yemen
Bolivia
Bolivia
Qatar
Qatar
Iraq
Iraq
Bahrain
Bahrain
Focus Areas
United States
United States
Permian
Permian
Basin
Basin
California
California
14
15
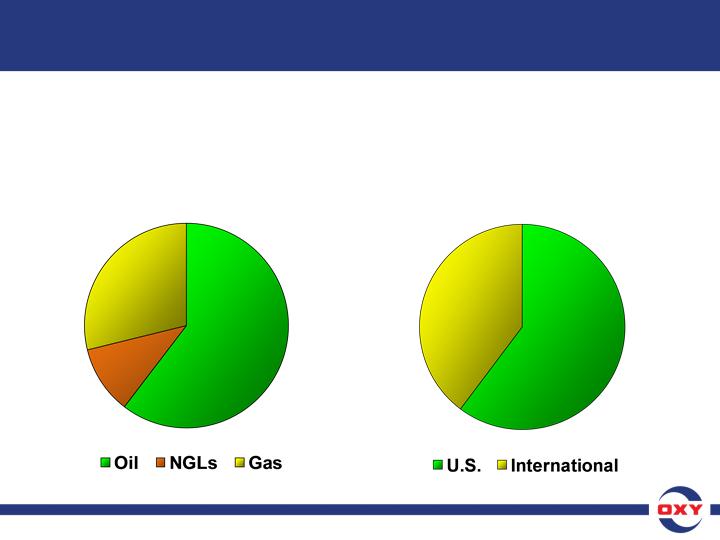
Oil & Gas Production
9 months - 2012
(Million barrels of oil equivalent)
9 months - 2012
(Million barrels of oil equivalent)
126
61%
82
39%
127
60%
59
29%
22
11%
Oxy Is Primarily a Domestic Oil Producer
Oxy Is Primarily a Domestic Oil Producer
15
16
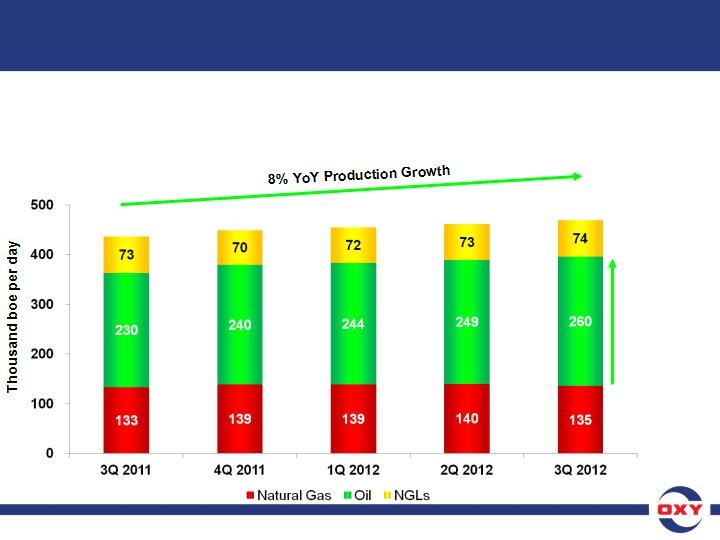
436
449
455
462
469
• Total U.S. production in 3Q12 was 469 mboe/d, up 7 mboe/d from 2Q12 the
8th consecutive quarterly domestic volume record for Oxy. Year-over-year,
production grew by 8%, or 33 mboe/d, of which 30 mb/d was oil growth.
8th consecutive quarterly domestic volume record for Oxy. Year-over-year,
production grew by 8%, or 33 mboe/d, of which 30 mb/d was oil growth.
+30 mb/d oil
production
growth
production
growth
Key Performance Metrics - Production Growth
Key Performance Metrics - Production Growth
16
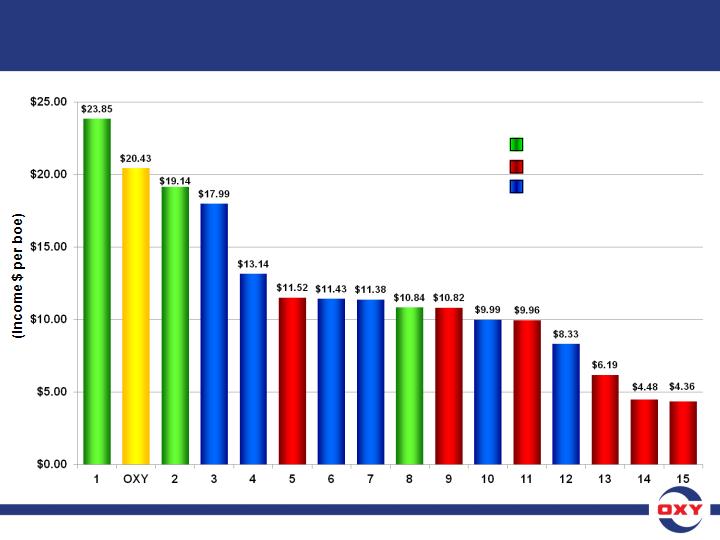
Peer Company -
Income per Boe of Production
Income per Boe of Production
17
(Nine Months ended 9/30/12)
Integrated O&G
Large Cap Independent E&P
S/Mid Cap Oil Focused E&P
17
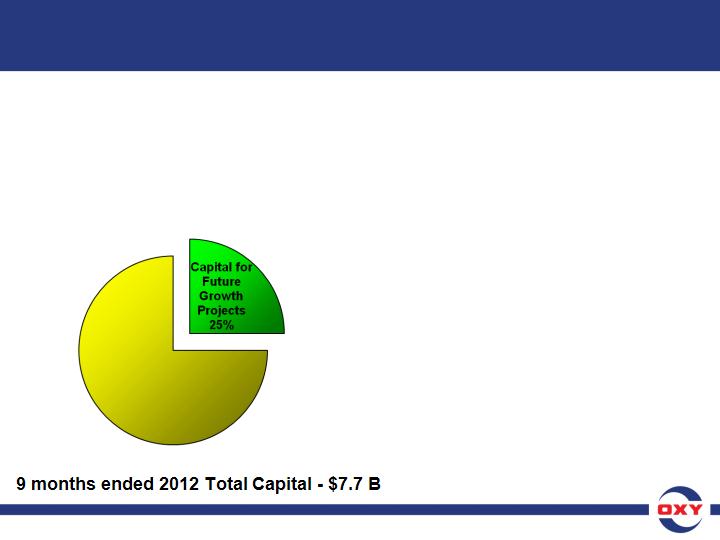
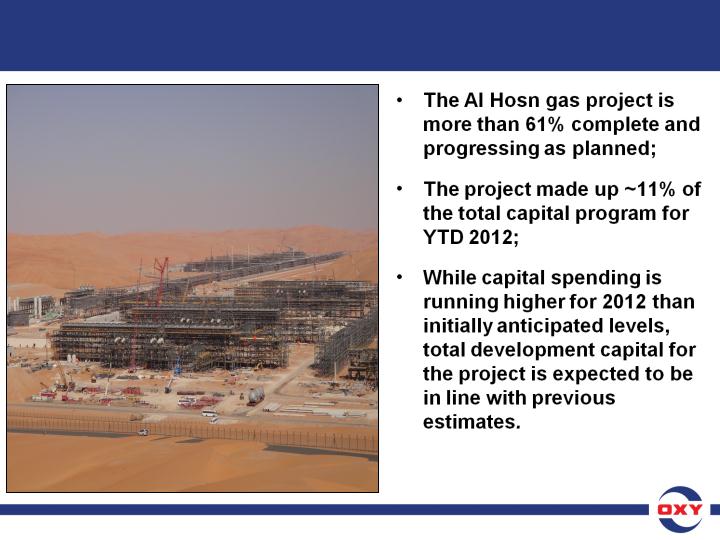
• These expenditures include
capital for:
capital for:
– the Al Hosn Shah gas project
which is expected to start
production in late 2014;
which is expected to start
production in late 2014;
– gas and CO2 processing
plants and pipelines to
maintain or expand the
capacity of these facilities to
handle future production
increases;
plants and pipelines to
maintain or expand the
capacity of these facilities to
handle future production
increases;
– the chemical segment, and
other items.
other items.
18
Capital Spending
Capital Spending
• In 2012, we expected to spend
~25% of our total capital
expenditures on future growth
projects that will contribute to
our operations over the next
several years.
~25% of our total capital
expenditures on future growth
projects that will contribute to
our operations over the next
several years.
18
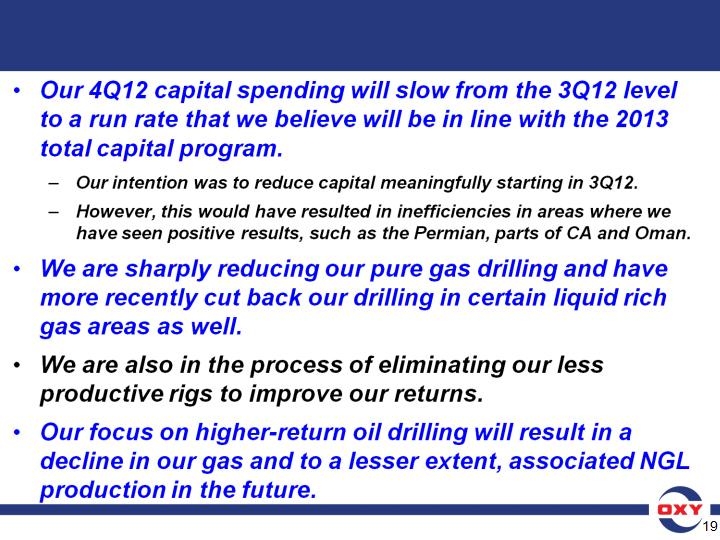
4Q12 Outlook - Capital Program
4Q12 Outlook - Capital Program
19

This page left intentionally blank.
20
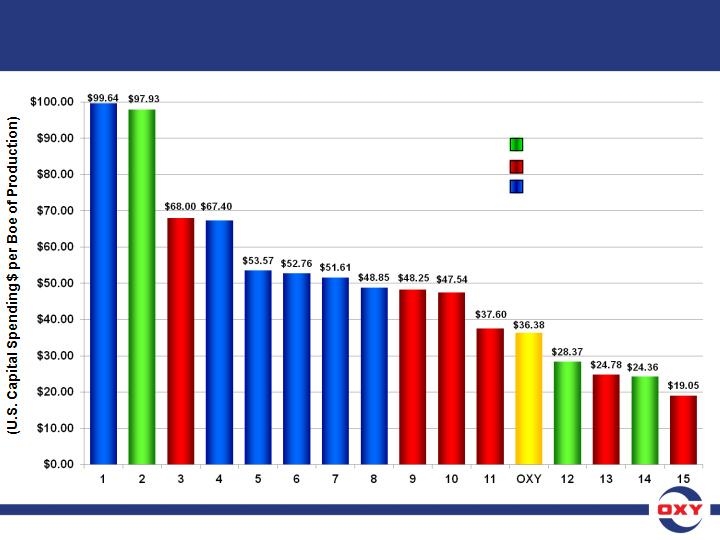
Peer Company -
U.S. Capital Spending per Boe of Production
U.S. Capital Spending per Boe of Production
21
(Nine Months ended 9/30/12)
Integrated O&G
Large Cap Independent E&P
S/Mid Cap Oil Focused E&P
21

22
• Over the past year, we have achieved our goal of
increasing domestic production by 6 to 8 mboe/d
quarter-over-quarter.
increasing domestic production by 6 to 8 mboe/d
quarter-over-quarter.
– We expect our 4Q12 oil production to grow by about this much.
– However, the expected decline in gas production resulting from
the change in our capital program focus may offset some of the
increased oil production on an equivalent basis.
the change in our capital program focus may offset some of the
increased oil production on an equivalent basis.
• Internationally, at current prices we expect production
to be approximately flat with 3Q12, while sales volumes
increase slightly.
to be approximately flat with 3Q12, while sales volumes
increase slightly.
4Q12 Outlook - Oil and Gas Production
22

23
• Base 5 - 8% Compounded Average Annual Growth
– Current California risked prospects
– Non-CO2 & CO2 in the Permian
– Oman
• Upside from Existing Holdings
– New California conventional and unconventional prospects
– Permian exploration
– Williston Basin & Rockies
– Oman exploration
– Bahrain and Iraq
• Additional opportunities from balance sheet and cash
generation
generation
– Domestic property acquisitions
– New Middle East projects
Oil & Gas Volume Growth Drivers
23
24
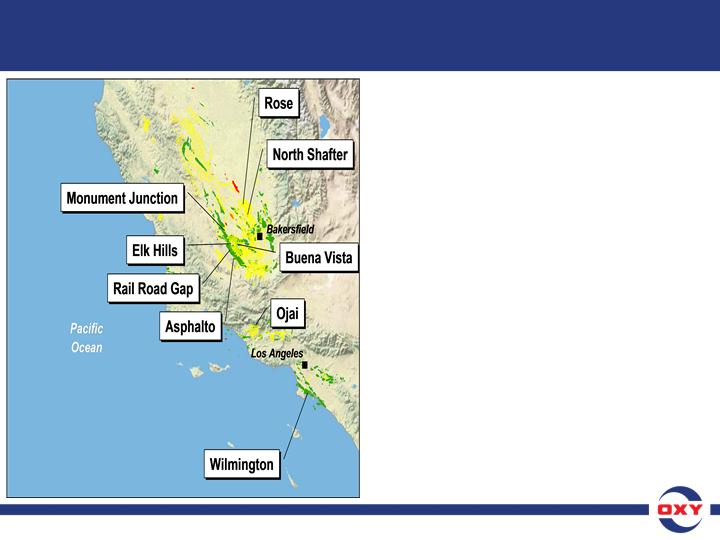
California Overview
California Overview
Los Angeles
Los Angeles
Bakersfield
Bakersfield
Oxy Acreage
• Largest acreage holder in CA
with ~1.7 mm acres, majority of
which are net mineral interests
with ~1.7 mm acres, majority of
which are net mineral interests
• 3Q12 production of 147 mboe/d
• Diverse geologic
characteristics and numerous
reservoir targets
characteristics and numerous
reservoir targets
• Development opportunities
range from conventional to
steam floods, water floods and
shales
range from conventional to
steam floods, water floods and
shales
• Drilling costs and expected
ultimate recoveries (EURs) vary
for each opportunity
ultimate recoveries (EURs) vary
for each opportunity
• 78% interest in the Elk Hills
Field — the largest producer of
gas and NGLs in CA
Field — the largest producer of
gas and NGLs in CA
24
25
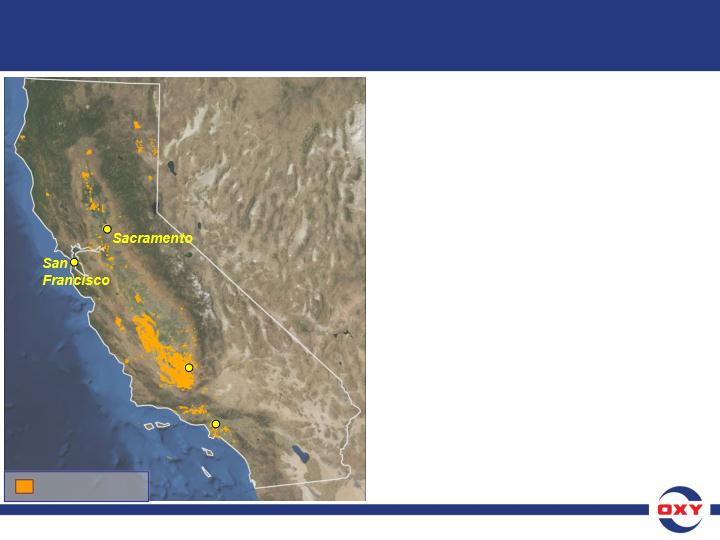
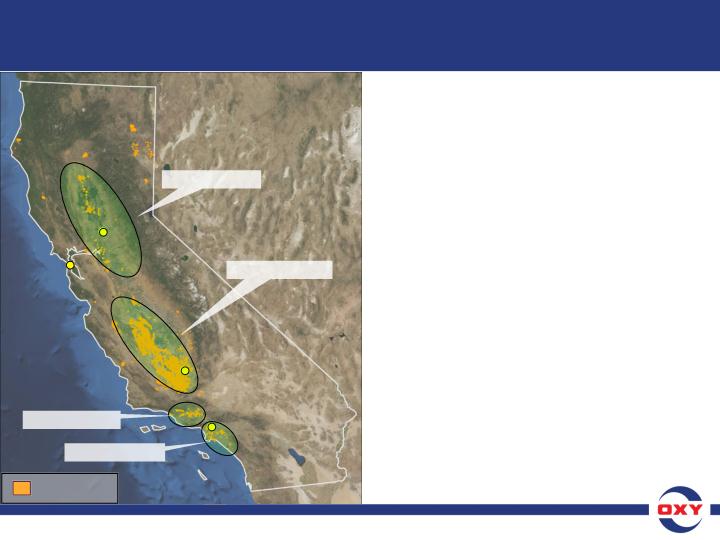
California Conventional Exploration
• World Class Province
– 35+ Billion BOE discovered
– 5 of top 12 U.S. oil fields
• Significant Remaining Potential
– Large undiscovered resources
– Multiple play and trap types
• Underexplored
• Oxy
– Major producer
– Largest acreage holder
– Successful explorer
– Multi-year prospect inventory
Sources:
California Division of Oil, Gas & Geothermal Resources
Gibson Consulting
Oxy Fee/Lease
2 Billion BOE
20 Billion BOE
3 Billion BOE
10 Billion BOE
Major Producing
Basins
Sacramento
Sacramento
San
Francisco
Francisco
San
Francisco
Francisco
Los Angeles
Los Angeles
Bakersfield
Bakersfield
25
26
• Multi-year inventory of drill sites in
CA, many of which are both outside
of Elk Hills proper & the Kern County
Discovery Area
CA, many of which are both outside
of Elk Hills proper & the Kern County
Discovery Area
• 30-day initial production rate for
these wells is between 300 and 400
BOE per day
these wells is between 300 and 400
BOE per day
• For the shale wells outside Elk Hills,
~80% of the BOE production is a
combination of black oil and high-
value condensate
~80% of the BOE production is a
combination of black oil and high-
value condensate
• We expect the cost of drilling and
completing unconventional wells to
decline significantly over the medium
-term
completing unconventional wells to
decline significantly over the medium
-term
California Unconventional “Shale” Program
26

27
• Total CA production growth on a BOE basis is slower than we
thought it would be, in part due to the Elk Hills decline, permitting
issues and more recently low gas prices.
thought it would be, in part due to the Elk Hills decline, permitting
issues and more recently low gas prices.
• On a positive note, overall performance of the new resources has
been consistent with expectations, including our unconventional
opportunities for which well performance is similar to the type curves
we disclosed a couple of years ago.
been consistent with expectations, including our unconventional
opportunities for which well performance is similar to the type curves
we disclosed a couple of years ago.
• We will continue our focus on higher return, low cost opportunities in
CA, and this is a very diverse opportunity set.
CA, and this is a very diverse opportunity set.
• For example, Lost Hills - a major steam flood project
– We expect to achieve significant production growth to about 15 mb/d in several
years from the current 4 mb/d;
years from the current 4 mb/d;
– Total oil in place in Lost Hills is estimated to be about 500 million barrels;
– Using reasonable assumptions, we expect to recover over 50 million barrels
net to Oxy;
net to Oxy;
– Our drilling costs in this area average in the low $200,000's per well
and we expect to bring this average cost down over time.
and we expect to bring this average cost down over time.
California Update
California Update
27
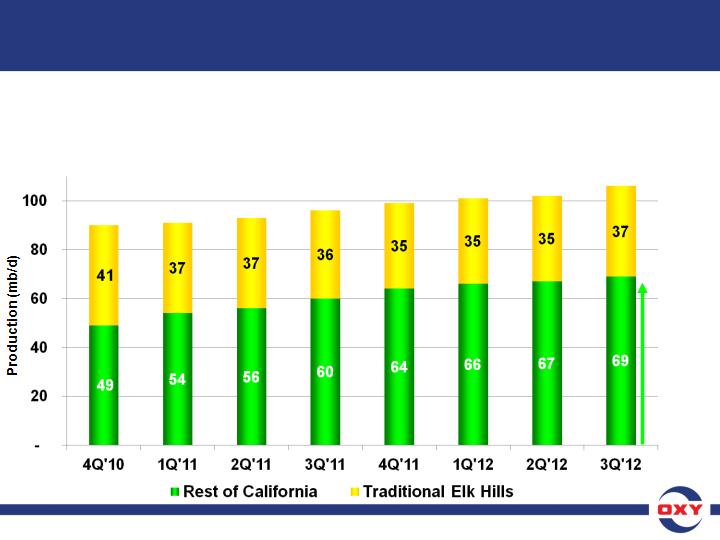
28
• In mid-2010, we shifted our development program to conventional and
unconventional opportunities outside of the traditional and more mature
Elk Hills areas.
unconventional opportunities outside of the traditional and more mature
Elk Hills areas.
90
91
93
96
99
101
102
106
Liquids Production Volumes
California Liquids Production
+20 mb/d
production
growth
production
growth
28
29
• Over the last several years we
have spent $370 mm on the
new Elk Hills gas plant.
have spent $370 mm on the
new Elk Hills gas plant.
• The plant went into operation in
early July and, notwithstanding
initial startup issues, is
positively affecting our
operational efficiency and
production including higher
liquids yields.
early July and, notwithstanding
initial startup issues, is
positively affecting our
operational efficiency and
production including higher
liquids yields.
• The plant operated optimally
for about one month in 3Q12
and has been operating as
expected since.
for about one month in 3Q12
and has been operating as
expected since.
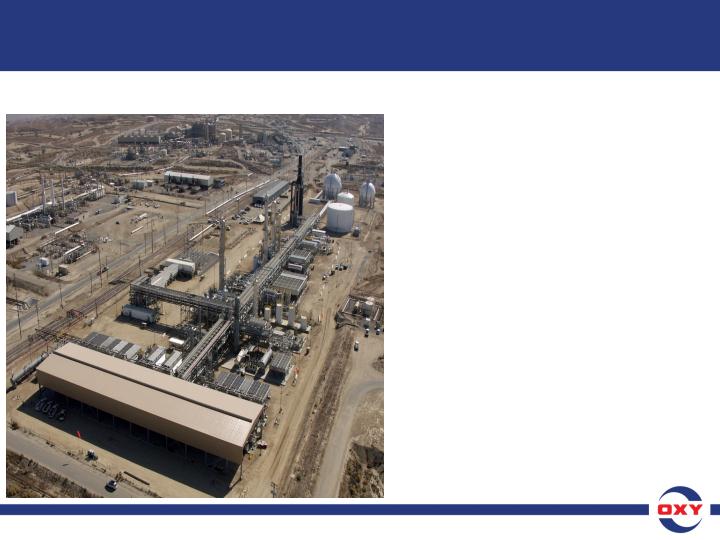
California Gas Processing Plant
California Gas Processing Plant
Elk Hills Cryogenic Gas Processing Plant
29

This page left intentionally blank.
30
31
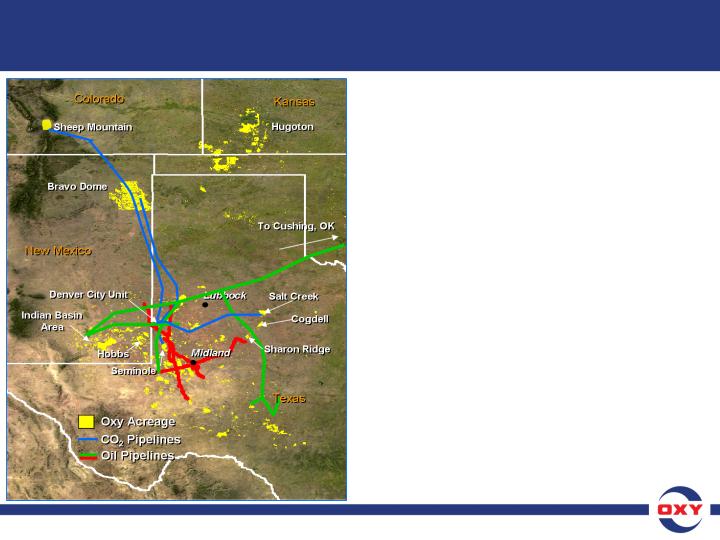
Permian Basin Overview
• 3Q12 production of 209 mboe/d
• Largest oil producer in Permian
(~15% net share of total)
(~15% net share of total)
• Largest operator in Permian
(of 1,500+ operators)
(of 1,500+ operators)
• ~64% of Oxy’s Permian oil
production is from CO2 related
EOR projects - Oxy’s most
profitable business
production is from CO2 related
EOR projects - Oxy’s most
profitable business
• Drilled ~409 wells on operated
properties in 2011
properties in 2011
• Have another 2.5 BBOE of likely
recoverable resource
recoverable resource
• 1.7 bcf/d (0.5 tcf/year) of CO2
• Ample supply of CO2 accelerates
project implementations
project implementations
31
32
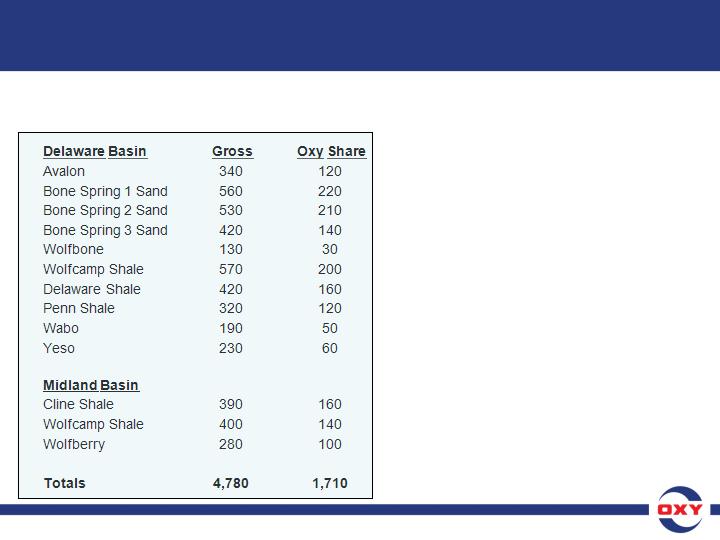
Acreage in Select Permian Plays
(Thousands of Acres)
• Permian non-CO2 business is one
of Oxy’s fastest growing assets;
of Oxy’s fastest growing assets;
• Since beginning delineation and
development efforts in 2010, we
have grown production by +25%;
development efforts in 2010, we
have grown production by +25%;
• As a result of the significant
activity by us and our partners,
our Permian acreage where we
believe resource development is
likely, has grown from our
estimate of about 3 mm gross
acres earlier in the year to about
4.8 mm acres in October;
activity by us and our partners,
our Permian acreage where we
believe resource development is
likely, has grown from our
estimate of about 3 mm gross
acres earlier in the year to about
4.8 mm acres in October;
• Oxy's net share of this acreage
grew from about 1 mm acres to
about 1.7 mm acres during the
same period.
grew from about 1 mm acres to
about 1.7 mm acres during the
same period.
Permian non-CO2 Business
32
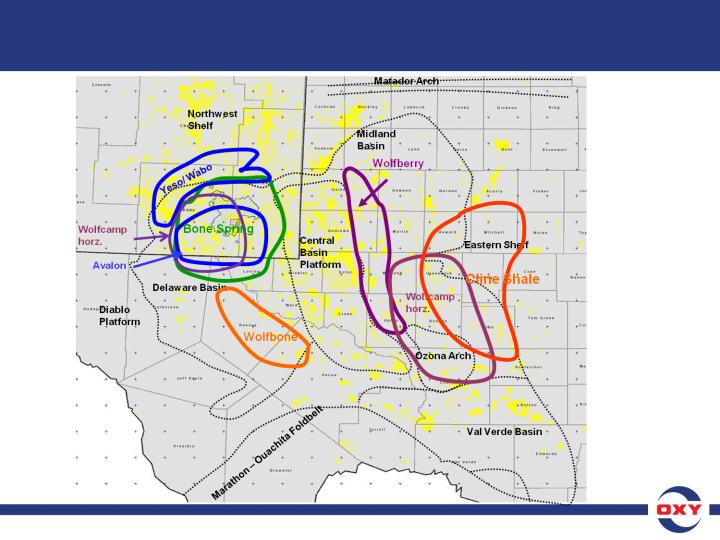
33
Map of Select Permian Basin Plays
33
34
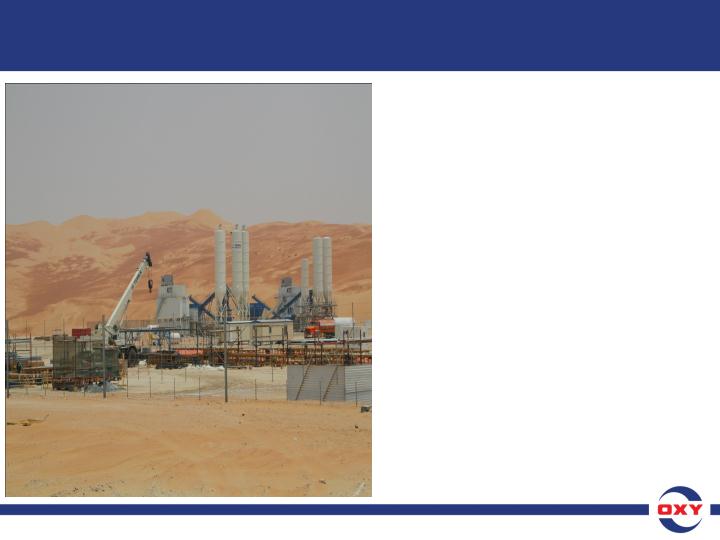
Abu Dhabi - Al Hosn Gas Project (Shah Field)
• Shah Gas Field one of the largest
in the Middle East;
in the Middle East;
• Oxy holds a 40% participating
interest under a 30-year contract;
interest under a 30-year contract;
• The project involves development
of high-sulfur content reservoirs
within the Shah field, located
onshore ~180 km so. west of Abu
Dhabi;
of high-sulfur content reservoirs
within the Shah field, located
onshore ~180 km so. west of Abu
Dhabi;
• Production start-up is scheduled
in late 2014;
in late 2014;
• Anticipated to produce ~500
mmcf/d of sales gas and 50 mboe/d
of NGLs and condensate -
providing net to Oxy ~200 mmcf/d
of gas and ~20 mboed of NGLs and
condensate.
mmcf/d of sales gas and 50 mboe/d
of NGLs and condensate -
providing net to Oxy ~200 mmcf/d
of gas and ~20 mboed of NGLs and
condensate.
34
35
Abu Dhabi - Al Hosn Gas Project (Shah Field)
35

This page left intentionally blank.
36
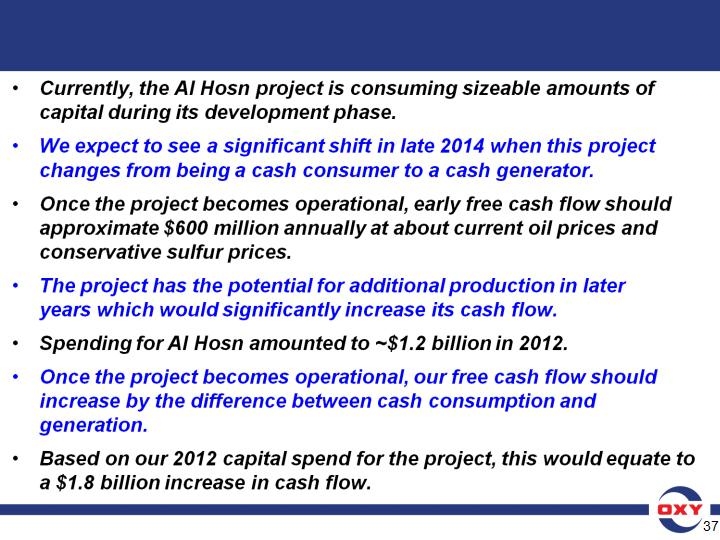
Abu Dhabi - Al Hosn Gas Project (Shah Field)
37

This page left intentionally blank.
38
39
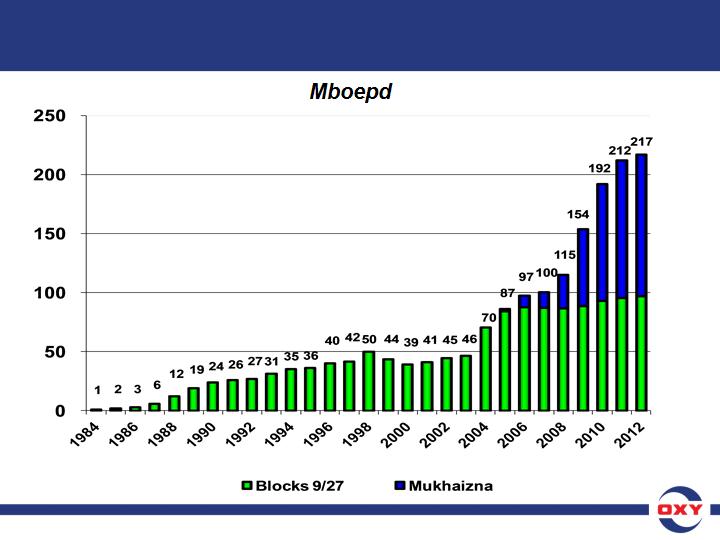
Oxy Oman Gross Production Growth
39
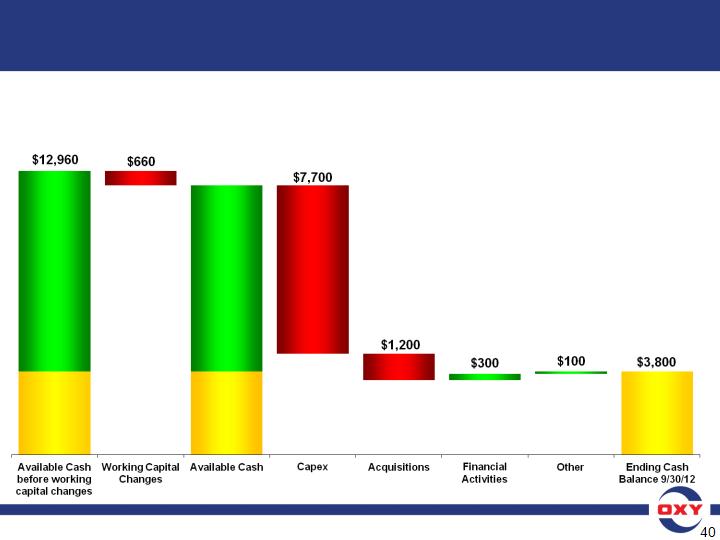
– Working capital reduced our nine-month cash flow from operations of $9.2 billion by ~$660 mm to $8.5 billion.
~$510 mm of working capital use occurred in 3Q12. Capex was $7.7 billion for the first nine months, of which
$2.6 billion was spent in 3Q12; YTD capex was 82% in oil and gas, 14% in midstream and remainder in chemicals.
Financial activities, which included dividends paid, stock buybacks and a $1.74 billion borrowing earlier this year,
provided a net $300 mm of cash flow.
($ in millions)
Cash Flow
From
Operations
before
Working
Capital
changes
From
Operations
before
Working
Capital
changes
$9,160
Beginning
Cash
$3,800
12/31/11
Cash
$3,800
12/31/11
Beginning
Cash
$3,800
12/31/11
Cash
$3,800
12/31/11
Cash Flow
From
Operations
$8,500
From
Operations
$8,500
$12,300
Summary of YTD 2012 Cash Flow
40

41
Gross Cash Flow Uses
Gross Cash Flow Uses
Dividends
Debt Reduction &
Cash
Cash
Share Repurchase
Acquisitions
Capital
100
9
20
14
16
41
2007
100
9
16
2
29
44
2011
Percentage of Total
100
9
3
21
26
41
2006
100
8
-
13
40
39
2008
100
16
3
-
27
54
2009
100
10
15
-
42
33
2010
Sub-Total
57
73
66
79
81
75
31
42
5-yr avg.
73
41

This page left intentionally blank.
42

43
• Company’s core business is acquiring assets that can provide
future growth through improved recovery.
future growth through improved recovery.
– Foreign contracts
– Domestic add-ons
– Small incremental additions to production in short term
• Generate returns of at least 15% in the US and 20% overseas.
• Overall average finding & development costs of less than 25%
of selling price.
of selling price.
• Our program continues to generate a significant amount of free
cash flow after capital.
cash flow after capital.
• Acquisitions are measured against reinvesting in the existing
business with the goal of enhancing company value.
business with the goal of enhancing company value.
• Large number of opportunities over 5-year period.
• Deep inventory of high-return opportunities eliminates the need
to pursue capital intensive acquisitions.
to pursue capital intensive acquisitions.
Acquisition Strategy
43

44
• 5 - 8% base annual production growth over the long term
• Opportunity for additional volume growth
• Returns on invested capital significantly in excess of the
Company’s cost of capital
Company’s cost of capital
• Consistent, annual increases in dividends
• Significant financial flexibility for opportunities in distressed
periods
periods
• Conservative financial statements
• Committed to generating stock market value which is greater
than earnings retained
than earnings retained
• We believe this will generate top quartile returns for our
shareholders
shareholders
Oxy - Investment Attributes
44

Cautionary Statement
45
Portions of this presentation contain forward-looking statements and involve risks and uncertainties that could materially affect
expected results of operations, liquidity, cash flows and business prospects. Factors that could cause results to differ
materially include, but are not limited to: higher-than-expected costs; global commodity pricing fluctuations; supply and demand
considerations for Occidental’s products; general domestic political and regulatory approval conditions; political events; not
successfully completing, or any material delay of, any development of new fields, expansion projects, capital expenditures,
efficiency-improvement projects, acquisitions or dispositions; potential failure to achieve expected production from existing and
future oil and gas development projects; exploration risks such as drilling unsuccessful wells; any general economic recession
or slowdown domestically or internationally; potential liability for remedial actions under existing or future environmental
regulations and litigation; potential liability resulting from pending or future litigation; general domestic and international political
conditions; potential disruption or interruption of Occidental’s production or manufacturing or damage to facilities due to
accidents, chemical releases, labor unrest, weather, natural disasters or insurgent activity; failure of risk management; changes
in law or regulations; or changes in tax rates. The United States Securities and Exchange Commission (SEC) permits oil and
natural gas companies, in their SEC filings, to disclose only reserves anticipated to be economically producible, as of a given
date, by application of development projects to known accumulations. We use certain terms in this presentation, such as net-in
-place, net risked reserves, de-risked, EUR (expected ultimate recovery), discovered barrels, likely recoverable resources, net
remaining and oil in place, that the SEC’s guidelines strictly prohibit us from using in our SEC filings. These terms represent
our internal estimates of volumes of oil and gas that are not proved reserves but are potentially recoverable through exploratory
drilling or additional drilling or recovery techniques and are not intended to correspond to probable or possible reserves as
defined by SEC regulations. By their nature these estimates are more speculative than proved, probable or possible reserves
and subject to greater risk they will not be realized. You should not place undue reliance on these forward-looking statements,
which speak only as of the date of this presentation. Unless legally required, Occidental does not undertake any obligation to
update any forward-looking statements, as a result of new information, future events or otherwise. U.S. investors are urged to
consider carefully the disclosures in our 2011 Form 10-K, available through the following toll-free number 1-888-OXYPETE (1-
888-699-7383) or on the internet at http://www.oxy.com. You also can obtain a copy form the SEC by calling 1-800-SEC-0330.
We post or provide links to important information on our website including investor and analyst presentations, certain board
committee charters and information that SEC requires companies and certain of its officers and directors to file or furnish.
Such information may be found in the “Investor Relations” and “Social Responsibility” portions of the website.
45
Occidental Petroleum Corporation
46
46