Attached files
| file | filename |
|---|---|
| 8-K - FORM 8-K - KBS Real Estate Investment Trust, Inc. | kbsri8k.htm |

Exhibit 99.1
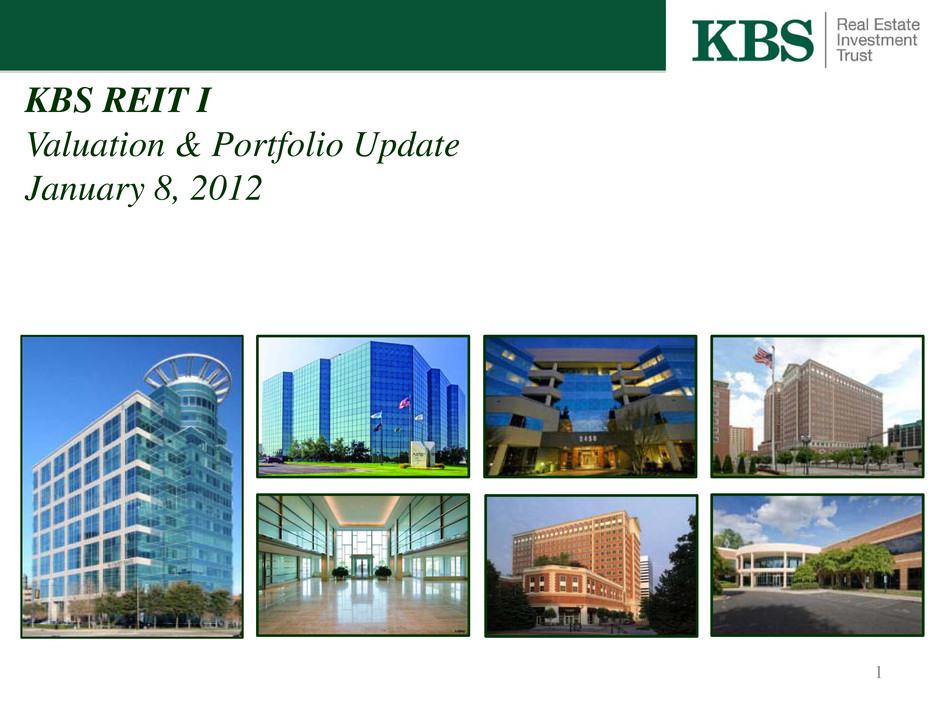
KBS REIT I Valuation & Portfolio Update January 8, 2012 1

Forward-Looking Statements The information contained herein should be read in conjunction with, and is qualified by, the information in KBS Real Estate Investment Trust’s (“KBS REIT I”) Annual Report on Form 10-K for the year ended December 31, 2011, filed with the Securities and Commission Exchange (the “SEC”) on March 26, 2012 (the “Annual Report”), and in KBS REIT I’s Quarterly Report on Form 10-Q for the quarter ended September 30, 2012, filed with the SEC on November 14, 2012, including the “Risk Factors” contained in such filings. For a full description of the limitations, methodologies and assumptions used to value KBS REIT I’s assets and liabilities in connection with the calculation of KBS REIT I’s estimated value per share, see KBS REIT I’s Current Report on Form 8-K, filed with the SEC on December 19, 2012. Forward-Looking Statements Certain statements contained herein may be deemed to be forward-looking statements under federal securities laws. These statements include statements regarding the intent, belief or current expectations of KBS REIT I and members of its management team, as well as the assumptions on which such statements are based, and generally are identified by the use of words such as “may,” “will,” “seeks,” “anticipates,” “believes,” “estimates,” “expects,” “plans,” “intends,” “should” or similar expressions. The valuation methodology for KBS REIT I’s real estate investments assumes the properties realize the projected cash flows and expected exit cap rates and that investors would be willing to invest in such properties at yields equal to the expected discount rates. Though these are KBS REIT I’s and KBS Capital Advisors LLC’s (the “Advisor”) best estimates as of December 18, 2012, KBS REIT I can give no assurance in this regard. These statements also depend on factors such as: KBS REIT I’s ability to maintain occupancy levels and lease rates at its properties; the borrowers under KBS REIT I’s loan investments continuing to make required payments under the investments; the ability of certain borrowers to maintain occupancy levels and lease rates at the properties securing KBS REIT I’s real estate-related investments; KBS REIT I’s ability to successfully negotiate modifications, extensions or refinancings of its debt obligations; the ability of KBS REIT I to sell assets to make required amortization payments and principal payments on its debt obligations and to fund its short and long-term liquidity needs; KBS REIT I’s ability to successfully operate and sell the properties transferred to it under the settlement agreement with affiliates of Gramercy Capital Corp. (collectively, “GKK”) given current economic conditions and the concentration of the GKK properties in the financial services sector; the significant debt obligations KBS REIT I has assumed with respect to such properties; the Advisor’s limited experience operating and selling bank branch properties; and other risks identified in Part I, Item IA of KBS REIT I’s Annual Report on Form 10-K filed with the SEC. Actual events may cause the value and returns on KBS REIT I’s investments to be less than that used for purposes of KBS REIT I’s estimated value per share. 2

Overview • Raised $1.7 billion of equity in initial offering. • 2006-2008 Acquisition Strategy – Acquired a diversified “hybrid” portfolio with both equity and debt commercial real estate investments. – Acquired $3.0 billion portfolio of 64 properties and 23 debt and other investments. 3

Overview • Revaluation History (in accordance with FINRA 09-09) – Offering Price $10.00 – November 20091 $7.17 – December 20102 $7.32 – March 20123 $5.16 – December 20124 $5.18 • Distribution History – 7/18/06 – 6/30/09 (36 Payments): $0.70/share on an annualized basis – 7/1/09 – 2/28/12 (32 Payments): $0.525/share on an annualized basis On March 26, 2012, KBS REIT I announced that it would discontinue paying monthly distributions to stockholders in an effort to maximize the total amount of capital returned to stockholders over time. The REIT’s cash flow has been redirected with the goal of accomplishing the following objectives: 1) Paying down repo debt and mortgage debt and managing upcoming maturities; 2) Managing KBS REIT I’s reduced cash flows; 3) Strategically reinvesting capital into existing assets; and 4) Attempting to improve the overall return to stockholders in the future. 4 1Data as of 9/30/09. See KBS REIT I’s Current Report on Form 8-K filed with the SEC on November 23, 2009. 2Data as of 9/30/10. See KBS REIT I’s Current Report on Form 8-K filed with the SEC on December 10, 2010. 3Data as of 12/31/11. See KBS REIT I’s Current Report on Form 8-K filed with the SEC on March 26, 2012. 4Data as of 9/30/12. See KBS REIT I’s Current Report on Form 8-K filed with the SEC on December 19, 2012.
KBS Capital Advisors Sharing the Pain • KBS REIT I is limiting the asset management fees paid to the Advisor related to its GKK investment to the cost basis that was outstanding as of the date of the settlement agreement (September 1, 2011) of $454.4 million (total investment of $465.1 million), rather than the $1.8 billion gross value1 of the GKK properties initially transferred to KBS REIT I as a result of the settlement agreement. • In March 2012, the Advisor forgave the following liabilities owed by KBS REIT I: – A $1.6 million unreimbursed non interest-bearing advance to support initial distributions declared. – A $5.4 million deferred asset management fee. 5 1 The estimated gross value of the remaining GKK properties as of December 18, 2012 was $1.1 billion.
In 2012, KBS REIT I… • Strategically refinanced the GKK repo debt, which presented a significant risk to KBS REIT I, then repaid the replacement mezzanine loan.1 • Balance as of… – August 22, 2008 (acquisition) $297.6 million – March 9, 2011 (initial maturity) $270.9 million – December 31, 2011 $143.0 million – March 28, 2012 (presentation to stockholders) $78 million – September 30, 2012 $39.0 million – December 6, 2012 (paid off following BBD1 sale) $0 6 1Repo was paid off and replaced with a mezzanine loan from a new lender on August 17, 2012, and activity shown subsequent to that date reflects the paydown of that mezzanine loan. Overview of Recent Activity

Overview of Recent Activity In 2012, KBS REIT I… • Sold its interest in the “BBD1 Properties”, a significant portion of the GKK portfolio comprised of 115 properties, for $485.0 million. • Transferred the equity interests in entities that directly or indirectly own 140 properties, and conveyed 5 properties, all within the Goldman portfolio to the lender under the Goldman Mortgage Loan in exchange for a release and sold its remaining interest in the loan to the lender for $12 million. • Disposed of 73 additional GKK properties1 for $107.8 million through 9/30/12. • Disposed of an additional 8 historical REIT I assets2 for $238.5 million through 9/30/12. • Repaid approximately $488 million of mortgage debt and approximately $157 million of additional debt (including the repo/replacement mezz debt) primarily from proceeds of the above sales .3 • Entered contracts to sell “PB Capital”, a portion of the GKK portfolio containing 41 properties, for $250.0 million. • Spent $22.9 million on capital expenditures through 9/30/12. • Maintained occupancy of properties held for investment at 85% for the nine months ended 9/30/12.4 7 1Includes three leasehold interests which have expired or been terminated. 2Does not include real estate loan investment payoffs or Tribeca condo sales. 3As of September 30, 2012, but also including the effective repayment of mortgages from the sale of the“BBD1 Properties” and the subsequent repayment of the replacement mezzanine loan. 4Excludes properties securing the Goldman Mortgage Loan

KBS REIT I Portfolio Overview Estimated Value of Portfolio As of 12/18/121 As of 3/22/122 Assets: $2.989 Billion3 $3.366 Billion3 GKK Properties $1.706 Billion (57%) $1.806 Billion (54%) 788 Assets 862 Assets Historical Real Estate $912.7 Million (31%) $1.133 Million (34%) 22 Assets 31 Assets Historical Real Estate-Related $25.2 Million (1%) $117.6 Million (3%) Investments 4 Assets 11 Assets Other Assets4 $344.5 Million (11%) $309.6 Million (9%) Liabilities: $1.998 Billion $2.382 Billion Loans payable and repo debt: $1.897 Billion $2.258 Billion Other Liabilities5: $100.5 Million $125.0 Million Net Equity at Estimated Value: $990.9 Million $984.2 Million 8 1Based on data as of September 30, 2012. 2 Based on data as of December 31, 2011. 3Includes assets held for sale and non-sale disposition, some of which were sold or transferred prior to the date of the valuation. 4Includes cash and cash equivalents, restricted cash, defeasance securities, rents and other receivables, deposits and prepaid expenses. 5Includes accounts payable, accrued liabilities, security deposits, contingent liabilities and prepaid rent.

GKK Overview Timeline of Key GKK Events • March 2011: KBS REIT I, the borrower, and senior lenders went into negotiations after GKK announced it was unable to repay the outstanding principal balance of the GKK mezzanine loan to KBS REIT I at maturity in March of 2011. • May 2011: After temporary extensions, GKK defaulted on its payment obligations due to KBS REIT I. • September 2011: After executing a settlement agreement, the borrower transferred 317 GKK properties and their related mortgage loans to KBS REIT I. • December 2011: The borrower transferred the remaining 550 GKK properties and their related mortgage loans to KBS REIT I, bringing total properties transferred to KBS REIT I to 867. • December 2011: KBS REIT I began selling individual properties from the GKK portfolio. • November 2012: KBS REIT I entered contracts to sell its 41-property PB Capital portfolio for $250.0 million. • December 2012: KBS REIT I transferred the equity interests in entities that directly or indirectly own 140 properties, and conveyed 5 properties, all within the Goldman portfolio to the lender under the Goldman Mortgage Loan in exchange for a release and sold its remaining interest in the loan to the lender for $12 million. • December 2012: KBS REIT I sold its 115-property “BBD1” portfolio for $485 million. BBD1 represented 16% of KBS REIT I’s estimated gross value and 50% of the estimated net value of the GKK portfolio as of September 30, 2012. As of December 31, 2012, KBS REIT I had sold or transferred 344 properties1 from the GKK portfolio and 523 assets remained in the GKK portfolio. 9 1Includes eight leasehold interests which have expired or been terminated.

(1) (1) The estimated value per share reflects an estimated net asset value with no portfolio (“enterprise value”) premium or discount assumed. On December 18, 2012, the Board approved an estimated value per share of $5.18. The increase in the estimated value per share from the March 2012 valuation of $5.16 is broken down as: Revaluation Information 10 (1) The changes are not equal to the change in values of each asset and liability group presented above due to asset sales, loan paydowns, refinancings and other factors, which caused the value of certain asset or liability groups to change with no impact to KBS REIT I’s fair value of equity or the overall estimated value per share. (2) Includes two historical real estate properties and 337 GKK properties that are currently under contract to sell or were sold (including properties disposed of other than by sale) subsequent to September 30, 2012. The estimated values for the properties sold or under contract to sell were based on contractual sales price less actual or estimated closing costs. The estimated values for properties disposed of other than by sale were based on the face value of the notes payable plus any consideration received from the lender. See notes (4) and (5) below for more information related to properties disposed of other than by sale. (3) Amount includes operating cash flows from the BBD1 properties (consisting of 115 properties), which were sold on December 6, 2012. The BBD1 properties generated $18.3 million of operating cash flows during the nine months ended September 30, 2012. (4) The majority of the change related to the Goldman Mortgage Loan (defined below). Previously, the Goldman Mortgage Loan was valued based on a discounted cash flow analysis and the value represented the estimated price that a third-party market participant would have paid for the note based on the expected cash flows and an estimated market discount rate. At September 30, 2012, KBS REIT I determined the estimated value of the Goldman Mortgage Loan was equal to face value because the loan had matured and KBS REIT I believed that the face value of the loan (excluding KBS REIT I’s 14.7% subordinated interest) fell within a reasonable range of the value of the underlying real estate properties. The change in the value of the notes payable is also due to the notes being one year closer to maturity (based on the fair value methodology, the value of the notes payable accrete towards their face value as they get closer to maturity) and due to changes in market interest rates assumed in valuing the notes payable as compared to prior year. (5) Amount relates to the loss incurred upon the transfer of properties in lieu of foreclosure. During the nine months ended September 30, 2012, KBS REIT I entered into an agreement in lieu of foreclosure and transferred title of a property securing a mortgage loan with an outstanding principal balance of $43.5 million (the “One Citizens Loan”) to the lender in full satisfaction of the debt outstanding, and other obligations related to, the One Citizens Loan. This transfer had a minimal impact on the estimated value per share as the equity value was previously valued at zero. In addition, subsequent to September 30, 2012, KBS REIT I, through various indirect wholly owned subsidiaries, entered into various agreements to: (i) transfer the properties securing a mortgage loan with an outstanding principal balance of $181.6 million (the “Goldman Mortgage Loan”) to the lender in exchange for the release of any of KBS REIT I’s subsidiaries from the debt outstanding under and other obligations related to, the Goldman Mortgage Loan; and (ii) sell KBS REIT I’s 14.7% interest in the Goldman Mortgage Loan to the lender for cash consideration of $12.0 million. The transaction resulted in a decrease in the estimated value of approximately $9.5 million. (6) The change in value in “other changes, net” consists of several immaterial, unrelated items, none of which result individually in an impact greater than $0.03 per share. For more information, see Current Report on Form 8-K filed with the SEC on December 19, 2012. (2) (3) (4) (5) (6)

• With regard to the valuation of a majority of its historical real estate properties and certain GKK properties, KBS REIT I engaged Duff & Phelps, a third- party real estate valuation firm, to review the assumptions and methodologies applied by the Advisor in accordance with a set of limited procedures. • Duff & Phelps reviewed the Advisor’s real estate valuations and concluded, based on a set of limited procedures, that the following were reasonable: – the methodologies and significant assumptions applied by the Advisor, including • capitalization rates, • discount rates and • estimated cash flows – the value of KBS REIT I’s real estate on a property by property basis and portfolio basis • In addition, Duff & Phelps performed valuations for a majority of the GKK properties not under contract to sell. Revaluation Information 11 Third Party Verification
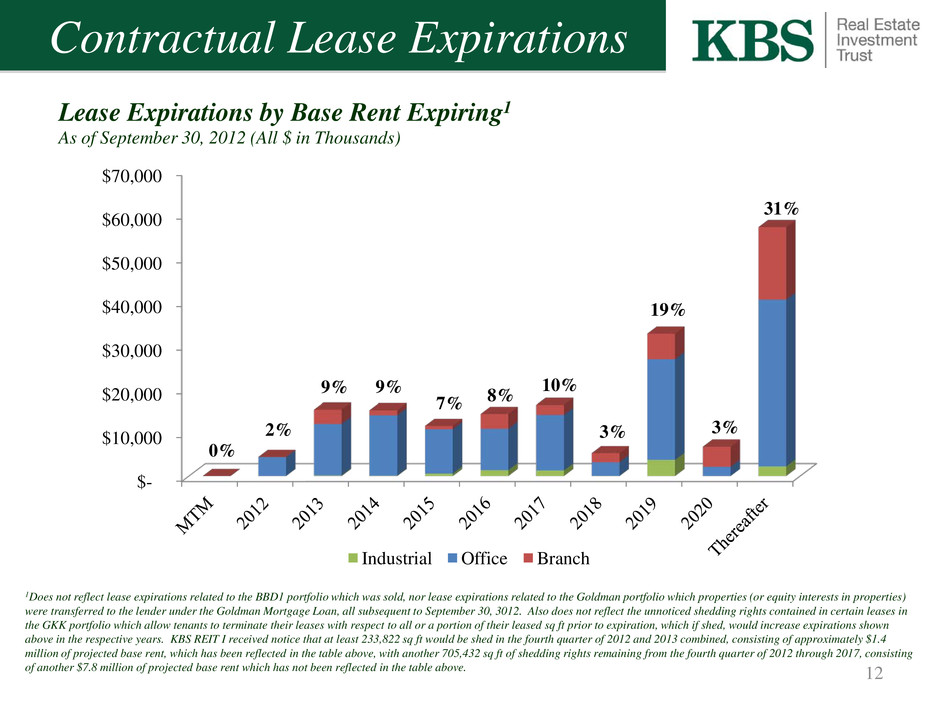
12 $- $10,000 $20,000 $30,000 $40,000 $50,000 $60,000 $70,000 0% 2% 9% 9% 7% 8% 10% 3% 19% 3% 31% Lease Expirations by Base Rent Expiring1 As of September 30, 2012 (All $ in Thousands) Industrial Office Branch Contractual Lease Expirations 1Does not reflect lease expirations related to the BBD1 portfolio which was sold, nor lease expirations related to the Goldman portfolio which properties (or equity interests in properties) were transferred to the lender under the Goldman Mortgage Loan, all subsequent to September 30, 3012. Also does not reflect the unnoticed shedding rights contained in certain leases in the GKK portfolio which allow tenants to terminate their leases with respect to all or a portion of their leased sq ft prior to expiration, which if shed, would increase expirations shown above in the respective years. KBS REIT I received notice that at least 233,822 sq ft would be shed in the fourth quarter of 2012 and 2013 combined, consisting of approximately $1.4 million of projected base rent, which has been reflected in the table above, with another 705,432 sq ft of shedding rights remaining from the fourth quarter of 2012 through 2017, consisting of another $7.8 million of projected base rent which has not been reflected in the table above.
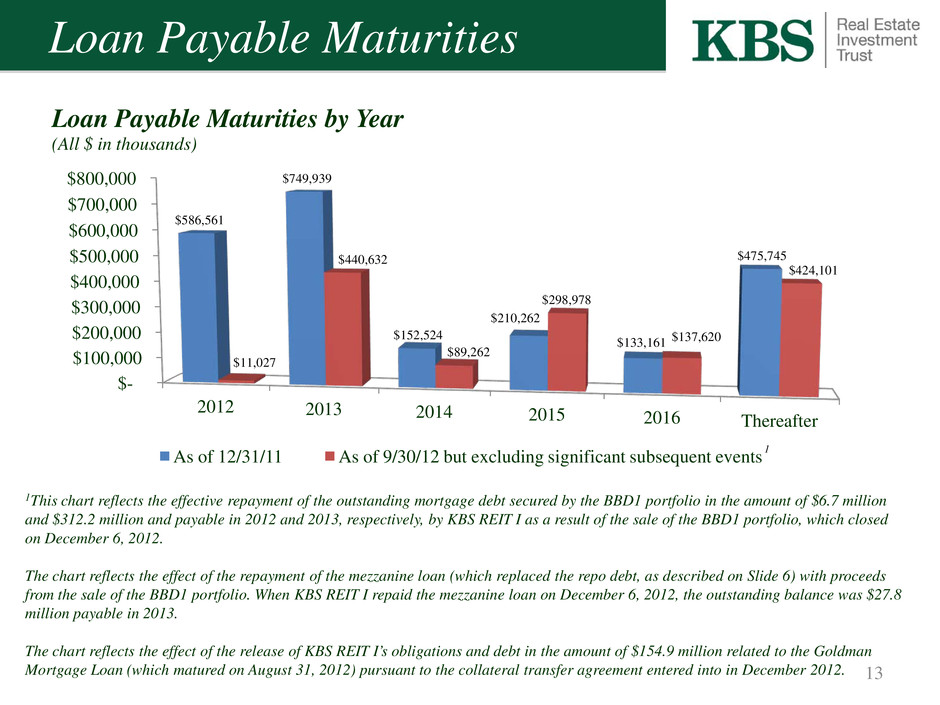
13 Loan Payable Maturities $- $100,000 $200,000 $300,000 $400,000 $500,000 $600,000 $700,000 $800,000 2012 2013 2014 2015 2016 Thereafter $586,561 $749,939 $152,524 $210,262 $133,161 $475,745 $11,027 $440,632 $89,262 $298,978 $137,620 $424,101 Loan Payable Maturities by Year (All $ in thousands) As of 12/31/11 As of 9/30/12 but excluding significant subsequent events 1This chart reflects the effective repayment of the outstanding mortgage debt secured by the BBD1 portfolio in the amount of $6.7 million and $312.2 million and payable in 2012 and 2013, respectively, by KBS REIT I as a result of the sale of the BBD1 portfolio, which closed on December 6, 2012. The chart reflects the effect of the repayment of the mezzanine loan (which replaced the repo debt, as described on Slide 6) with proceeds from the sale of the BBD1 portfolio. When KBS REIT I repaid the mezzanine loan on December 6, 2012, the outstanding balance was $27.8 million payable in 2013. The chart reflects the effect of the release of KBS REIT I’s obligations and debt in the amount of $154.9 million related to the Goldman Mortgage Loan (which matured on August 31, 2012) pursuant to the collateral transfer agreement entered into in December 2012. 1

Examples of Challenges and Risks • Lower net operating income and cash flow from operations • Maintaining and/or increasing the value of the assets in the portfolio • Upcoming debt amortization and maturities, including those related to the GKK portfolio • Successful continued operations and sales of the GKK properties given current economic conditions • Management of leasing activity throughout the entire portfolio in a challenging leasing environment • Ability of tenants and borrowers to make future payments to the REIT • Susceptibility to disruptions in the banking industry due to a significant portion of KBS REIT I’s properties being leased to financial institutions 14
2013 Focus & Objectives Primary Objective: Attempt to maximize amount of capital returned to stockholders over time. Strategic options currently being analyzed or considered include: 1) Strategic asset sales to manage debt maturities and cash flow needs; a) Paying down debt and refinancing debt obligations to improve KBS REIT I’s financial position and stability; b) Exploring value-add opportunities for existing assets; and 2) Exploring and developing accretive opportunities for KBS REIT I. 15

Stockholder Performance 16 $5.18 $3.47 $8.65 Hypothetical Performance of Early and Late Investors Assumes all distributions have been taken in cash and stockholder has held shares since the dates below Estimated Value Per Share As of December 18, 20121 Cumulative Cash Distributions Received Sum of Estimated Value Per Share as of December 18, 2012 and Cumulative Cash Distributions Received Late Investor: Invested at Close of Public Offering (May 31, 2008) Early Investor: Invested at Escrow Break (July 5, 2006) $5.18 $2.16 $7.34 1KBS REIT I is providing this estimated value per share to assist broker dealers that participated in its initial public offering in meeting their customer account statement reporting obligations. As with any valuation methodology, the Advisor’s methodology is based upon a number of estimates and assumptions that may not be accurate or complete. Different parties with different assumptions and estimates could derive a different estimated value per share. KBS REIT I can give no assurance that: • a stockholder would be able to resell his or her shares at this estimated value; • a stockholder would ultimately realize distributions per share equal to KBS REIT I’s estimated value per share upon liquidation of KBS REIT I’s assets and settlement of its liabilities or a sale of KBS REIT I; • KBS REIT I’s shares of common stock would trade at the estimated value per share on a national securities exchange; • an independent third-party appraiser or other third-party valuation firm would agree with KBS REIT I’s estimated value per share; or • the methodology used to estimate KBS REIT I’s value per share would be acceptable to FINRA or for compliance with ERISA reporting requirements. Further, the estimated value per share as of December 18, 2012 is based on the estimated value of KBS REIT I’s assets less the estimated value of KBS REIT I’s liabilities divided by the number of shares outstanding, all as of September 30, 2012. The value of KBS REIT I’s shares will fluctuate over time in response to developments related to individual assets in the portfolio and the management of those assets and in response to the real estate and finance markets. KBS REIT I currently expects to engage the Advisor and/or an independent valuation firm to update the estimated value per share in December 2013 but is not required to update the estimated value per share more frequently than every 18 months.

Thank You! Q&A 17
