Attached files
| file | filename |
|---|---|
| 8-K - FORM 8-K - KBS Real Estate Investment Trust II, Inc. | kbsrii8k.htm |

KBS REIT II Valuation & Portfolio Update January 8, 2013
Forward-Looking Statements The information contained herein should be read in conjunction with, and is qualified by, the information in KBS Real Estate Investment Trust II’s (“KBS REIT II”) Annual Report on Form 10-K for the year ended December 31, 2011, filed with the Securities and Commission Exchange (the “SEC”) on March 13, 2012 (the “Annual Report”), and in KBS REIT II’s Quarterly Report on Form 10-Q for the quarter ended September 30, 2012 (the “Quarterly Report”), filed with the SEC on November 8, 2012, including the “Risk Factors” contained in each such filing. For a full description of the limitations, methodologies and assumptions used to value KBS REIT II’s assets and liabilities in connection with the calculation of KBS REIT II’s estimated value per share, see KBS REIT II’s Current Report on Form 8-K, filed with the SEC on December 19, 2012. Forward-Looking Statements Certain statements contained herein may be deemed to be forward-looking statements under federal securities laws. The foregoing includes forward-looking statements. These statements include statements regarding the intent, belief or current expectations of KBS REIT II and members of its management team, as well as the assumptions on which such statements are based, and generally are identified by the use of words such as “may,” “will,” “seeks,” “anticipates,” “believes,” “estimates,” “expects,” “plans,” “intends,” “should” or similar expressions. The valuation methodology for KBS REIT II’s real estate investments assumes the properties realize the projected cash flows and expected exit cap rates and that investors would be willing to invest in such properties at yields equal to the expected discount rates. Though these are KBS REIT II’s and KBS Capital Advisors LLC’s (the “Advisor”) best estimates as of December 18, 2012, KBS REIT II can give no assurance in this regard. These statements also depend on factors such as: KBS REIT II’s ability to maintain occupancy levels and lease rates at its properties; the borrowers under KBS REIT II’s loan investments continuing to make required payments under the investments; the ability of certain borrowers to maintain occupancy levels and lease rates at the properties securing KBS REIT II’s real estate-related investments; and other risks identified in Part I, Item IA of KBS REIT II’s Annual Report on Form 10-K and in Part II, Item IA of KBS REIT II’s Quarterly Report, each as filed with the SEC. Actual events may cause the value and returns on KBS REIT II’s investments to be less than that used for purposes of KBS REIT II’s estimated value per share. 2
KBS REIT II Portfolio Overview Estimated Value of Current Portfolio As of 12/18/12 Assets: $3.362 Billion – Real Estate • 24 Assets • $2.910 Billion (86%) – Loan Investments • 7 Assets • $392.3 Million (12%) – Other Assets2 • $59.3 Million (2%) Liabilities: $1.408 Billion – Loans Payable: $1.3 Billion – Other Liabilities3: $66 Million Net Equity at Estimated Value: $1.954 Billion Occupancy: 94%4 3 1Includes assets acquired after initial offering period. 2Includes cash and cash equivalents, restricted cash, rents and other receivables and prepaid expenses. 3Includes accounts payable, accrued liabilities, distributions payable, security deposits, prepaid rent and interest rate swap liability. 4As of September 30, 2012 for real estate portfolio. • Raised $1.8 billion of equity in initial offering. • Acquired or originated $3.1 billion portfolio of 25 properties and 8 loan investments.1

Overview • Revaluation History (in accordance with FINRA 09-09) – Offering Price $10.00 – December 20111 $10.11 – December 20122 $10.29 • History of Distribution Payments – August 2008 – December 2012 – 54 Monthly Payments – $0.65/share on an annualized basis – Distributions declared represented 94% of operating cash flow for the nine months ending 9/30/12 • On the purchase date of January 2, 2013, participants in the dividend reinvestment plan began to acquire shares at $9.78 per share. 4 1Data as of 9/30/11. See KBS REIT II’s Current Report on Form 8-K filed with the SEC on December 21, 2011. 2Data as of 9/30/12. See KBS REIT II’s Current Report on Form 8-K filed with the SEC on December 19, 2012.
Overview of Recent Activity In the first three quarters of 2012, KBS REIT II… • Originated a first mortgage loan secured by Summit I & II, two office buildings in Reston, Virginia in an amount up to $58.8 million.1 • Sold the Northern Trust first mortgage for $85.8 million, which resulted in a net economic gain on sale2 of $24.8 million and net proceeds of $84.9 million. • Sold the Hartman II property for $12.7 million, which resulted in a gain of $2.5 million and net proceeds of $6.0 million after repayment of debt. • Experienced an increase in operating cash flow, from $87.4 million for the nine months ended 9/30/11 to $98.6 million for the nine months ended 9/30/12, primarily as a result of acquisitions in 2011 and 2012. • Declared distributions of $92.8 million. • Spent $17.1 million on capital expenditures. 5 1 As of September 30, 2012, $52.3 million had been disbursed and another $6.5 million remained available for future fundings, subject to certain conditions set forth in the loan agreement. 2 The economic gain on sale shown is equivalent to the net sales price (after closing costs) less the total purchase price of the Northern Trust first mortgage for $60.1 million.
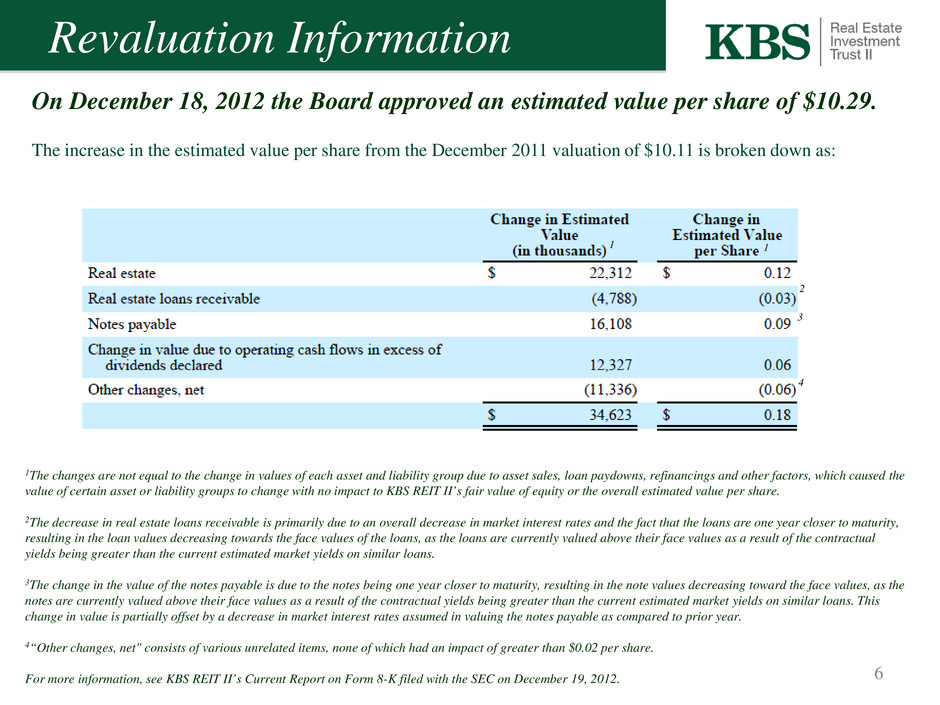
On December 18, 2012 the Board approved an estimated value per share of $10.29. The increase in the estimated value per share from the December 2011 valuation of $10.11 is broken down as: Revaluation Information 6 1The changes are not equal to the change in values of each asset and liability group due to asset sales, loan paydowns, refinancings and other factors, which caused the value of certain asset or liability groups to change with no impact to KBS REIT II’s fair value of equity or the overall estimated value per share. 2The decrease in real estate loans receivable is primarily due to an overall decrease in market interest rates and the fact that the loans are one year closer to maturity, resulting in the loan values decreasing towards the face values of the loans, as the loans are currently valued above their face values as a result of the contractual yields being greater than the current estimated market yields on similar loans. 3The change in the value of the notes payable is due to the notes being one year closer to maturity, resulting in the note values decreasing toward the face values, as the notes are currently valued above their face values as a result of the contractual yields being greater than the current estimated market yields on similar loans. This change in value is partially offset by a decrease in market interest rates assumed in valuing the notes payable as compared to prior year. 4“Other changes, net" consists of various unrelated items, none of which had an impact of greater than $0.02 per share. For more information, see KBS REIT II’s Current Report on Form 8-K filed with the SEC on December 19, 2012. 2 3 4 1 1
• The estimated value per share reflects an estimated net asset value with no portfolio (“enterprise value”) premium or discount assumed. • With regard to the valuation of its real estate properties, KBS REIT II engaged Duff & Phelps, a third-party real estate valuation firm, to review the assumptions and methodologies applied by the Advisor in accordance with a set of limited procedures. • Duff & Phelps reviewed the Advisor’s real estate valuations and concluded, based on a set of limited procedures, that the following were reasonable: – the methodologies and significant assumptions applied by the Advisor, including • capitalization rates, • discount rates and • estimated cash flows – the value of KBS REIT II’s real estate on a property by property basis and portfolio basis. Revaluation Information 7 On December 18, 2012 the Board approved an estimated value per share of $10.29.
Northern Trust Sale 8 • Acquired A-Note in 2008 for $58.1 million1 • $18.7 million cumulative interest income • Sold 6/27/12 for $85.8 million • Sale was 5 years prior to maturity • Net economic gain on sale2 of $24.8 MM (41% of total investment) • Net proceeds were used to: – provide additional funds for the share redemption program. – pay down certain debt in the portfolio. 1KBS REIT II subsequently acquired the B-note for $2.0 million in 2012. 2The economic gain on sale shown is equivalent to the net sales price (after closing costs) less the total purchase price of the Northern Trust Notes for $60.1 million. The book or GAAP gain was $14.9 million due to the amortization of the purchase discount since acquisition.
Two Westlake Plaza Update 9 • Class A Office in Houston, TX • Acquired in February 2011 • Private health club in parking garage gave notice to vacate February 2012. • No significant lease revenue lost, but primary resulting challenge would be costly maintenance of vacant space. • KBS asset management began conversations with prospective tenants about redevelopment. • BP, a tenant in Two Westlake, signed a 5-year lease, allowing KBS to convert a portion of the parking garage to 67,334 SF of fully usable office space. – Currently planning August 2013 move-in – Lease to commence upon completion at $14.50 NNN Rendering of new space Photo of Asset in Current State

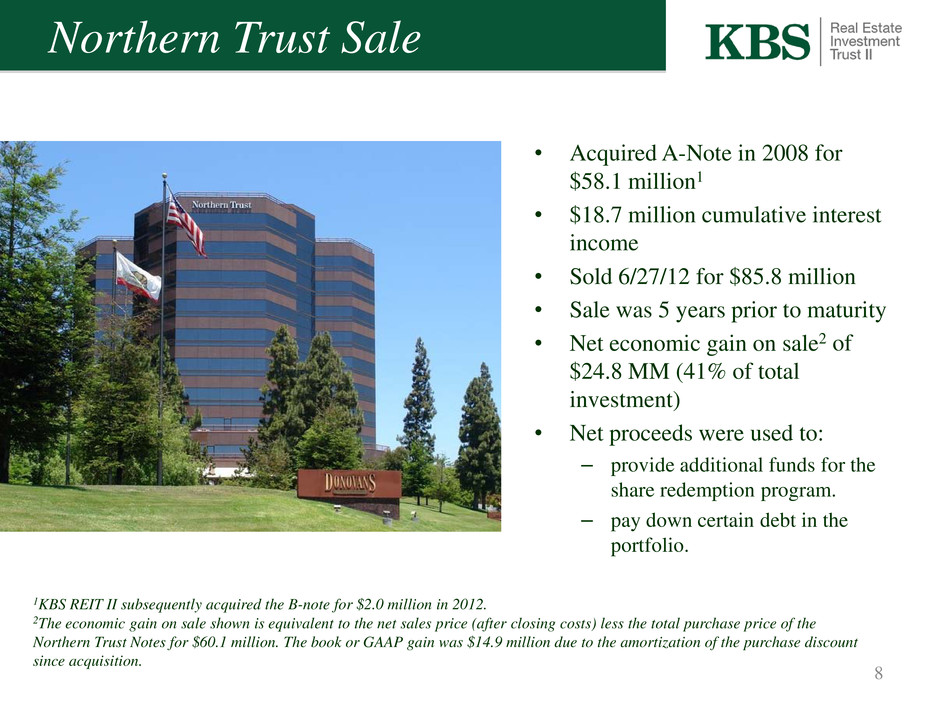
Contractual Lease Expirations 10 0% 5% 10% 15% 20% 25% 30% 35% Lease Expirations by Square Footage As of September 30, 2012 Office Industrial
11 Loans Payable Maturities $0 $100,000 $200,000 $300,000 $400,000 $500,000 $600,000 $700,000 $800,000 Oct - Dec. 2012 2013 2014 2015 2016 Thereafter $0 $58,000 $203,850 $622,320 $450,344 $0 Loans Payable Maturities by Year As of September 30, 2012 ($ in thousands)

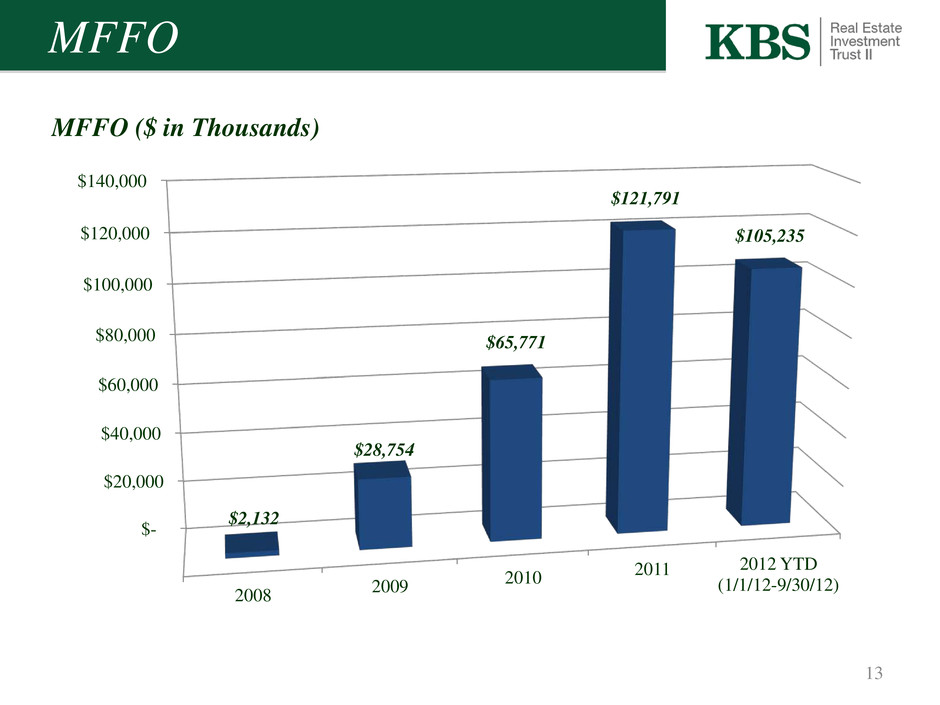
MFFO 12 MFFO Reconciliation ($ in Thousands) KBS REIT II computes FFO in accordance with the current NAREIT definition. REIT II computes MFFO in accordance with the definition of MFFO included in the practice guideline issued by the Investment Program Association (“IPA”) in November 2010. KBS REIT II’s management uses MFFO as an indicator of its ongoing performance as well as its dividend sustainability. FFO and MFFO are non-GAAP financial measures and do not represent net income as defined by GAAP. Net income as defined by GAAP is the most relevant measure in determining KBS REIT II’s operating performance because FFO and MFFO include adjustments that investors may deem subjective, such as adding back expenses such as depreciation and amortization and the other items described in the table above. Accordingly, FFO and MFFO should not be considered as alternatives to net income as an indicator of our current and historical operating performance. In addition, FFO and MFFO do not represent cash flows from operating activities determined in accordance with GAAP and should not be considered an indication of our liquidity. Management believes FFO and MFFO, in addition to net income and cash flows from operating activities as defined by GAAP, are meaningful supplemental performance measures and are useful in understanding how KBS REIT II’s management evaluates its ongoing operating performance. The information regarding KBS REIT II’s use of FFO and MFFO should be read in conjunction with, and is qualified by, the information in the Annual Report and Quarterly Report. No conclusions or comparisons should be made from the presentation of the periods above. For the Year Ended 2012 YTD 2008 2009 2010 2011 (1/1/12 - 9/30/12) Net Income (loss) $ (2,582) $ 12,419 $ 5,508 $ 21,793 $ 44,597 Add: Depreciation of real estate assets $ 2,314 $ 9,919 $ 20,924 $ 45,684 $ 40,115 Amortization of lease-related costs 4,659 18,186 40,762 72,755 54,507 Deduct: Gain on Sale of Securities - (120) - - - Gain on Sale of Note - - - - (14,884) Gain on Sale of Real Estate, Net - - - - (2,470) FFO $ 4,392 $ 40,405 $ 67,194 $ 140,232 $ 121,866 Adjustments to Calculate Modified Funds from Operations (MFFO): Real estate acquisition fees and expenses 9 1,524 18,179 8,782 - Straight-line rent and amortization of above/below market leases (2,263) (7,871) (12,975) (20,772) (11,631) Amortization of discounts and closing costs (6) (5,304) (6,354) (6,914) (4,913) Adjustments related to valuation of contingent purchase consideration - - (273) 463 (87) MFFO $ 2,132 $ 28,754 $ 65,771 $ 121,791 $ 105,235

MFFO 13 $- $20,000 $40,000 $60,000 $80,000 $100,000 $120,000 $140,000 2008 2009 2010 2011 2012 YTD (1/1/12-9/30/12) $2,132 $28,754 $65,771 $121,791 $105,235 MFFO ($ in Thousands)
2013 Focus & Objectives • Manage debt maturities and interest expense exposure to reduce the cost of real estate financing. • Operate quality assets at high occupancy levels that also provide for the possibility of increased value through leases executed at rates above those for the competitive market set. • Continue with property improvements, including those at Two Westlake Plaza in Houston. 14
Thank You! Q&A 15

