Attached files
| file | filename |
|---|---|
| EX-99.1 - PRESS RELEASE ISSUED JANUARY 7, 2013 - Wright Medical Group N.V. | d462429dex991.htm |
| 8-K - FORM 8-K - Wright Medical Group N.V. | d462429d8k.htm |
 January 7, 2012
David Mowry,
Interim President and CEO
Specialists SERVING
Specialists
Exhibit 99.2
[ 1 ] |
 Forward-Looking Statements
[ 2 ]
Statements contained in this presentation that relate to future, not past, events are
forward-looking statements under the Private Securities Litigation Reform Act of 1995.
Forward-looking
statements are based on current expectations of future events and often can be identified by
words such as “expect,” “anticipate,” “project,” “intend,”
“will,” “may,” “believe,” “should,” “could,”
“continue,” “estimate,” “outlook,” “plan,” “guidance,” other words of similar meaning
or the use of future dates. Forward-looking statements by their nature address matters that are,
to different degrees, uncertain. Uncertainties and risks may cause Tornier’s actual
results to be materially different than those expressed in or implied by Tornier’s
forward-looking statements. For Tornier, such uncertainties and risks include, among
others, Tornier’s future operating results and financial performance, fluctuations in
foreign currency exchange rates, the effect of global economic conditions, the timing of
regulatory approvals and introduction of new products, physician acceptance, endorsement, and
use of new products; the effect of regulatory actions, changes in and adoption of reimbursement
rates, potential product recalls, competitor activities and the costs and effects of litigation
and changes in tax and other legislation. More detailed information on these and other factors
that could affect Tornier’s actual results are described in Tornier’s filings with
the U.S. Securities and Exchange Commission, including its most recent quarterly report
on Form 10-Q. Tornier undertakes no obligation to update its forward-looking
statements.
|
 Non-GAAP Financial Measures
[ 3 ]
Tornier uses certain non-GAAP financial measures in this presentation, such as
constant
currency. Tornier uses non-GAAP financial measures as supplemental measures
of
performance and believes these measures provide useful information to investors in
evaluating Tornier’s operations, period over period. However,
non-GAAP financial measures have
limitations as analytical tools, and should not be considered in isolation or as a substitute
for Tornier’s financial results prepared in
accordance with GAAP. In addition, investors should
note that any non-GAAP financial measure Tornier uses may not be the same
non-GAAP financial
measure, and may not be calculated in the same manner, as that of other companies.
A reconciliation of the non-GAAP financial measures used in the presentation to the
most directly comparable GAAP
financial measures can be found on Tornier’s website
www.tornier.com under the “Non-GAAP Measure Reconciliation Tables” section of
the
“Investor Relations” page.
|
 Specialists SERVING
Specialists
Global Medical Device Company,
Focusing on Surgeons Treating
Extremities Injuries and Disorders
EXTREMITIES
[ 4 ] |
 The
Tornier Story: Positioning for Future Growth BROADEST
PRODUCT PORTFOLIO
Upper
Extremities
Lower
Extremities
Biologics/
Sports
Medicine
Leader in Innovation,
Science & Education
HIGH
GROWTH MARKET
Robust Drivers
Assure Growth
$6.5B
7-9%
CAGR
(’12 –
’17)
SCALE FOR
EFFICIENT SALES
Target High-Volume
Extremities Specialists
Upper
Extremities
Lower
Extremities
[ 5 ]
Extremities
EXECUTION FOCUS FOR 2013 |
 Attractive Market for Extremities
BROADEST
PRODUCT PORTFOLIO
Upper
Extremities
Lower
Extremities
Biologics/
Sports
Medicine
Leader in Innovation,
Science Education
SCALE FOR
EFFICIENT SALES
Target High-Volume
Extremities Specialists
EXECUTION FOCUS FOR 2013
HIGH
GROWTH MARKET
Robust Drivers
Assure Growth
Extremities
$6.5B
7-9%
CAGR
(’12 –
’17)
Upper
Extremities
Lower
Extremities
[ 6 ] |
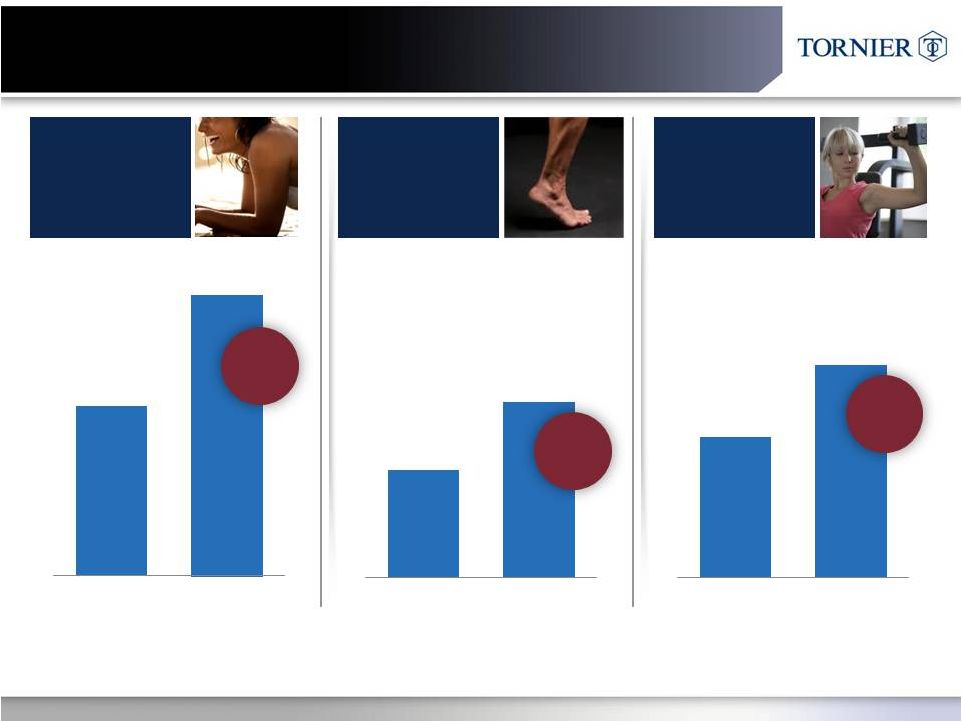 Large
and Growing Global Extremities Market $2.7B
~ $4.0B
8-9%
CAGR
UPPER
EXTREMITES
$2.1B
~ $3.0B
7-8%
CAGR
SPORTS
MEDICINE &
BIOLOGICS
$1.7B
~ $2.5B
7-8%
CAGR
LOWER
EXTREMITIES
Total
Extremities
Market
Is
$6.5B
with
7-9%
CAGR
[ 7 ]
2012
2017
2012
2017
2012
2017 |
 Robust
Extremities Market Drivers Provide Opportunity for Future Growth and
Differentiation Active, Younger
Patient Population
Expanding Knowledge
of Treatment Options
Early Stages of
Device Innovation
Opportunity for
Material and Design
Improvements
TECHNOLOGY
PATIENTS
OUTCOMES
Upside for Continued
Clinical Improvements
Economic Environment
Driving Clinical Data
Requirements
[ 8 ] |
 2012
Actions Focused on Capturing Opportunities ACTIONS
ACTIONS
OPPORTUNITY
OPPORTUNITY
Specific Press-fit Shoulder
Broaden Lower Extremities
Offering
US SALES CHANNEL
EXECUTION
OVERHEAD / EXPENSE
REDUCTION
1
2
3
Access to Foot & Ankle
Sales Channel
New Sales Management
Organization
Developed 2013 Playbook
for Upper & Lower Focus
COGS Reduction / Insourcing
Facilities Consolidation
Introduced 14 New Products
including the Ascend Flex
Acquired Foot & Ankle Bone
Fixation Portfolio
OrthoHelix
Acquisition
* Nine months ended September 30, 2012 constant currency growth of 8.9% over nine
months ended October 2, 2011 [ 9 ]
BROADEN PORTFOLIO
9%* Y-O-Y Extremities Revenue Growth |
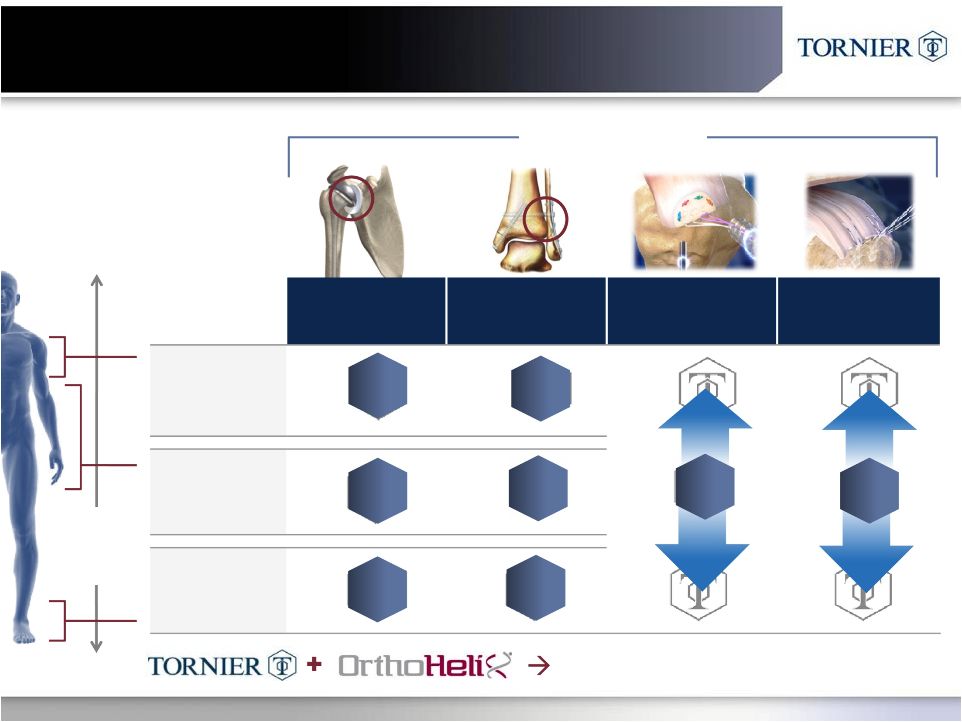
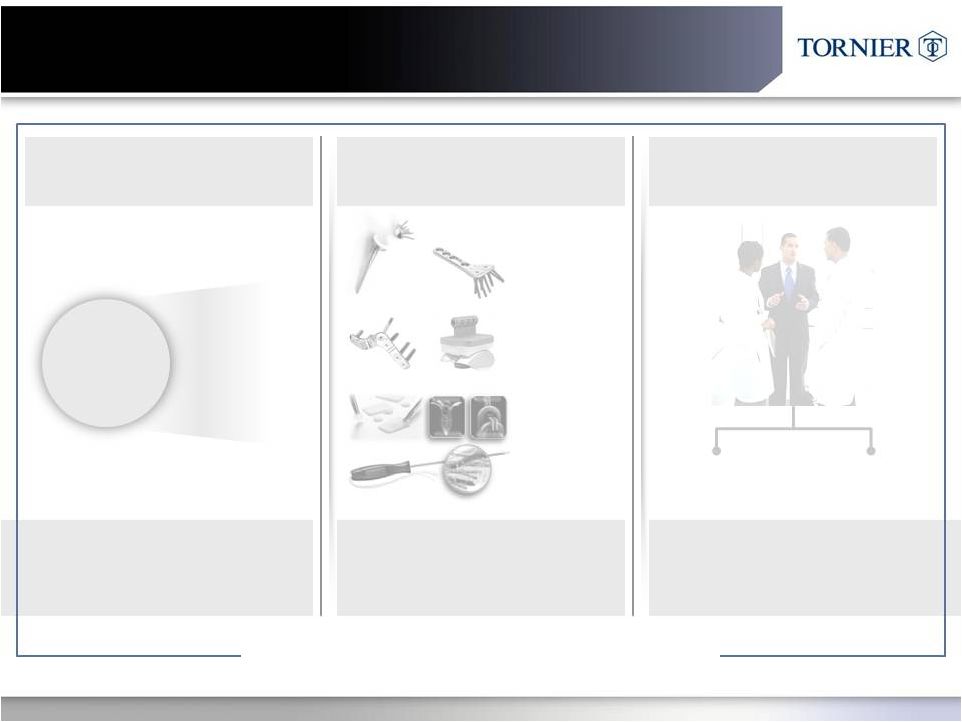
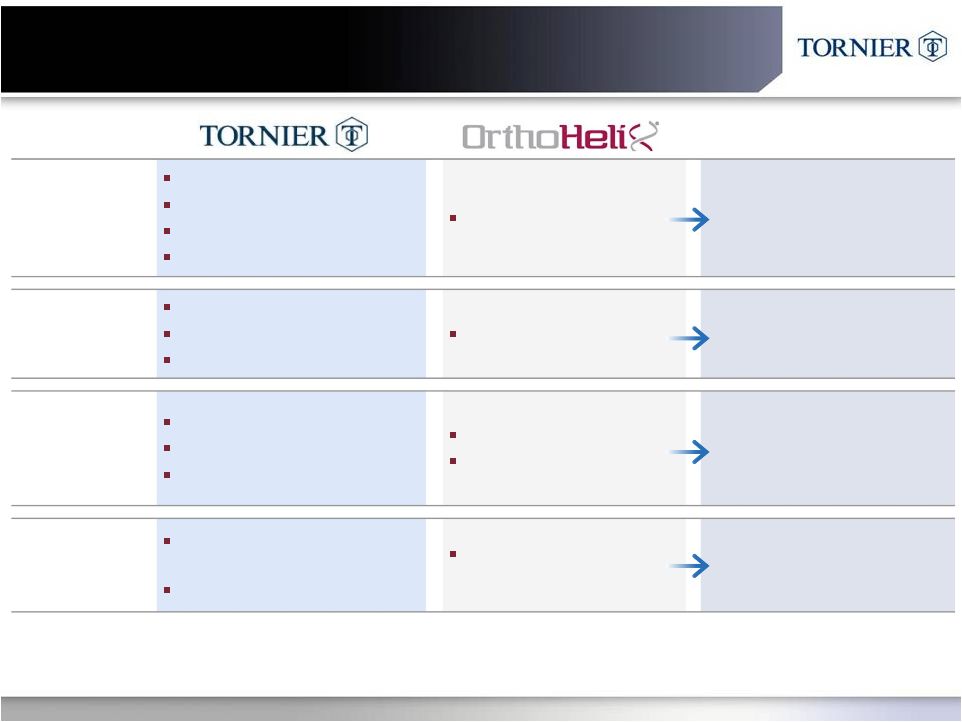 OrthoHelix Acquisition:
Complementary Capabilities
PRODUCTS
Broad Shoulder Portfolio
Elbow Arthroplasty
Strong Ankle Arthroplasty
Sports Medicine & Biologics
Foot & Ankle Fixation
Comprehensive Upper &
Lower Extremities Portfolio
with Minimal Overlap
GEOGRAPHY
US
Europe
Emerging Markets
US Only Channel
US Cross Selling &
Geographic Expansion
US SALES
CHANNEL
18 Distributors
3 Direct Territories
Upper Extremities Focus
50+ Metro Distributors
Sole Focus on Lower
Scale and Flexibility
Focused Upper & Lower
Extremity Sales Forces
R&D
EXPERTISE
Arthroplasty / Replacement
(Motion)
Materials / Biologics
Plate Design / Repair
(Fixation)
Broad R&D Talent to Be
Leveraged into Each
Market Segment
THE PAYOFF
[ 10 ]
and
Accelerated Financial Performance
Global Extremities Leadership |
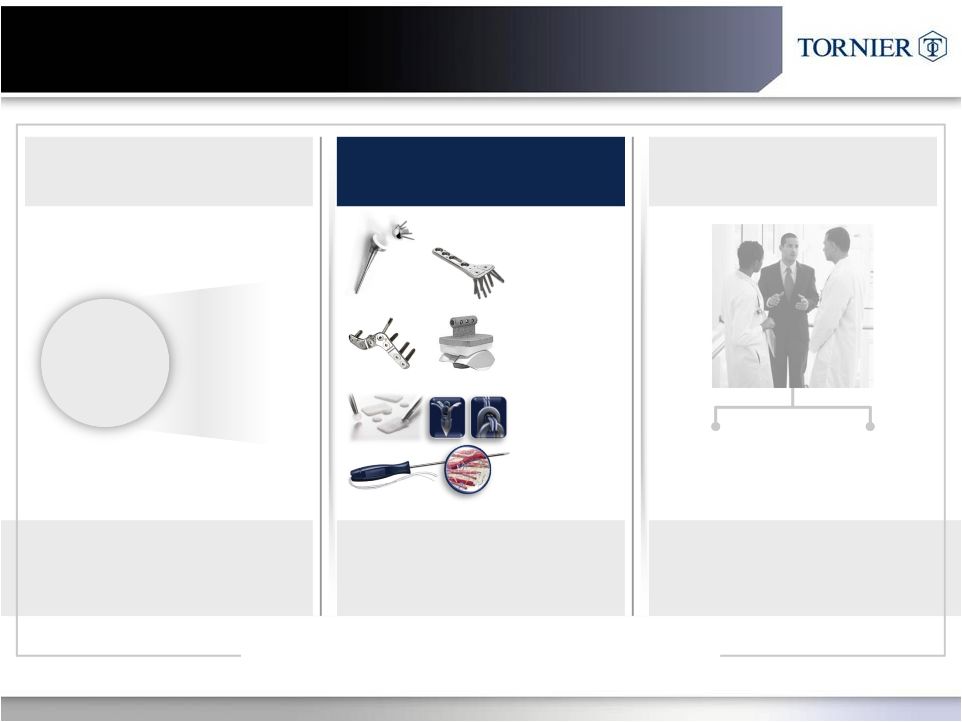 Filling Out Our Extremities Product Portfolio
SCALE FOR
EFFICIENT SALES
Target High-Volume
Extremities Specialists
HIGH
GROWTH MARKET
Robust Drivers
Assure Growth
Extremities
$6.5B
EXECUTION FOCUS FOR 2013
BROADEST
BROADEST
PRODUCT PORTFOLIO
PRODUCT PORTFOLIO
Upper
Extremities
Lower
Extremities
Biologics/
Sports
Medicine
Leader in Innovation,
Science & Education
Upper
Extremities
Lower
Extremities
7-9%
CAGR
(2012 –
2017)
[ 11 ] |
 Portfolio Strategy Leverages
Strong Arthroplasty Position
$1.2B
$6.5B
CALL
POINT
FOCUS
[ 12 ]
#2
Top
5
#1
JOINT
JOINT
REPLACEMENTS
REPLACEMENTS
BONE REPAIR
BONE REPAIR
BIOLOGICS
BIOLOGICS
SPORTS
SPORTS
MEDICINE
MEDICINE
SHOULDER
HAND,
WRIST AND
ELBOW
FOOT AND
ANKLE
PROCEDURES
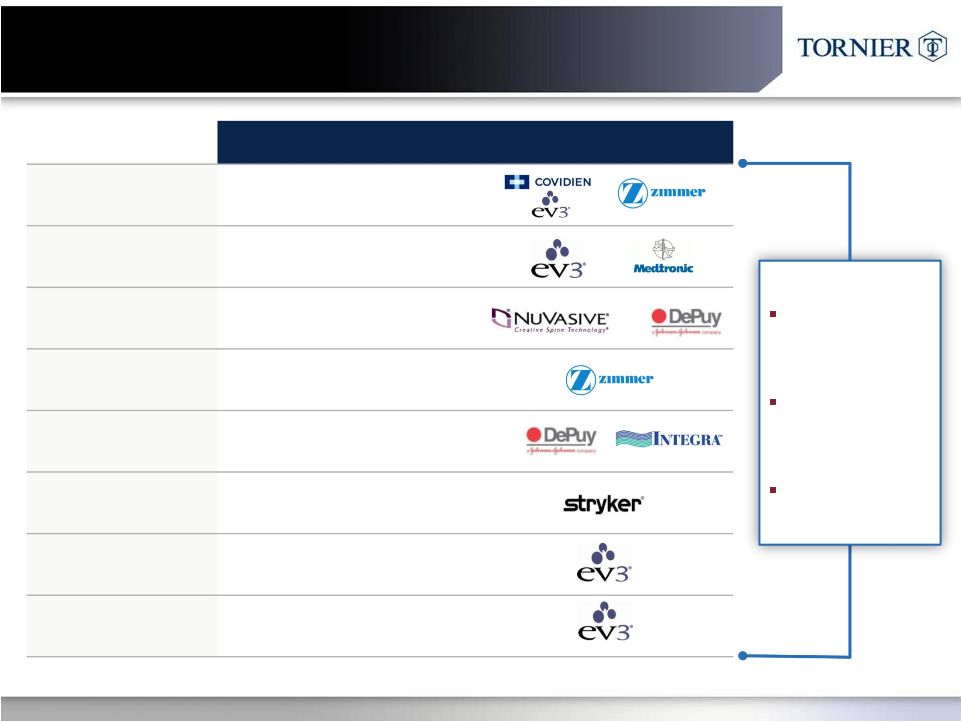
LEVERAGE
Strength of Products / Innovation
R&D Skills and Talent
Key Physician Relationships
Common Call Points |
 13
12
10
2
3
35
9
CALL
POINT
FOCUS
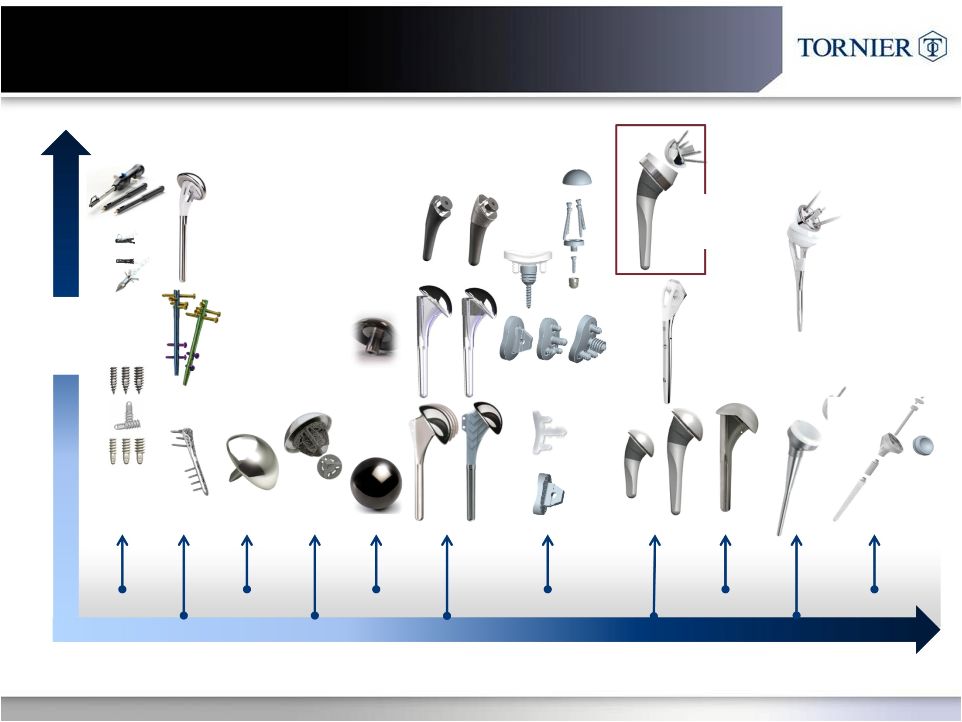
Most Comprehensive Extremities Product Portfolio
88 Distinct Extremities Products
[ 13 ]
4
JOINT
JOINT
REPLACEMENTS
REPLACEMENTS
BONE REPAIR
BONE REPAIR
BIOLOGICS
BIOLOGICS
SPORTS
SPORTS
MEDICINE
MEDICINE
SHOULDER
HAND,
WRIST AND
ELBOW
FOOT AND
ANKLE
PROCEDURES |
 January
‘13 Filling Out Portfolio with High-Impact New Products
UPPER EXTREMITIES
UPPER EXTREMITIES
Shoulder Arthroplasty
% of Addressed Procedures
ADDED
Ascend Flex Press-Fit
Reverse Shoulder
(Revision Friendly)
LOWER EXTREMITIES
LOWER EXTREMITIES
Foot and Ankle Procedures
% of Addressable Procedures
OrthoHelix Foot
and Ankle Portfolio
[ 14 ] |
 Varying
Treatment
Anchors
Fracture
Resurfacing
Stemless
Anatomic
Reverse
Revision
Convertible
CTA
Glenoid
Conservative to More Aggressive Treatments
PyC
Tornier Shoulder Portfolio:
Building a Continuum of Care
Ascend
Flex
[ 15 ]
Options |
 The
“Go-To” Company for the Specialist
[ 16 ]
CLINICAL DATA DRIVEN STRATEGY
Aequalis Shoulder Registry
Simpliciti Shoulder US IDE Study
Salto-Talaris Total Ankle Data Set
Pyrolytic Carbon Material & Application
Biologic Augmentation
Synthetic Growth Factors
Significant Investment in Training & Education
Unique Shoulder and Foot & Ankle Master Courses
Tornier Fellows Courses
ACTIVE FUNDAMENTAL RESEARCH
COMMITMENT TO CLINICAL EDUCATION
RESPECTED FOR
RESPECTED FOR
SCIENTIFIC RIGOR
SCIENTIFIC RIGOR |
 Efficient, Targeted Sales Distribution
BROADEST
PRODUCT PORTFOLIO
Upper
Extremities
Lower
Extremities
Biologics/
Sports
Medicine
Leader in Innovation,
Science Education
HIGH
GROWTH MARKET
Robust Drivers
Assure Growth
Extremities
$6.5B
7-9%
CAGR
(’202 –
2017)
EXECUTION FOCUS FOR 2013
SCALE FOR
SCALE FOR
EFFICIENT SALES
EFFICIENT SALES
Target High-Volume
Extremities Specialists
Upper
Extremities
Lower
Extremities
[ 17 ] |
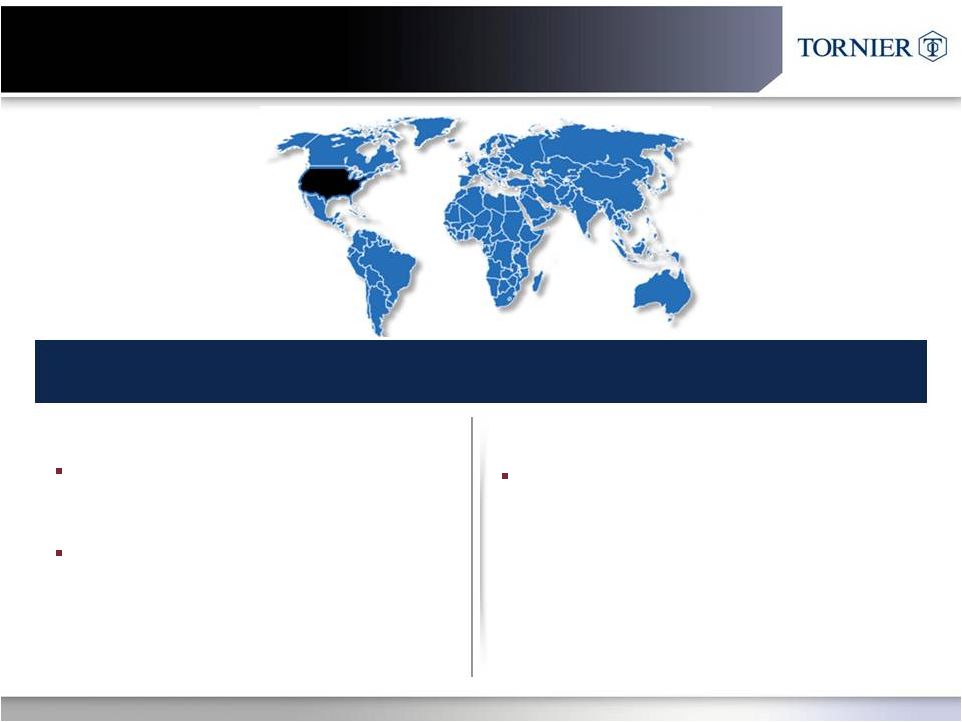
 US: Planning for Focused
Upper and Lower Sales Distribution
CHANNEL FOCUS MIRRORS
CUSTOMER SPECIALIZATION
Upper Extremities
Lower Extremities
Sales
Force:
Surgeon
Specialists:
Shoulder, Elbow,
Wrist & Hand
Foot and
Ankle
[ 18 ]
Complete Offering / Procedure Coverage
Product Pull-through / Cross-Selling
Access to New Surgeons & Accounts
Entry
into
“OPEN
OrthoHelix
Territories
INCREASED SELLING
OPPORTUNITIES
Scale Drives Flexibility
” |
 International: Addressing Mature and
Underpenetrated Markets
OUS Launch of OrthoHelix Products in 2H ‘13
MATURE MARKETS
–
Focused Extremities Channels
–
Japan Converted to Direct 2Q12
–
Belgium Converted to Direct in 3Q12
–
Canada Conversion Planned for 1H13
UNDER PENETRATED MARKETS
–
Underpenetrated in So America & Asia
–
4 New Countries Added in 2012
•
–
Additional Registration and Approvals
–
Introduction of Complementary
Products
Direct in Key EU and PACRIM Markets
Ongoing Channel Conversions
Untapped Geographies
Leverage Existing Geographies
[ 19 ] |
 The
Outlook for 2013 BROADEST
PRODUCT PORTFOLIO
Upper
Extremities
Lower
Extremities
Biologics/
Sports
Medicine
Leader in Innovation,
Science Education
SCALE FOR
EFFICIENT SALES
Target High-Volume
Extremities Specialists
Upper
Extremities
Lower
Extremities
HIGH
GROWTH MARKET
Robust Drivers
Assure Growth
Extremities
Extremities
$6.5B
7-9%
CAGR
(2012 –
2017)
EXECUTION FOCUS FOR 2013
[ 20 ] |
 POSITION
EXPERIENCE
EXPERIENCE
Dave Mowry
Interim President & CEO
Shawn McCormick
CFO
Terry Rich
SVP US Commercial Ops
David Andersen
VP Global Marketing
Robert Ball
VP Global R & D
Stéphan Epinette
VP International Commercial Ops
Kevin Klemz
VP, Chief Legal Officer
Greg Morrison
VP Global HR
Energized, Execution-Focused Leadership Team
EXPERTISE
EXECUTION
FOCUS
Medical Device
Orthopedics
Drive Revenues
& Profitability
Do Fewer Things,
Better
[ 21 ] |
 Positioning the Company for Future Growth
Continue to Innovate Across Portfolio
10 –
12 New Products Per Year
Increase the Focus of Our Sales Channels
Balanced Global Extremities Growth
Direct in Mature Markets; Expand in Emerging Markets
Expanding OUS Channels
Leverage OrthoHelix to
Achieve Foot and Ankle Leadership
[ 22 ]
TECHNOLOGY
TECHNOLOGY
LEADER
LEADER
DRIVE
DRIVE
REVENUE
REVENUE
DRIVE
DRIVE
REVENUE
REVENUE
INCREASE
INCREASE
GROWTH RATE
GROWTH RATE |
 2013
– We Will Focus on a Vital Few Initiatives
US Sales Channel Alignment
1
OrthoHelix Integration
2
New Product Launches
3
[ 23 ] |
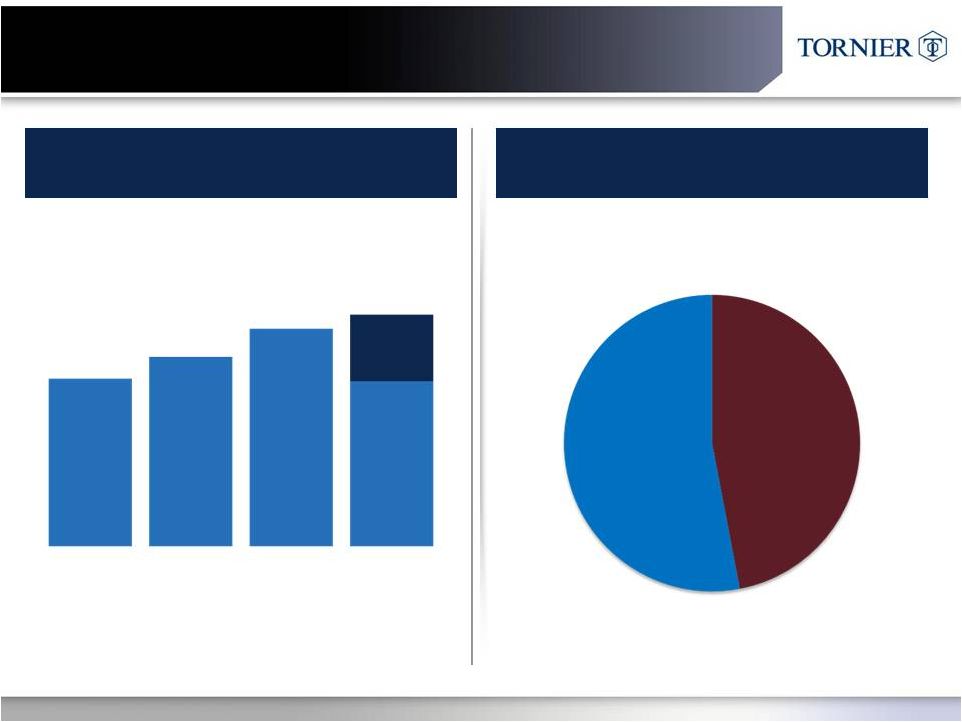 Positioned for Growth:
Revenue *
Expected
2012
revenue
as
reiterated
in
press
release
on
January
7,
2013
[ 24 ]
HISTORY
HISTORY
GEOGRAPHY
GEOGRAPHY
$201M
$227M
$261M
$274 -
277M*
2009
2010
2011
Expected
2012
$75.8-78.8M*
$274 -
$277M
Expected 2012*
US
~56%
OUS
~44% |
 Summary
BROADEST
BROADEST
PRODUCT PORTFOLIO
PRODUCT PORTFOLIO
Upper
Extremities
Lower
Extremities
Biologics/
Sports
Medicine
Leader in Innovation,
Science & Education
HIGH
HIGH
GROWTH MARKET
GROWTH MARKET
Robust Drivers
Assure Growth
Extremities
$6.5B
7-9%
CAGR
(’12 –
’17)
EXECUTION FOCUS FOR 2013
SCALE FOR
SCALE FOR
EFFICIENT SALES
EFFICIENT SALES
Target High-Volume
Extremities Specialists
Upper
Extremities
Lower
Extremities
[ 25 ] |
 Specialists SERVING Specialists
[ 26 ] |