Attached files
| file | filename |
|---|---|
| 8-K - FORM 8-K - Sow Good Inc. | blackridge_8k.htm |
Exhibit 99.1
Ken DeCubellis, CEO January 7, 2013 Annual New York Micro Cap Conference - Sidoti & Company OTCBB/OTCQB: ANFC © Black Ridge Oil & Gas, Inc.
2 Forward Looking Statements Statements made by representatives of Black Ridge Oil & Gas, Inc . (“Black Ridge” or the “Company”) during the course of this presentation that are not historical facts are “forward-looking statements” within the meaning of federal securities laws . These statements are based on certain assumptions and expectations made by the Company which reflect management’s experience, estimates and perception of historical trends, current conditions, anticipated future developments and other factors believed to be appropriate . No assurances can be given that such assumptions and expectations will occur as anticipated and actual results may differ materially from those implied or anticipated in the forward looking statements . Such statements are subject to a number of risks and uncertainties, many of which are beyond the control of the Company, and which include risks relating to the global financial crisis, our ability to obtain additional capital needed to implement our business plan, declines in prices and demand for gas, oil and natural gas liquids, our minimal operating history, loss of key personnel, lack of business diversification, reliance on strategic third-party relationships, ability to obtain rights to explore and develop oil and gas reserves, the rate of in - fill drilling on our leased acreage, financial performance and results, our indebtedness under our line of credit, our ability to replace reserves and efficiently develop our current reserves, our ability to make acquisitions on economically acceptable terms, our ability to become listed on a national exchange, and other important factors . Black Ridge undertakes no obligation to publicly update any forward-looking statements, whether as a result of new information or future events .
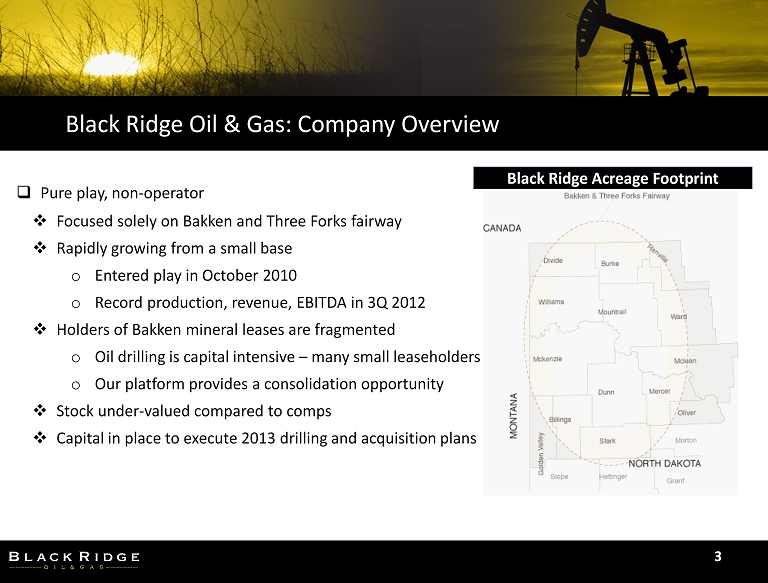
Black Ridge Oil & Gas: Company Overview 3 Black Ridge Acreage Footprint □ Pure play, non - operator □ Focused solely on Bakken and Three Forks fairway □ Rapidly growing from a small base o Entered play in October 2010 o Record production, revenue, EBITDA in 3Q 2012 □ Holders of Bakken mineral leases are fragmented o Oil drilling is capital intensive – many small leaseholders o Our platform provides a consolidation opportunity □ Stock under - valued compared to comps □ Capital in place to execute 2013 drilling and acquisition plans
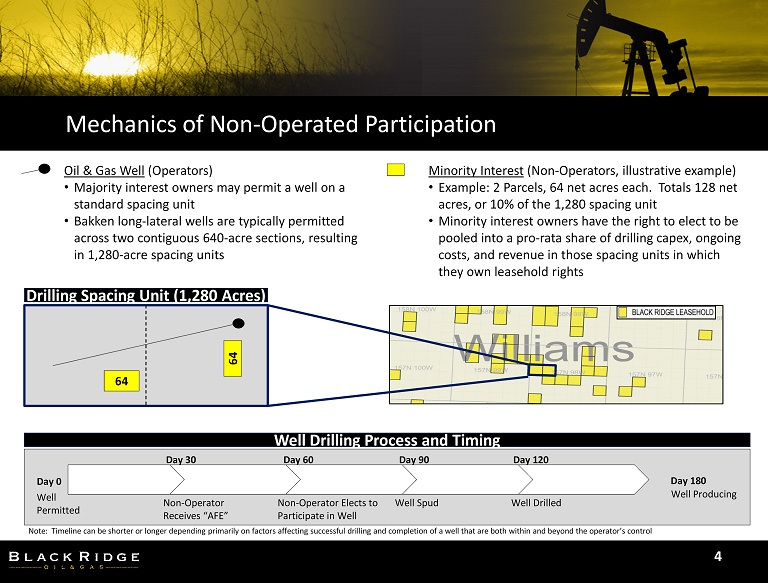
Mechanics of Non - Operated Participation 4 64 64 Well Permitted Non - Operator Receives “AFE” Non - Operator Elects to Participate in Well Well Spud Well Drilled Well Producing Oil & Gas Well (Operators) • Majority interest owners may permit a well on a standard spacing unit • Bakken long - lateral wells are typically permitted across two contiguous 640 - acre sections, resulting in 1,280 - acre spacing units Minority Interest (Non - Operators, illustrative example) • Example: 2 Parcels, 64 net acres each. Totals 128 net acres, or 10% of the 1,280 spacing unit • Minority interest owners have the right to elect to be pooled into a pro - rata share of drilling capex , ongoing costs, and revenue in those spacing units in which they own leasehold rights Day 0 Day 30 Day 60 Day 90 Day 120 Day 180 Note: Timeline can be shorter or longer depending primarily on factors affecting successful drilling and completion of a wel l t hat are both within and beyond the operator’s control Drilling Spacing Unit (1,280 Acres) Well Drilling Process and Timing
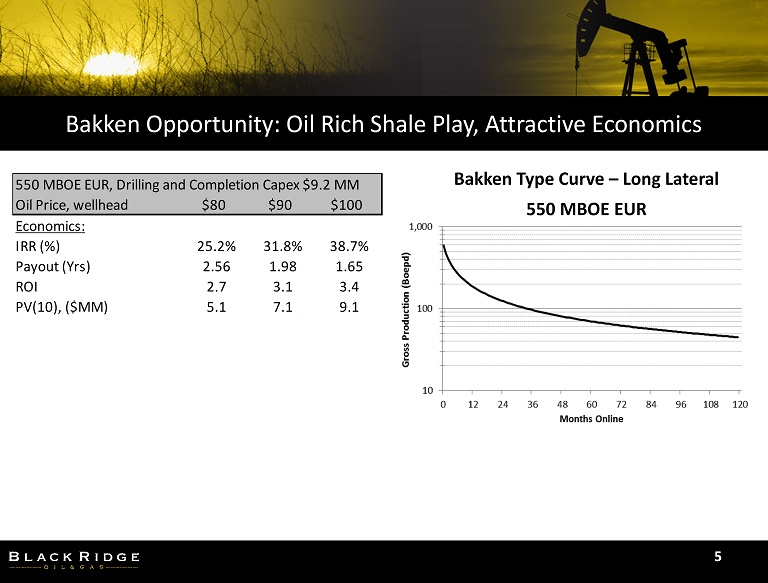
Bakken Opportunity: Oil Rich Shale Play, Attractive Economics 5 Bakken Type Curve – Long Lateral 550 MBOE EUR 550 MBOE EUR, Drilling and Completion Capex $9.2 MM Oil Price, wellhead $80 $90 $100 Economics: IRR (%) 25.2% 31.8% 38.7% Payout (Yrs) 2.56 1.98 1.65 ROI 2.7 3.1 3.4 PV(10), ($MM) 5.1 7.1 9.1
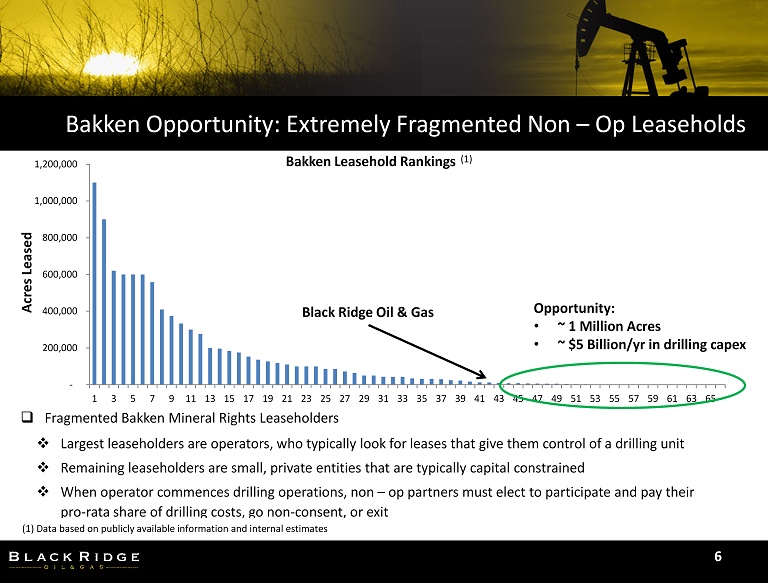
- 200,000 400,000 600,000 800,000 1,000,000 1,200,000 1 3 5 7 9 11 13 15 17 19 21 23 25 27 29 31 33 35 37 39 41 43 45 47 49 51 53 55 57 59 61 63 65 Bakken Leasehold Rankings Bakken Opportunity: Extremely Fragmented Non – Op Leaseholds 6 □ Fragmented Bakken Mineral Rights Leaseholders □ Largest leaseholders are operators, who typically look for leases that give them control of a drilling unit □ Remaining leaseholders are small, private entities that are typically capital constrained □ When operator commences drilling operations, non – op partners must elect to participate and pay their pro - rata share of drilling costs, go non - consent, or exit (1) Data based on publicly available information and internal estimates (1) Acres Leased Black Ridge Oil & Gas Opportunity: • ~ 1 Million Acres • ~ $5 Billion/ yr in drilling capex
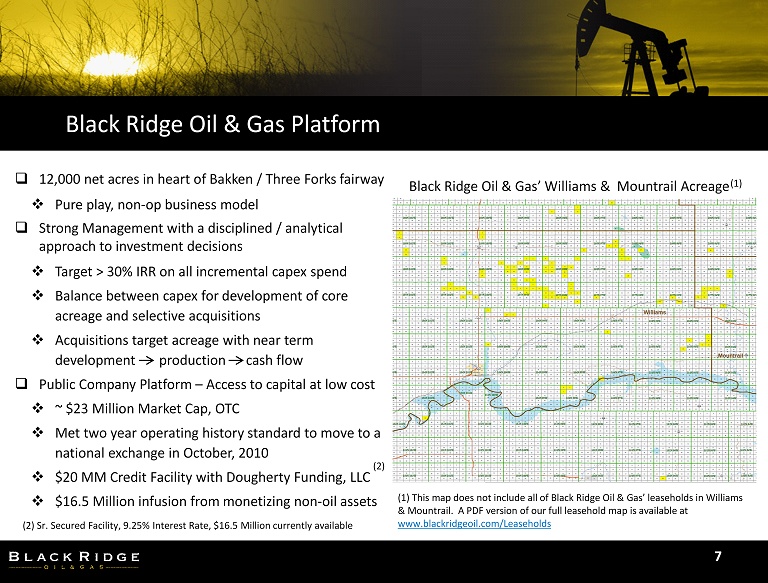
Black Ridge Oil & Gas Platform 7 □ 12,000 net acres in heart of Bakken / Three Forks fairway □ Pure play, non - op business model □ Strong Management with a disciplined / analytical approach to investment decisions □ Target > 30% IRR on all incremental capex spend □ Balance between capex for development of core acreage and selective acquisitions □ Acquisitions target acreage with near term development production cash flow □ Public Company Platform – Access to capital at low cost □ ~ $23 Million Market Cap, OTC □ Met two year operating history standard to move to a national exchange in October, 2010 □ $20 MM Credit Facility with Dougherty Funding, LLC □ $16.5 Million infusion from monetizing non - oil assets (1) This map does not include all of Black Ridge Oil & Gas’ leaseholds in Williams & Mountrail. A PDF version of our full leasehold map is available at www.blackridgeoil.com/Leaseholds Black Ridge Oil & Gas’ Williams & Mountrail Acreage (2) Sr. Secured Facility, 9.25% Interest Rate, $16.5 Million currently available (1) (2)
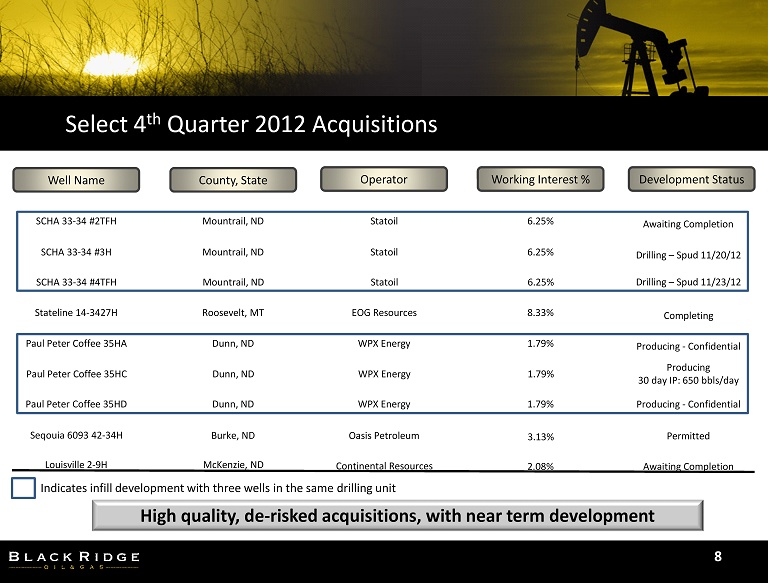
Select 4 th Quarter 2012 Acquisitions 8 Well Name County, State Operator Working Interest % Development Status SCHA 33 - 34 #2TFH SCHA 33 - 34 #3H SCHA 33 - 34 #4TFH Stateline 14 - 3427H Paul Peter Coffee 35HA Paul Peter Coffee 35HC Paul Peter Coffee 35HD Statoil Statoil Statoil EOG Resources WPX Energy WPX Energy WPX Energy Mountrail, ND Mountrail, ND Mountrail, ND Roosevelt, MT Dunn, ND Dunn, ND Dunn, ND Awaiting Completion Drilling – Spud 11/20/12 Completing Producing - Confidential 6.25% 6.25% 6.25% 8.33% 1.79% 1.79% 1.79% Drilling – Spud 11/23/12 Producing - Confidential Producing 30 day IP: 650 bbls/day Seqouia 6093 42 - 34H Burke, ND Oasis Petroleum 3.13% Permitted Awaiting Completion 2.08% Continental Resources McKenzie, ND Louisville 2 - 9H Indicates infill development with three wells in the same drilling unit High quality, de - risked acquisitions, with near term development
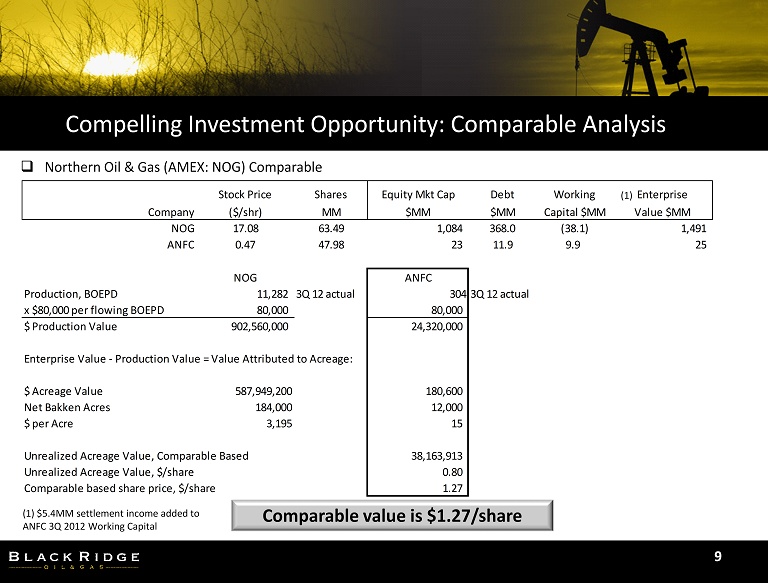
Stock Price Shares Equity Mkt Cap Debt Working Enterprise Company ($/shr) MM $MM $MM Capital $MM Value $MM NOG 17.08 63.49 1,084 368.0 (38.1) 1,491 ANFC 0.47 47.98 23 11.9 9.9 25 NOG ANFC Production, BOEPD 11,282 3Q 12 actual 3043Q 12 actual x $80,000 per flowing BOEPD 80,000 80,000 $ Production Value 902,560,000 24,320,000 Enterprise Value - Production Value = Value Attributed to Acreage: $ Acreage Value 587,949,200 180,600 Net Bakken Acres 184,000 12,000 $ per Acre 3,195 15 Unrealized Acreage Value, Comparable Based 38,163,913 Unrealized Acreage Value, $/share 0.80 Comparable based share price, $/share 1.27 Compelling Investment Opportunity: Comparable Analysis 9 □ Northern Oil & Gas (AMEX: NOG) Comparable Comparable value is $1.27/share (1) (1) $5.4MM settlement income added to ANFC 3Q 2012 Working Capital
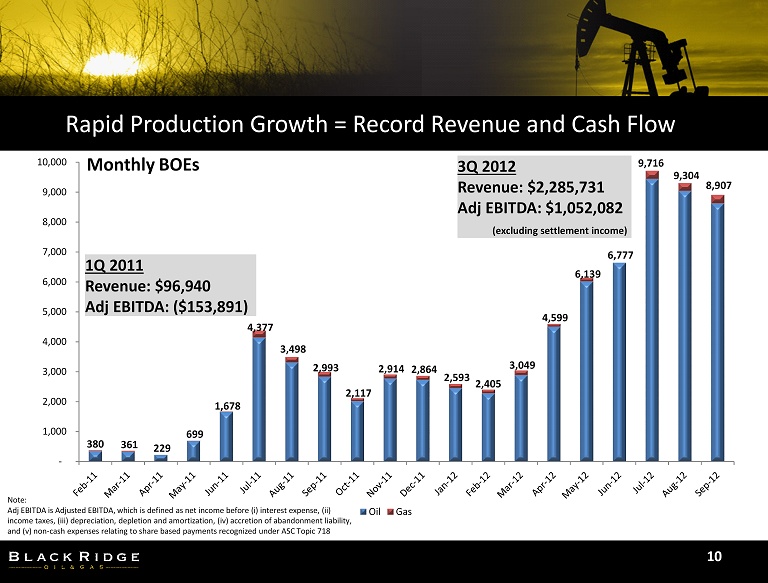
380 361 229 699 1,678 4,377 3,498 2,993 2,117 2,914 2,864 2,593 2,405 3,049 4,599 6,139 6,777 8,907 - 1,000 2,000 3,000 4,000 5,000 6,000 7,000 8,000 9,000 10,000 Oil Gas 9,716 9,304 Rapid Production Growth = Record Revenue and Cash Flow 10 Monthly BOEs 1Q 2011 Revenue: $96,940 Adj EBITDA: ($153,891) 3Q 2012 Revenue: $2,285,731 Adj EBITDA: $1,052,082 (excluding settlement income) Note: Adj EBITDA is Adjusted EBITDA, which is defined as net income before ( i ) interest expense, (ii) income taxes, (iii) depreciation, depletion and amortization, (iv) accretion of abandonment liability, and (v) non - cash expenses relating to share based payments recognized under ASC Topic 718
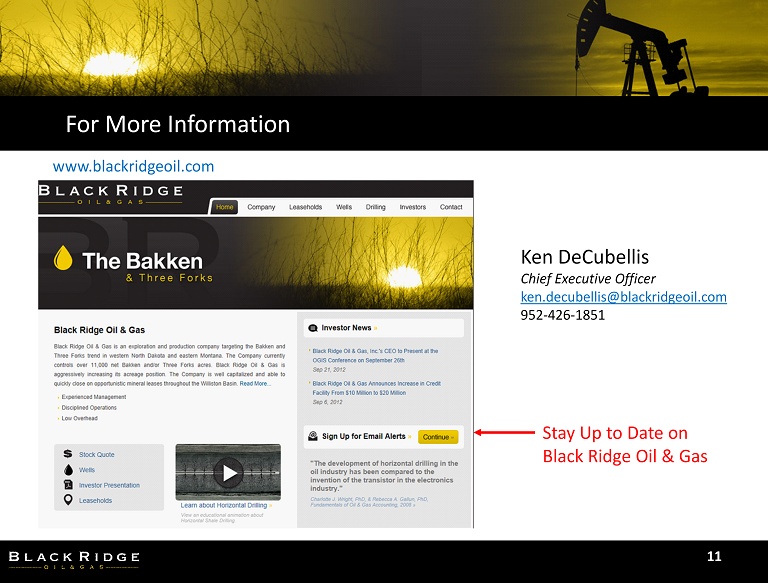
Ken DeCubellis Chief Executive Officer ken.decubellis@blackridgeoil.com 952 - 426 - 1851 For More Information 11 Stay Up to Date on Black Ridge Oil & Gas www.blackridgeoil.com
Supporting Information 12
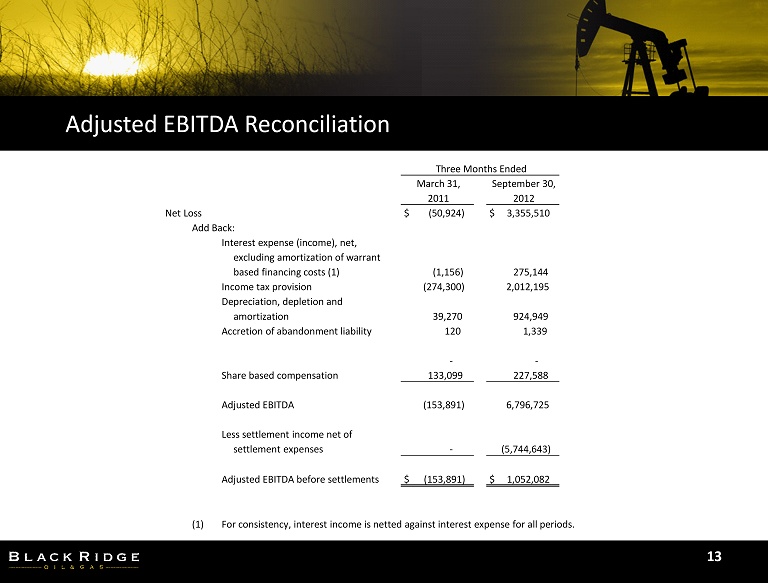
Three Months Ended March 31, September 30, 2011 2012 Net Loss $ (50,924) $ 3,355,510 Add Back: Interest expense (income), net, excluding amortization of warrant based financing costs (1) (1,156) 275,144 Income tax provision (274,300) 2,012,195 Depreciation, depletion and amortization 39,270 924,949 Accretion of abandonment liability 120 1,339 - - Share based compensation 133,099 227,588 Adjusted EBITDA (153,891) 6,796,725 Less settlement income net of settlement expenses - (5,744,643) Adjusted EBITDA before settlements $ (153,891) $ 1,052,082 (1) For consistency, interest income is netted against interest expense for all periods. Adjusted EBITDA Reconciliation 13