Attached files
| file | filename |
|---|---|
| EX-31.2 - EXHIBIT 31.2 - SHAW GROUP INC | ex31-2.htm |
| EX-31.1 - EXHIBIT 31.1 - SHAW GROUP INC | ex31-1.htm |
UNITED STATES SECURITIES AND EXCHANGE COMMISSION
Washington, D.C. 20549
Form 10-K/A
Amendment No. 1
|
R
|
ANNUAL REPORT PURSUANT TO SECTION 13 OR 15(d) OF THE SECURITIES EXCHANGE ACT OF 1934
|
|
For the fiscal year ended August 31, 2012
|
|
|
or
|
|
|
£
|
TRANSITION REPORT PURSUANT TO SECTION 13 OR 15(d) OF THE SECURITIES EXCHANGE ACT OF 1934
|
|
For the transition period from to
|
|
Commission file number: 1-12227
THE SHAW GROUP INC.
(Exact name of registrant as specified in its charter)
|
LOUISIANA
|
72-1106167
|
|
(State or other jurisdiction of
incorporation or organization)
|
(I.R.S. Employer
Identification No.)
|
4171 Essen Lane
Baton Rouge, Louisiana 70809
(Address of principal executive offices, including zip code)
(225) 932-2500
(Registrant’s telephone number, including area code)
Securities registered pursuant to Section 12(b) of the Act:
|
Title of Each Class
|
Name of Each Exchange on Which Registered
|
|
Common Stock — no par value
|
New York Stock Exchange
|
Securities registered pursuant to Section 12(g) of the Act:
None.
Indicate by check mark if the registrant is a well-known seasoned issuer, as defined in Rule 405 of the Securities Act. Yes R No o
Indicate by check mark if the registrant is not required to file reports pursuant to Section 13 or Section 15(d) of the Act. Yes o No R
Indicate by check mark whether the registrant (1) has filed all reports required to be filed by Section 13 or 15(d) of the Securities Exchange Act of 1934 during the preceding 12 months (or for such shorter period that the registrant was required to file such reports), and (2) has been subject to such filing requirements for the past 90 days. Yes R No o
Indicate by check mark whether the registrant has submitted electronically and posted on its corporate Website, if any, every Interactive Data File required to be submitted and posted pursuant to Rule 405 of Regulation S-T (§ 229.405 of this chapter) during the preceding 12 months (or for such shorter period that the registrant was required to submit and post such files). Yes R No o
Indicate by check mark if disclosure of delinquent filers pursuant to Item 405 of Regulation S-K (§ 229.405 of this chapter) is not contained herein, and will not be contained, to the best of registrant’s knowledge, in definitive proxy or information statements incorporated by reference in Part III of this Form 10-K or any amendment to this Form 10-K. R
Indicate by check mark whether the registrant is a large accelerated filer, an accelerated filer, a non-accelerated filer or a smaller reporting company. See the definitions of “large accelerated filer,” “accelerated filer” and “smaller reporting company” in Rule 12b-2 of the Exchange Act.
|
Large accelerated filer R
|
Accelerated filer o
|
||
|
Non-accelerated filer o (Do not check if a smaller reporting company)
|
Smaller reporting company o
|
||
Indicate by check mark whether the registrant is a shell company (as defined in Rule 12b-2 of the Act). Yes o No R
The aggregate market value of the voting and non-voting common stock held by non-affiliates of the registrant was approximately $1.2 billion (computed by reference to the closing sale price of the registrant’s common stock on the New York Stock Exchange (NYSE) on February 29, 2012. Common stock held as of such date by each officer and director and by each person who owns 5% or more of the outstanding common stock have been excluded in that such persons may be deemed to be affiliates. This determination of affiliate status is not necessarily a conclusive determination for other purposes.
The number of shares of the registrant’s common stock outstanding at December 19, 2012 was 66,663,781.
DOCUMENTS INCORPORATED BY REFERENCE
None.
Explanatory Note
As previously announced, on July 30, 2012, we entered into a Transaction Agreement (the “Transaction Agreement”) with Chicago Bridge & Iron Company N.V., a limited liability company (naamloze vennootschap) with a corporate seat in Amsterdam, the Netherlands (“CB&I”), and Crystal Acquisition Subsidiary Inc, a Louisiana corporation and wholly-owned subsidiary of CB&I (“Merger Sub”). The Transaction Agreement provides that, upon the terms and subject to the conditions set forth in the Transaction Agreement, Merger Sub will merge with and into the Company (the “Transaction”), with the Company surviving the Merger as a wholly-owned subsidiary of CB&I. We currently expect to complete the Transaction during the first quarter of calendar 2013. The CB&I shareholders approved the Transaction on December 18, 2012 and our shareholders approved the Transaction on December 21, 2012. The Transaction is also subject to a pending regulatory approval and certain other closing conditions. In light of the proposed transaction, we do not anticipate holding an annual meeting of shareholders in 2013.
This Amendment No. 1 on Form 10-K/A (the Amendment) amends our Annual Report on Form 10-K for the fiscal year ended August 31, 2012, originally filed with the Securities and Exchange Commission (SEC) on October 19, 2012 (the Form 10-K). We are filing this Amendment to amend Part III of the Form 10-K to include the information required by and not included in Part III of the Form 10-K because we no longer intend to file our definitive proxy statement within 120 days of the end of our fiscal year ended August 31, 2012. Because no financial statements are contained within this Amendment, we are not including certifications pursuant to Section 906 of the Sarbanes-Oxley Act of 2002.
Except as described above, this Amendment does not reflect events occurring after the date of the Form 10-K, nor does it modify or update the disclosure contained in the Form 10-K in any way other than as required to reflect the amendments discussed above and reflected below. Accordingly, this Amendment should be read in conjunction with our Form 10-K and our other filings made with the SEC on or subsequent to the filing of our Form 10-K on October 19, 2012.
TABLE OF CONTENTS
| PART III | ||||
| ITEM 10. | DIRECTORS, EXECUTIVE OFFICERS AND CORPORATE GOVERNANCE | 1 | ||
| ITEM 11. | EXECUTIVE COMPENSATION | 5 | ||
| ITEM 12. | SECURITY OWNERSHIP OF CERTAIN BENEFICIAL OWNERS AND MANAGEMENT AND RELATED STOCKHOLDER MATTERS | 50 | ||
| ITEM 13. | CERTAIN RELATIONSHIPS AND RELATED TRANSACTIONS, AND DIRECTOR INDEPENDENCE | 53 | ||
| ITEM 14. | PRINCIPAL ACCOUNTING FEES AND SERVICES | 54 | ||
| PART IV | ||||
| ITEM 15. | EXHIBITS, FINANCIAL STATEMENT SCHEDULES | 56 | ||
| SIGNATURE | 60 | |||
| EXHIBIT INDEX | ||||
PART III
ITEM 10. DIRECTORS, EXECUTIVE OFFICERS AND CORPORATE GOVERNANCE
INFORMATION ABOUT DIRECTORS
The following provides information about our current directors. Below each director’s biography, we have included an assessment of the qualifications and experience of such director.
|
J.M. BERNHARD, JR.
Age: 58
Director Since: 1987
|
Board Committees:
• Executive
|
Company Positions:
• Chairman of the Board, Chief Executive Officer and President
|
Mr. Bernhard, our founder, has been our Chief Executive Officer and a director since the Company began in 1987. Mr. Bernhard served as our President from 1987 until 2003. Our Board re-elected him as President in November 2006, and he has continually served in that position ever since. He has been Chairman of our Board since August 1990. Prior to founding the Company, Mr. Bernhard was vice president and general manager of Sunland Services, a pipe fabrication and industrial construction company that the Company later acquired. He is also a member of numerous trade and civic organizations. He graduated from Louisiana State University in 1976 with a degree in Construction Management.
Under Mr. Bernhard’s leadership, the Company has grown dramatically through a series of strategic acquisitions. The Company has been named to the Fortune 500 list seven times and is one of the youngest companies to appear on such list. In addition, the Company has been recognized twice as one of the Fortune 500 Magazine’s “Most Admired Companies.” The Company also has been named “Contractor of the Year” by Associated Builders and Contractors.
Mr. Bernhard is our longest-serving Board member. For over 20 years, he has contributed to the Company his operational, financial and strategic experience garnered from his career and involvement in the fabrication, engineering, and construction industry. In addition to these qualifications, attributes and skills, Mr. Bernhard offers the perspective, institutional knowledge and deep understanding of our business. As the only member of our management team to serve on our Board, Mr. Bernhard contributes a level of understanding of the Company not easily attainable by an outside director.
In fiscal year 2012, Mr. Bernhard assumed operational leadership after the retirement of our former Chief Operating Officer and he negotiated the pending acquisition of the Company by CB&I for cash and stock, in which shareholders will receive a 72% premium over the closing price for last trading day prior to announcement upon consummation of the transaction (for further discussion please see our current report on the Form 8-K filed with the SEC on July 30, 2012).
|
JAMES F. BARKER
Age: 65
Director Since: January 2004
|
Board Committees:
• Audit
• Compensation
|
Private Directorships:
• President, Clemson University
|
Mr. Barker has served as president of Clemson University since December 1999. He earned his bachelor of architecture degree from Clemson in 1970 and his master of architecture and urban design degree from Washington University in St. Louis in 1973. Before returning to Clemson in 1986 to serve as dean of the College of Architecture, he was dean of the School of Architecture at Mississippi State University. Mr. Barker is a fellow of the American Institute of Architects.
As president of a large public university with an annual budget in excess of $800 million, Mr. Barker understands the management concerns created by varied interests and business units within an organization operating in a public domain. His ability to make policy and financial decisions for the entire organization under stakeholder stresses positively contributes to our Board’s deliberations. His experience administering and managing the finances of a university and of several non-profit organizations make him a valued member of our Board.
|
THOS. E. CAPPS
Age: 77
Director Since: July 2007
|
Board Committees:
• Audit
|
Public Directorships:
• Amerigroup Corp.
Private Directorships:
•Associated Electric & Gas Insurance Services Ltd.
|
Mr. Capps served as chief executive officer of Dominion Resources, Inc. (NYSE: D) from January 2000 to December 2005; as president from September 1995 to December 2003; as chairman from September 1995 to January 2000; as vice chairman of the board of directors from January 2000 to August 2000; and as president and chief executive officer from September 1995 to January 2000. Dominion Resources is a publicly-held power and energy company that supplies electricity, natural gas and other energy sources and operates generation facilities. Mr. Capps is a member of the board of directors of Amerigroup Corp. (NYSE: AGR) of Virginia Beach, a publicly-held, managed-healthcare company, and Associated Electric & Gas Insurance Services Ltd., which operates as a non-assessable mutual insurance company in the U.S., offering insurance and risk management products and services to the utility and related energy industry.
Mr. Capps brings his nearly twenty year’s experience with Dominion Resources, Inc., to our Board. This knowledge of power sources, power generation and supply contributes to our Board’s understanding of both our clients’ and the Company’s needs and capacities. His enduring leadership as chairman, president and chief executive officer of Dominion Resources evidences his ability to manage a breadth of public company matters. His experience supervising financial and accounting personnel and broad understanding of accounting principles, internal controls over financial reporting and audit committee functions are important contributions to our Audit Committee.
1
|
DANIEL A. HOFFLER
Age: 64
Director Since: January 2006
|
Board Committees:
• Compensation (Chair)
• Nominating and Corporate Governance
|
Private Directorships:
• Armada Hoffler
|
Mr. Hoffler is the chairman of the board of directors of Armada Hoffler, a premier commercial real estate development and construction organization located in Virginia, which he founded over 25 years ago. Before founding Armada Hoffler, Mr. Hoffler was employed as vice president of marketing for Eastern International, Inc., a commercial real estate development and construction company specializing in construction of warehouse and office buildings. Prior to that, Mr. Hoffler was employed as a regional manager for Dun and Bradstreet, a credit information provider. From 1992 through 1996, Mr. Hoffler served on the University of Virginia Board of Visitors. In 1987, he was chosen as the Outstanding Citizen of Hampton Roads, Virginia. In 1986, Mr. Hoffler was appointed to a five-year term in the Virginia Governor’s Advisory Board for Industrial Development for the Commonwealth of Virginia.
Mr. Hoffler’s vast experience in real estate development and construction and his understanding of debt and equity markets complements the experience and knowledge base of our other directors. His unique skill set relating to design-build collaborations and public/private partnerships combined with his understanding of financial markets assist our Board in evaluating creative and value-creating Company initiatives. As founder of his company, he understands issues relating to the growth of a business and the concerns involved in running a profitable company. His business leadership and experience in growing a company make him uniquely qualified to serve as the Chair of our Compensation Committee.
|
DAVID W. HOYLE
Age: 73
Director Since: January 1995
|
Board Committees:
• Audit
• Nominating and Corporate Governance (Chair)
• Executive
|
Public Directorships:
• Citizens South Banking Corporation
Government Positions:
• Secretary of Revenue, North Carolina
|
For the past 25 years, Secretary Hoyle has been self-employed, primarily as a real estate developer. From 1992 until 2010, he served as a Senator in the North Carolina General Assembly. He served as chairman of the North Carolina Senate Finance Committee for 12 years. In October 2010, he was sworn in as Secretary of Revenue for the State of North Carolina. Secretary Hoyle was the chairman of the board of directors of Citizens South Banking Corporation, a bank holding company, and the chairman emeritus of the board of directors of its wholly-owned subsidiary, Citizens South Bank, until May 2012, when the bank was sold to Park Sterling Bank. His government leadership and integrity serve the Company well in his capacity as Chair of the Nominating and Corporate Governance Committee.
Secretary Hoyle contributes his knowledge of banking, tax and real estate development issues and experience with financial management to our Board’s deliberations. His long tenure in the North Carolina Senate evidences his understanding of governance, leadership skills, and knowledge of working with government bodies. With 15 years’ service on our Board, his institutional knowledge and historical perspective are vital assets to our Board and our shareholders.
|
MICHAEL J. MANCUSO
Age: 70
Director Since: August 2006
|
Board Committees:
• Audit (Chair)
• Executive
|
Public Directorships:
• SPX Corporation
Former Public Directorships Held During the Past Five Years:
• LSI Logic Corporation
• CACI International Inc.
|
Mr. Mancuso was named vice president and chief financial officer of Computer Services Corporation (NYSE: CSC), a publicly-held leading provider of information technology and professional services to large corporations and governments, on December 1, 2008. He retired from that position in May 2012. In June 2006, after 13 years’ service, Mr. Mancuso retired from General Dynamics Corporation (NYSE: GD), a company engaged in the field of mission-critical information systems and technologies, land and expeditionary combat systems, armaments and munitions, shipbuilding and marine systems and business aviation. Mr. Mancuso had served as senior vice president and chief financial officer of General Dynamics from 1994 until his retirement from General Dynamics in 2006. Before joining General Dynamics, Mr. Mancuso spent seven years with United Technologies, where he served as vice president and chief financial officer for the Commercial Engine Business of the Pratt & Whitney Group. He joined United Technologies Defense and Space Systems Group in 1986 as group financial manager, moved to the aerospace and defense section in 1989 as director, financial planning and analysis, and spent three years as vice president, finance and administration for the Hamilton standard division. His background also includes 21 years with General Electric. Mr. Mancuso also serves on the board of directors for SPX Corporation (NYSE: SPW), a publicly-held industrial manufacturer headquartered in Charlotte, North Carolina. From 2007 until 2009, Mr. Mancuso also served on the board of directors for LSI Logic Corporation (NYSE: LSI), a publicly-held leading provider of silicon systems and software technologies, headquartered in Milpitas, California. From 2007 until 2008, Mr. Mancuso also served on the board of directors for CACI International Inc. (NYSE: CACI), a publicly-held provider of information technology and professional services to the U.S. federal government and commercial markets in North America and internationally, headquartered in Arlington, Virginia.
Mr. Mancuso brings a strong background in operations, finance and financial reporting with large publicly traded companies to our Board. As former chief financial officer of a leading information technology company and former chief financial officer of a major technology and defense company, he has the financial background and operational experience to understand and to provide guidance in evaluating complex business and financial issues facing large public companies. His strategic and financial perspective, and long involvement with government and international operations, brings a valuable perspective to our Board and to his leadership as chair of our Audit Committee.
2
|
ALBERT D. McALISTER
Age: 61
Director Since: April 1990
|
Board Committees:
• Compensation
• Nominating and Corporate Governance
• Executive
|
Private Directorships:
• McAlister & McAlister
• President’s Advisory Board, Clemson University
|
Since 1975, Mr. McAlister has been a partner in the law firm of McAlister &McAlister in Laurens, South Carolina. Mr. McAlister is a director of a private charitable foundation and a member of the Clemson University – President’s Advisory Board.
Mr. McAlister contributes to our Board the skills and experience gained from his years of legal service to various businesses and corporations and as a litigator. As a founder of his firm, he has sophisticated legal experience and a reputation for resolving complex legal matters. Having served the Company as a director from nearly its inception, he is a repository of institutional knowledge and historical perspective and has been a key advisor to our management as we have grown from a start-up to a Fortune 500 company.
|
STEPHEN R. TRITCH
Age: 63
Director Since: April 2009
|
Board Committees:
• Nominating and Corporate Governance
|
Public Directorships:
• Koppers Holdings, Inc.
Private Directorships:
• PaR Systems
• Board of Trustees, University of Pittsburgh (Chair)
• Board of Trustees, Senator John Heinz History
Center, Pittsburgh, PA
• UPMC Health System
|
Mr. Tritch is the retired chairman of Westinghouse Electric Company (Westinghouse) and served in that capacity from July 1, 2008, to July 1, 2010. Westinghouse is a pioneering nuclear power company and a leading supplier of nuclear plant products and technologies to utilities throughout the world. From July 2002 to July 2008, Mr. Tritch served as president and chief executive officer of Westinghouse. Mr. Tritch had been employed by Westinghouse since 1971. Mr. Tritch was appointed in 2007 by then-President George W. Bush to the President’s Export Council. Mr. Tritch is also chairman of the board of trustees at the University of Pittsburgh; first vice chairman of the UPMC Health System; a member of the board of trustees for the Senator John Heinz History Center in Pittsburgh for which he previously served as chairman until July 2010; and a member of the board of directors of Koppers Holdings, Inc. (NYSE: KOP), a publicly-held company and a leading producer of carbon compounds and treated wood products, headquartered in Pittsburgh, Pennsylvania. He is also a member of the board of PaR Systems, a privately-held robotic systems supplier, headquartered in Minneapolis, Minnesota.
Mr. Tritch’s experience with Westinghouse makes him a valued member of our Board as the Company continues to grow in the nuclear power plant field. He brings a wealth of knowledge about the nuclear power industry and understanding of the unique issues involved in this complex and historically significant industry sector. Mr. Tritch’s broad experience with nuclear power technology companies and his insight into global electric power production complement the spectrum of experience on our Board.
INFORMATION ABOUT EXECUTIVE OFFICERS
The following provides information about our current executive officers. Each executive officer has been elected to serve until his successor is duly appointed or elected by our Board or his earlier removal or resignation from office.
|
J.M. BERNHARD, JR.
Age: 58
Shaw Employee Since: 1987
|
Company Positions:
• Chairman of the Board of Directors
• President and Chief Executive Officer
|
|
For biographical information on Mr. Bernhard, see “Information about Directors.”
|
GEORGE P. BEVAN
|
Company Position:
|
|
|
Age: 65
|
• President, Environmental & Infrastructure (E&I) Group
|
|
|
Shaw Employee Since: September 1994
|
||
Mr. Bevan joined us in September 1994 as Vice President of Business Development. He held that position until February 1996, when he was appointed Executive Vice President of Corporate Development. Mr. Bevan served as Executive Vice President of Corporate Development until September 2003, when he was appointed as our Vice President of Government Affairs and President of one of our subsidiaries. He served in those positions until April 2005 and then again from May 2006 through March 2007. From April 2005 through May 2006, Mr. Bevan worked for us as a consultant on Hurricane Katrina and Rita related matters while he was employed by the Sterling Group, a re-processor of PVC. In March 2007, Mr. Bevan was appointed President of the Infrastructure Division and then Commercial and State & Local Government (CSL) Division of our Environmental & Infrastructure Group. He served as CSL Division President until his June 2008 appointment as President of our Environmental & Infrastructure Group. More recently, Mr. Bevan has assumed additional responsibilities as lead for Shaw / CB&I transition team.
3
|
DAVID L. CHAPMAN, SR.
|
Company Position:
|
|
|
Age: 66
|
• President, Fabrication & Manufacturing (F&M) Group
|
|
|
Shaw Employee Since: April 2002
|
||
Mr. Chapman joined us in April 2002 as President of our Fabrication & Manufacturing Division, which is now known as the Fabrication & Manufacturing Group. Mr. Chapman has over 40 years of experience in the industrial fabrication business. From 1993 to 2002, Mr. Chapman was employed by Turner Industries Group, a large industrial contracting company, where he served as president of International Piping Systems, Turner International Piping Systems and International Painting Corporation.
|
JOHN DONOFRIO
|
Company Position:
|
|
|
Age: 51
|
• Executive Vice President, General Counsel and Corporate Secretary
|
|
|
Shaw Employee Since: October 2009
|
||
Mr. Donofrio joined us in October 2009. From 2005 to October 2009, Mr. Donofrio served as senior vice president, general counsel and chief compliance officer of Visteon Corporation, a leading global supplier of innovative products to automotive manufacturers. Previously, from 2000 to 2005, Mr. Donofrio was vice president and general counsel of Honeywell Aerospace, a global manufacturer of aerospace components and systems. Before joining Honeywell, he was a partner with the law firm of Kirkland & Ellis in Washington, D.C. and New York. Mr. Donofrio currently serves on the board of directors of FARO Technologies, Inc. (NASDAQ: FARO), a publicly-held leader in portable computer-aided measurement hardware and software headquartered in Lake Mary, Florida. Mr. Donofrio is also an adjunct professor of law at Louisiana State University, where he teaches Corporate Governance.
|
BRIAN K. FERRAIOLI
|
Company Position:
|
|
|
Age: 57
|
• Executive Vice President and Chief Financial Officer
|
|
|
Shaw Employee Since: July 2007
|
||
Mr. Ferraioli joined us in July 2007 as our Executive Vice President, Finance, and served in that position until October 2007, when he was appointed to his current position. Immediately prior to joining us and since November 2002, Mr. Ferraioli served as vice president and controller of Foster Wheeler AG. Prior to that, and until November 2002, Mr. Ferraioli served in various corporate and operating unit executive financial positions with Foster Wheeler AG and with its subsidiaries in the U.S. and Europe. Foster Wheeler is a diversified engineering and construction company and power equipment supplier. Mr. Ferraioli is also a member of the Dean’s Advisory Council at Louisiana State University’s E.J. Ourso College of Business, and he serves on the Energy Advisory Council to the Federal Reserve Bank of Atlanta.
|
ELI SMITH
|
Company Position:
|
|
|
Age: 60
|
• President, Power Group
|
|
|
Shaw Employee Since: May 2009
|
||
Mr. Smith joined us in May 2009, as Senior Vice President of procurement and contracts, and held this position until September 2010, when he was appointed President and Chief Operating Officer of the Power Group where he oversaw operations and project execution. On July 16, 2012, he was promoted to President of the Power Group, with the same operational and project execution responsibilities, plus additional general administrative and overhead functions. Before joining Shaw, Mr. Smith was the Principal vice president and corporate manager of contracts and procurement for Bechtel Corporation. From 1974 to 1996, he served in various senior management positions in the U.S. Army Corps of Engineers.
|
JAMES C. WILEMS
|
Company Position:
|
|
|
Age: 45
|
• Interim Vice President and Chief Accounting Officer
|
|
|
Shaw Employee Since: July 2011
|
||
Mr. Wilems joined the Company in 2011 as senior director, corporate accounting and served in that position until November 2012, when he was appointed to his current position. He is responsible for the financial accounting, accounting policy and external financial reporting for the Company.
Prior to joining the Company, he served as senior manager – international financial reporting standards/post-merger integration lead at Accenture PLC, a global management consulting, technology services and outsourcing firm in Atlanta, Georgia from 2010 to 2011. From 2003 to 2010, Mr. Wilems worked for BDO Seidman, LLP, a global public accounting firm in Atlanta, Georgia, where he served as assurance partner and audit and accounting director from 2005 to 2010. Mr. Wilems was also director of external reporting from 2001 to 2003 for ENSCO International, Inc., a multi-national, publicly held, oil and gas contract driller and as an assurance manager at Arthur Andersen, LLP from 1992 to 2000. Mr. Wilems graduated from the Center for Internal Auditing at Louisiana State University and is a member of the American Institute of Certified Public Accountants.
4
CODES OF CONDUCT
Our Board has formally adopted a Code of Corporate Conduct and an Insider Trading Policy, both of which apply to all of our employees, officers and directors. Our Board formally adopted a separate Code of Ethics for our Chief Executive Officer and Senior Financial Officers, which applies to our Chief Executive Officer, Chief Financial Officer, Chief Accounting Officer and all other senior financial and accounting executives. We intend to satisfy the disclosure requirement regarding any amendment to, or waiver of, a provision of the Code of Ethics for the Company’s Chief Executive Officer, Chief Financial Officer, Chief Accounting Officer and Controller, or persons performing similar functions, by posting such information on the Company’s website. There were no amendments to, or waivers of, any provision of the Code of Corporate Conduct or the Code of Ethics for the Company’s Chief Executive Officer, Chief Financial Officer, Chief Accounting Officer and Controller, or any persons performing similar functions during fiscal year 2012. Copies of these codes are available on our website at www.shawgrp.com on the “About Shaw” page under the “Corporate Governance” link.
SECTION 16(a) BENEFICIAL OWNERSHIP REPORTING COMPLIANCE
Section 16(a) of the Exchange Act requires our directors, executive officers and certain beneficial owners of more than 10% of our common stock to file with the SEC reports of ownership (Form 3) and changes in ownership (Forms 4 and 5) of our common stock. The reporting persons are required to furnish us with copies of all reports filed pursuant to Section 16(a).
Based solely upon review of the SEC reports and written representations to us from certain reporting persons, we believe that during fiscal year 2012, all applicable filing obligations under Section 16(a) have been met by all of the reporting persons.
AUDIT COMMITTEE
Our Board has certain standing committees, including our Audit Committee. Our Board, in its business judgment, has determined that our Audit Committee is comprised entirely of directors who satisfy the standards of independence established under the rules and regulations of the SEC, the NYSE listing standards and our Corporate Governance Principles. Messrs. Barker, Capps, Hoyle and Mancuso (chairman) are the members of our Audit Committee. Our Board has determined that each member of our Audit Committee has the requisite accounting and related financial management expertise under the NYSE listing standards. Additionally, our Board determined that Mr. Mancuso is qualified as an “audit committee financial expert” under the rules and regulations of the SEC.
ITEM 11. EXECUTIVE COMPENSATION
COMPENSATION DISCUSSION AND ANALYSIS
INTRODUCTION
This Compensation Discussion and Analysis (CD&A) explains how our Compensation Committee established goals, reviewed performance and decided compensation for our Named Executive Officers (NEOs) in fiscal year 2012. The NEOs for fiscal year 2012 were:
|
|
·
|
J.M. Bernhard, Jr., Chairman of the Board of Directors, President and Chief Executive Officer;
|
|
|
·
|
Brian K. Ferraioli, Executive Vice President and Chief Financial Officer;
|
|
|
·
|
David L. Chapman, Sr., President, Fabrication & Manufacturing Group;
|
|
|
·
|
George P. Bevan, President, Environmental & Infrastructure Group; and
|
|
|
·
|
Eli Smith, President, Power Group.
|
5
EXECUTIVE SUMMARY
We maintain several executive pay program design features and corporate governance practices to ensure a strong link between executive pay, Company performance and shareholder value based on the following, which are discussed in more detail in this CD&A:
Summary Highlights
|
•
|
Strong financial performance and creation of shareholder value exemplified by stock price increasing 81%, from $23.31 to $42.08 over fiscal year 2012.
|
|
•
|
Between 57% and 65% of our NEO’s total target compensation is performance based.
|
|
•
|
Annual cash incentives reflect pay-for-results philosophy, as evidenced by our Chief Executive Officer payout levels over the past three fiscal years at approximately 18% of target for fiscal year 2010, 0% of target for fiscal year 2011 and 200% of target for fiscal year 2012.
|
|
•
|
To further strengthen our pay for results philosophy, we implemented new performance-based long-term incentive awards based on how well our stock performs compared to our peers, more specifically, relative total shareholder return (TSR), which for fiscal year 2012 earned maximum performance levels of 200%.
|
|
•
|
Elimination of tax gross-up provisions from Chief Executive Officer and one other NEO’s employment agreements during the past two years.
|
|
•
|
Elimination of all guaranteed annual cash incentive payments for NEOs.
|
|
•
|
Compensation best practices include: a three year minimum vesting requirement, minimum stock ownership guidelines, limited Company-paid personal use of corporate aircraft (limited circumstances discussed below), compliance with a maximum share issuance burn rate commitment and a management incentive clawback policy
|
Pay For Results Philosophy
Between 57% and 65% of the NEOs’ annual target total compensation for fiscal year 2012 was performance-based, with the amount to be realized based on annual financial results (annual cash incentives) or multi-year stock price performance (long-term incentives).
|
|
·
|
Target Compensation. Target compensation levels are set higher than average, commensurate with the Company’s setting of aggressive Management Incentive Program (MIP) target goals and relative TSR goals in order to incentivize executives in ways that are in alignment with shareholders, and which also attracts and retains high-caliber, industry-leading executives.
|
|
|
·
|
Actual Compensation. Actual compensation levels are commensurate with actual Company and individual performance. In years where the Company’s performance failed to achieve targets, actual incentive compensation was reduced or eliminated. In fiscal year 2012, the Company’s performance exceeded targets, so actual compensation increased. The Company’s strong fiscal year 2012 earnings before interest expense, income taxes, depreciation and amortization (EBITDA) performance (increased 1,773% from fiscal year 2011, excluding the results from our investment in the Westinghouse segment) and the strong stock price appreciation (up 81% from August 31, 2011), resulted in increased levels of actual compensation for all of our NEOs (annual cash and long-term incentive compensation), reflecting our pay-for-results philosophy, at levels ranging from 100-200% of respective targets. For additional disclosure related to our fiscal year 2012 EBITDA, including a reconciliation of our Generally Accepted Accounting Principles (GAAP) results to our non-GAAP results, please see “EXECUTIVE COMPENSATION – Non-GAAP Financial Measure” below.
|
2012 Pay Outcomes Were Commensurate with 2012 Performance
Fiscal year 2012 annual cash incentive compensation and long-term performance cash incentive compensation were commensurate with the Company’s fiscal year 2012 financial, operational and stock performance, reflecting the Company’s “pay-for-results” philosophy as described below:
The Company’s exceptional performance for fiscal year 2012 was realized in part due to the leadership and vision of our NEOs and their fiscal year 2012 compensation levels are commensurate with Company performance.
6
|
|
·
|
Above Target Annual Cash Incentive Compensation Earned.
|
The Company’s fiscal year 2012 performance exceeded financial and operational target goals and significantly improved from fiscal year 2011, which resulted in earned annual cash incentive awards for our NEOs, at various levels based on business unit and individual performance, ranging from 100% to 200% of target.
For fiscal year 2012, the Company’s consolidated financial results, excluding the results from our investment in the Westinghouse segment, were $314.6 million for EBITDA and $148.8 million for operating cash flow. These exceeded our target goals with achievement levels of 105% and 127%, respectively. The EBITDA results represented a significant improvement (1,773%) from prior year’s EBITDA loss of $18.8 million.
Also in fiscal year 2012, the Company accomplished several key strategic initiatives and operational achievements, as summarized below, which culminated in the agreement to be acquired by CB&I at a premium of 72% over the closing price for the last trading day prior to announcement (for further discussion please see our current report on Form 8-K filed with the SEC on July 30, 2012):
|
|
–
|
Successfully completed the divestiture of substantially all of the business within the Energy & Chemicals (E&C) business unit which resulted in cash proceeds of $290 million;
|
|
|
–
|
exercised the put options of our subsidiary NEH to sell its investment in the Westinghouse Group to Toshiba;
|
|
|
–
|
increased amounts of construction activities related to our Power business unit’s EPC contracts on four nuclear power reactors in the United States after our clients obtained the combined operating licenses (COLs) from the NRC;
|
|
|
–
|
generated record earnings for third straight year within our Plant Service’s business unit, which continues to perform at what we believe is an industry leading level;
|
|
|
–
|
expanded and improved profitability for our pipe fabrication facilities within our F&M business unit;
|
|
|
–
|
executed a share buyback program via a $150 million Dutch auction tender offer; and
|
|
|
–
|
developed a company-wide process improvement initiative.
|
|
|
·
|
Long-Term Incentive Compensation Tied to Stock Performance.
|
As of August 31, 2012, our stock had appreciated 81% from the August 31, 2011 closing price and our fiscal year 2012 relative TSR was 72.63%, which exceeded our maximum performance goal of 25% relative TSR; therefore, our NEOs earned 200% of target PCUs.
To further our pay-for-results philosophy, our executive officers participated in a new long-term incentive award program under our 2008 Omnibus Incentive Plan, as amended (the “Omnibus Plan”) in fiscal year 2012. This was awarded in the form of performance cash units (PCUs), the payout of which is based on the performance measure of TSR. The PCUs were awarded in addition to restricted stock units (RSUs) that vest over the next three years, providing ongoing alignment with shareholders based on the Company’s future stock price performance. TSR performance for fiscal year 2012 increased by 85.49%. Thus, our executives, like our shareholders, have been rewarded by our stock’s exceptional performance as follows:
|
|
–
|
Actual relative TSR performance of 72.63% as compared to median TSR of PCU Peer Group far exceeded the maximum goal of 25%; therefore, maximum payout of 200% was earned for the first 25% of target PCUs awarded to our executives in fiscal year 2012.
|
Compensation Best Practices
Over the past two years, the Compensation Committee, in conjunction with executive management, has performed a detailed annual assessment of the key elements of our executive compensation program. As a result of these assessments, the Company has continued to strengthen our executive compensation practices to ensure a strong link between executive pay, Company performance, and shareholder value. The Committee and the Board have adopted Executive Compensation Guidelines (the Guidelines) memorializing several of these practices, some of which are highlighted below. See “Incentive Compensation and Other Programs” for additional details regarding implementation of PCUs, the payout of which is based on the performance measure of TSR, and “Benefits and Other Compensation – Employment Agreements” for additional details regarding amendment to Chief Executive Officer’s employment agreement.
7
We have proactively changed or eliminated pay practices that were viewed negatively by shareholders and institutional advisory firms such as ISS and Glass Lewis.
|
Compensation Best Practice
|
Fiscal Year Implemented
|
|
Three-Year Minimum Vesting Requirements for LTI awards
|
2010
|
|
Minimum Stock Ownership Guidelines as a Multiple of Base Salary (6x Chief Executive Officer, 2.5x and 1.5x for Other Executive Officers)
|
2010
|
|
No Future Guaranteed Management Incentive Program (MIP) Payments for Executive Officers
|
2010
|
|
Limited Company-Paid Personal Use of Corporate Aircraft (exceptions for employee relocation and Chief Executive Officer safety only)
|
2010
|
|
No New Excise Tax Gross-Up Provisions
|
2010
|
|
Maximum Share Issuance Burn Rate Commitment (1.95% per year for fiscal years 2011-2013)
|
2011
|
|
Addition of Management Incentive Clawback Policy
|
2011
|
|
Amendment of Mr. Chapman’s Employment Agreement (Removed Excise Tax Gross-Up and Guaranteed MIP)
|
2011
|
|
Amendment of Chief Executive Officer’s Employment Agreement (Eliminated Tax Gross-Up and Clarified Terms of the Deferred Compensation/SERP Award)
|
2012
|
|
Implementation of PCUs, the Payout of Which Is Based on the Performance Measure of TSR and Elimination of Stock Options
|
2012
|
In the latter part of fiscal year 2011 and first quarter of fiscal year 2012, a detailed assessment of the contractual obligations contained in our executive employment agreements was performed by the Compensation Committee, in conjunction with executive management and our compensation consultant, Pay Governance, LLC. As a result of these assessments, the Company implemented the following changes to our Chief Executive Officer’s employment agreement on December 12, 2011.
|
|
·
|
Eliminated Tax Gross-Up in Chief Executive Officer’s Employment Agreement. The Company removed a tax gross-up provision which would have been applicable if any payment or benefit in connection with a change in control would have constituted an “excess parachute payment” under 280G of the Internal Revenue Code, and replaced it with a “net best” provision.
|
|
|
·
|
Clarification of Chief Executive Officer’s Deferred Compensation Award. The Company converted a $15 million, plus accumulated interest, deferred compensation award that was owed to Mr. Bernhard to a Supplemental Executive Retirement Plan (SERP) to make it clear that this award is a retirement benefit. There were no changes in the economics or timing of payments as part of this conversion; however, the conversion to a SERP is fully compliant with Section 409A of the Internal Revenue Code and eliminates prior misconceptions associated with the language in his employment agreement regarding the deferred compensation award and non-compete provision. Mr. Bernhard’s SERP is near the market median for company-provided retirement benefits for long-service chief executive officers, including founders, of similarly-sized companies.
|
COMPENSATION PHILOSOPHY, OBJECTIVES, PLANS AND PROGRAMS
The Company’s executive compensation philosophy is designed to:
|
|
·
|
Maximize shareholder value by recruiting, incentivizing and retaining top executive leadership with the skills to enable the Company to achieve our long- and short-term business goals, thus aligning the interests of our executives with those of our shareholders; and
|
|
|
·
|
Provide a balanced mix of base salary, annual cash incentives and long-term equity incentives, emphasizing performance-based compensation that generally targets to provide actual compensation that is consistent with our performance and is between the 50th and 75th percentile of our Market Peer Group (as defined below),.
|
8
The elements of our compensation program help us to realize our compensation philosophy and objectives:
|
|
·
|
Base Salary. Base salary provides a competitive and stable component of income to our executives, as a majority of their total compensation is variable from year to year.
|
|
|
·
|
Annual Cash Incentive Compensation under the MIP. This program provides competitively based short-term incentive opportunities for our executives to earn annual cash awards for achieving financial, operational and strategic benchmarks that are established by the Compensation Committee each fiscal year. See “Incentive Compensation and Other Programs” for additional details regarding goal setting and determination of MIP awards.
|
|
|
·
|
Long-Term Incentive Compensation. Long-term incentive compensation ensures that our executives’ interests are aligned with those of our shareholders. During fiscal year 2012, the Company further strengthened the “pay-for-results” component of our long-term incentive compensation program by implementing PCUs, the payout of which is based on TSR as the performance measure. For further discussion, see “Incentive Compensation and Other Programs” below.
|
|
|
·
|
Benefits and Other Compensation. Our benefit and other compensation programs comprise a minimal portion of our NEOs total annual compensation and all programs offered, including perquisites, are in line with standard market practices.
|
See “Compensation Discussion of Our Named Executive Officers” for additional information regarding the elements of compensation of our NEOs.
ROLE OF COMPENSATION COMMITTEE
Our Board has delegated to the Compensation Committee the primary responsibility for overseeing our executive compensation program. In performing this duty, the Compensation Committee takes the following actions in the first quarter of each fiscal year regarding the actual performance for the most recently completed fiscal year and recommendations for the newly begun fiscal year:
Approval of Total Compensation for our Named Executive Officers and Other Key Executives. The Compensation Committee reviews and discusses a schedule for each executive, which includes:
|
|
·
|
Analysis of compensation elements: base salary, target and actual annual cash incentive compensation, long-term incentive compensation and total target and actual compensation;
|
|
|
·
|
Comparative compensation analysis for each compensation element showing actual, target and market amounts for the most recently completed fiscal year and target recommendations compared to market for the newly began fiscal year;
|
|
|
·
|
Competitive market information for the prior and current fiscal year are provided at the 50th and 75th percentiles for our Market Peer Group (as defined below);
|
|
|
·
|
A summary of the annual performance of the executive, which were assessed and rated on a standard scale; and
|
|
|
·
|
A summary of any one-time compensation recommended for approval, if applicable.
|
Approval and Administration of Annual Incentive Programs and of Performance Goals. The Compensation Committee discusses, determines and approves the following annual cash and long-term incentive compensation goals and awards, after consideration of, among other things, management’s recommendation, the prior fiscal year’s goals and actual performance and the current fiscal year’s goals and alignment with Company and shareholder interests:
|
|
·
|
Annual cash incentive awards, which includes:
|
|
|
–
|
Achievement of the prior fiscal year’s financial and operational performance goals;
|
|
|
–
|
Pool of MIP funds for business units;
|
|
|
–
|
Total awards under MIP (including individual amounts for our NEOs as discussed above); and
|
|
|
–
|
Financial and operational performance goals for the new fiscal year that will serve as the benchmarks for the annual cash incentive compensation under MIP.
|
9
|
|
·
|
Long-term incentive awards, which includes:
|
|
|
–
|
Appropriate mix of long-term incentive components to ensure achievement of our compensation objectives;
|
|
|
–
|
Achievement of performance measure under PCU awards, and the resulting earned PCU awards;
|
|
|
–
|
Establishment of performance measure and peer group for the new fiscal year’s target PCU awards; and
|
|
|
–
|
Ensuring compliance with our available share pool and annual burn rate commitment.
|
Assessment of Compensation Risk. The Compensation Committee also reviews and discusses with management the compensation risk analysis conducted to determine whether the Company has any compensation programs that are reasonably likely to have a material adverse affect on the Company. During fiscal year 2012, a detailed analysis was performed by Human Resources and Internal Audit where each compensation element and program was categorized and then analyzed for potential risk on a scale of low, moderate and high for the following: (i) program design and metrics; (ii) compensation mix and time horizon; (iii) compensation process around design, award determination, and payouts; (iv) compensation program governance and oversight; and (v) mitigating controls. At the conclusion of our assessment, we determined that our compensation elements and programs have an appropriate mix of: (i) short-term compensation: annual base salary and cash incentives that have a pay-for-results program design, which includes an annual employee performance evaluation process before consideration of base salary merit increases, and set metrics for our cash incentive programs that include earnings and cash flow at both the consolidated and business unit levels in addition to discretionary factors such as safety performance, legal, and regulatory compliance as examples; (ii) long-term compensation: equity, cash and non-qualified deferred compensation, including the newly implemented PCU program, and all support retention of key talent; and (iii) benefits that are offered at appropriate levels. Therefore, we have concluded that the Company does not have any compensation programs that are reasonably likely to have a material adverse affect on the Company.
ROLE OF EXECUTIVE OFFICERS IN THE COMPENSATION PROCESS
Annually, the Chief Executive Officer and Senior Vice President of Human Resources make a compensation recommendation to the Compensation Committee for certain key executives, including each of the other NEOs. Their compensation recommendation is based on a review of the competitive market assessment for our executive officers, individual performance for each executive officer and the overall performance of the Company and business unit, if applicable. The compensation recommendation for the Chief Executive Officer is prepared by the Senior Vice President of Human Resources and is based on the competitive market assessment and the overall performance of the Company. (For discussion on the competitive market assessment, see “Executive Compensation Comparative Analysis” below.) These recommendations are the basis of discussion with the Compensation Committee; however, the Compensation Committee has final decision-making authority and approves the executive compensation program and the level of equity, cash, or incentive compensation to be awarded.
Meetings of the Compensation Committee discussing compensation strategies, program design and corporate governance matters are generally attended by the Chief Executive Officer, Chief Financial Officer, General Counsel, the Senior Vice President of Human Resources, and, when requested by the Committee, the Committee’s compensation consultant. At the October 16, 2012 Compensation Committee meeting, the Committee approved for our executive officers, including our NEOs: (i) fiscal year 2012 performance-based award payout levels for MIP and the first 25% of the fiscal year 2012 PCU award, as earned per the terms of the award; and (ii) fiscal year 2013 target compensation, which included base salary and target levels for MIP and LTI awards.
ROLE OF COMPENSATION CONSULTANT
Annually, the Compensation Committee engages an independent third-party consultant to provide advice on the design, administration and monitoring of the Company’s executive compensation programs. The compensation consultant provides data and recommendations for compensation programs that are compliant with applicable regulations, performance driven, cost effective and aligned with our overall compensation philosophy. Specifically, the compensation consultant provides guidance to our Compensation Committee on competitive compensation benchmarking and annual performance results compared to our Market Peer Group (as defined below). For further discussion of these processes, see “Executive Compensation Comparative Analysis” below.
During fiscal year 2012, the Compensation Committee directly engaged Pay Governance for executive compensation advisory services, including but not limited to, executive compensation comparative analysis discussed below. Pay Governance has not provided, and will not provide in the future, other services to the Company.
10
EXECUTIVE COMPENSATION COMPARATIVE ANALYSIS
Comparative Analysis
As part of its executive compensation advisory role, Pay Governance provided a competitive market assessment of our executive compensation programs for fiscal year 2012. The assessment: (i) provided an overview of the competitiveness of our executive compensation program; (ii) measured the value of each pay component relative to the market; and (iii) developed a framework for executive compensation planning and decisions. Since there were insufficient direct peers participating in the survey, Pay Governance developed a survey comparator group for benchmarking target compensation levels based on companies in manufacturing and similar industries as the Company with annual revenues of at least $2 billion (and median revenues near the Company). The resulting survey comparator group consists of 38 similarly-sized companies ($6.4 billion median revenue) specializing in engineering, construction, environmental services and manufacturing industries (Market Peer Group). Pay Governance obtained the information for the Market Peer Group from the 2011 Towers Watson General Industry Executive Compensation Database.
The results of this year’s target compensation benchmarking were generally consistent with last year and, as discussed below, confirmed that the Company was achieving its target compensation goal of regular annual compensation generally ranging between the market 50th and 75th percentiles.
After reviewing Pay Governance’s recommendations, the Committee determined that the Market Peer Group is the appropriate comparator group, even though we may not be compared to or compete directly with some of these companies for talent or client contracts. The companies in this group are similarly-sized in our general industry, and executive management in these companies possess similar qualifications to our executive officers.
|
Market Peer Group
|
|
|
AMETEK
|
Jacobs Engineering
|
|
Ball
|
KBR
|
|
Bemis
|
MeadWestvaco
|
|
Bovis Lend Lease
|
Owens Corning
|
|
Bucyrus International
|
Owens-Illinois
|
|
Cameron International
|
Parket Hannifin
|
|
Caterpillar
|
Parsons
|
|
Cooper Industries
|
Regal-Benoit
|
|
Corning
|
Rockwell International
|
|
Eaton
|
Sealed Air
|
|
Fluor
|
Snap-on
|
|
Fortune Brands
|
Sonoco Products
|
|
Greif
|
SPX
|
|
Grupo Ferrovial
|
Terex
|
|
HD Supply
|
Textron
|
|
Holcim
|
Thomas & Betts
|
|
Illinois Tool Works
|
3M
|
|
Ingersoll-Rand
|
Timken
|
|
ITT – Corporate
|
USG
|
Although the elements of the compensation paid to executive officers vary among the companies in the Market Peer Group, we recognize that we deliver a relatively larger portion of compensation in cash than do our Market Peer Group companies. The primary reason for this is that we have limited shares available to make equity grants and are thus focused on managing our share burn rate. In addition, our Chief Executive Officer already maintains a large equity stake in the Company, thus the Compensation Committee allocates a relatively larger portion of target compensation to our annual cash incentive plan than do some of our Market Peer Group companies. The Compensation Committee applies this approach consistently across other executive positions. For these reasons, our performance-based cash component of total compensation is disproportionate relative to the overall Market Peer Group. See “Compensation Discussion of our Named Executive Officers” for further information regarding each NEO’s target and actual total compensation for 2012.
11
COMPENSATION DISCUSSION OF OUR NAMED EXECUTIVE OFFICERS
Fiscal Year 2012 Target Total Compensation for our Named Executive Officers
The Compensation Committee generally targets total NEO compensation to range between the 50th and 75th percentiles of our Market Peer Group. Actual executive compensation depends on the actual performance of the Company and the individual. The Compensation Committee believes that setting challenging targets, will encourage executives to perform their best.
The tables and discussion provided below for each NEO reflect the compensation elements and corresponding target and earned actual compensation amounts as reviewed and approved by the Compensation Committee. While the majority of these amounts can easily be compared to the amounts reflected in the Summary Compensation Table, the PCU amounts differ. As is required to comply with SEC regulations, the amounts reflected in the “Stock Awards” column of the Summary Compensation Table represent the total grant date fair value, calculated using a Monte Carlo simulation model, of PCUs awarded during fiscal year 2012. In contrast, the CD&A tables below report the target values of the PCUs on the grant date. These differences result in the actual compensation reported in the CD&A tables below being higher than the compensation reported in the Summary Compensation Table. See “INCENTIVE COMPENSATION AND OTHER PROGRAMS – Fiscal Year 2012 Performance Results” for additional information regarding the measurement period and payout calculation of PCUs.
As discussed in “INCENTIVE COMPENSATION AND OTHER PROGRAMS - Long-Term Incentive Compensation,” the core PCU program is designed to be a three-year performance period with earned awards paid at the end of the three years. To address the negative financial impact to the executive from our transition to PCUs from previous stock option awards, which were four-year service based vesting of 25% per year, three Relative TSR performance periods began in fiscal year 2012, which include the one-time supplemental transition award. Only the first performance period ended on August 31, 2012 and therefore, is reflected in actual compensation below. The remaining two performance periods will be reflected as actual compensation in the fiscal year such periods end, which are August 31, 2013 and 2014.
As discussed in “EXECUTIVE SUMMARY” and in more detail below, the Company and business units exceeded financial, stock and operational targets for fiscal year which resulted in maximum incentive awards for most of our NEOs.
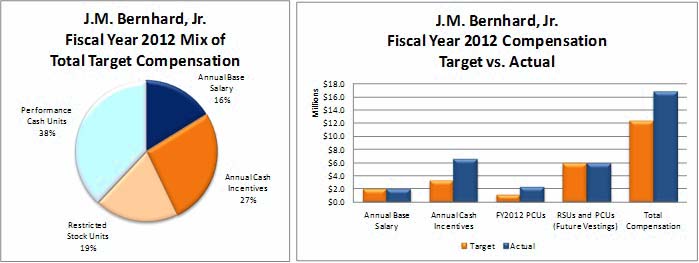
J.M. Bernhard, Jr.
Leadership and Performance Highlights. Since 1987, through Mr. Bernhard’s vision and leadership as founder, Chief Executive Officer, President and Chairman of the Board, the Company has grown from a local industrial pipe fabrication and manufacturing business to a Fortune 500 company that is among the premier engineering and construction companies in the world.
|
|
·
|
Since 2005, under his leadership and guidance through strategic acquisitions and business ventures, our revenues increased from $3.3 billion to $6.0 billion and we have expanded our workforce from 19,000 to 25,000 globally.
|
|
|
·
|
Over the past five years, Mr. Bernhard has strengthened our leadership team and profitability by promoting and bringing in top talent to complete our corporate executive management team with individuals who have deep industry experience and are visionary leaders in their respective areas of responsibility. Mr. Bernhard equally focused on operations by compiling a team of presidents for each of our business units, again through promoting and or hiring top talent from our competitors, whose main focus is best in class project execution and increasing profitability.
|
|
|
·
|
In fiscal year 2012, Mr. Bernhard assumed operational leadership after the retirement of former our Chief Operating Officer, and successfully negotiated the agreement to be acquired by CB&I at a premium of 72% over the closing price for the last trading day prior to announcement (for further discussion please see our current report on Form 8-K filed with the SEC on July 30, 2012). He also led several key strategic initiatives, such as: (i) initiated the process for exercising the “put” options of our subsidiary NEH to sell its investment in the Westinghouse Group back to Toshiba; (ii) negotiated and oversaw the divestiture of substantially all of the assets of the E&C business unit for approximately $290 million in cash proceeds; (iii) devised and oversaw the execution of a share buyback program via a $150 million Dutch auction tender offer; (iv) drove the Company to meet or exceed all key fiscal year 2012 financial targets; (v) served as primary thought leader for resolving complex legal settlements; and (vi) developed and kicked off company-wide process improvement initiative.
|
Fiscal Year 2012 Compensation Summary.
|
|
·
|
Mr. Bernhard’s base salary and annual incentive targets remained unchanged from the prior fiscal year, but his long term incentive targets increased due to the implementation of the new performance based LTI awards (PCUs), for which he received a one-time supplemental transition grant for a target of $2,350,000 in addition to normal annual LTI target levels. The core PCU program is designed to be a three-year performance period with earned awards paid at the end of the three years. To address the negative financial impact to the executive from our transition to PCUs from previous stock option awards, which incrementally vested over a four-year service period, three Relative TSR performance periods began in fiscal year 2012, which include the one-time supplemental transition award. Mr. Bernhard’s target total compensation for fiscal year 2012 was $12,350,000, which increased from his fiscal year 2011 target of $10,000,000.
|
12
|
|
·
|
For fiscal year 2012, Mr. Bernhard’s performance based target compensation totaled $8,000,000 (or 65%) of total target compensation. As discussed above, Mr. Bernhard provided outstanding operational and strategic leadership throughout fiscal year 2012, which resulted in strong financial performance, especially as compared to prior years, and record stock performance for fiscal year 2012. As a result, the Compensation Committee approved an annual cash incentive payout at 200% of target for Mr. Bernhard and the earned maximum payout level of 200% for the first 25% of the PCU award per the terms of the award. See “INCENTIVE COMPENSATION AND OTHER PROGRAMS – Annual Cash Incentive Compensation” and “-Long-Term Incentive Compensation” below.
|
|
Elements of Compensation
|
Fiscal Year
2012 Target
Compensation
|
Fiscal Year
2012 Actual
Compensation
|
Actual Market
Position (1)
|
||||||
|
Annual Base Salary
|
$ | 2,000,000 | $ | 2,000,000 |
Above 75th
|
||||
|
Incentive Compensation (vested in 2012):
|
|||||||||
|
Annual Cash Incentive Compensation
|
$ | 3,300,000 | $ | 6,600,000 | (2) |
Above 75th
|
|||
|
Performance Cash Units
(FY2012 Performance Period)
|
$ | 1,175,000 | $ | 2,350,000 | (2) |
Below 50th
|
|||
|
Compensation Subtotal
|
$ | 6,475,000 | $ | 10,950,000 | |||||
|
Incentive Compensation (future vesting):
|
|||||||||
|
Restricted Stock Units
(Vestings FY2013, FY2014, and FY2015)
|
$ | 2,350,000 | (3) | $ | 2,350,000 | (3) |
Below 50th
|
||
|
Performance Cash Units
(FY2013 & FY2014 Performance Periods)
|
$ | 3,525,000 | (4) | $ | 3,525,000 | (4) |
Below 50th
|
||
|
Total Compensation, Excluding Other Compensation (5)
|
$ | 12,350,000 | $ | 16,825,000 |
Above 75th
|
||||
|
|
(1)
|
Market Position of Market Peer Group for Chief Executive Officer for companies with median revenues of $6.4 billion; compensation components are shown on the chart to indicate placement against market position for Fiscal Year 2012 Actual Compensation.
|
|
|
(2)
|
For further discussion of annual cash incentive compensation and earned PCU compensation, please see “INCENTIVE COMPENSATION AND OTHER PROGRAMS” below.
|
|
|
(3)
|
Amount represents the value of equity at the time of award by the Compensation Committee, which have a three-year service based vesting of 33% per year.
|
|
|
(4)
|
Two additional PCU measurement periods began in fiscal year 2012 that are shown at target levels until the end of the performance period ends and earned PCUs are calculated. The first with a $1,175,000 target and a 2-year measurement period ending on August 31, 2013 and the second with a $2,350,000 target and a 3-year measurement period ending on August 31, 2014.
|
|
|
(5)
|
Total compensation excludes all other compensation reflected in the “Summary Compensation Table for the Fiscal Years Ended August 31, 2012, 2011 and 2010” below.
|
13
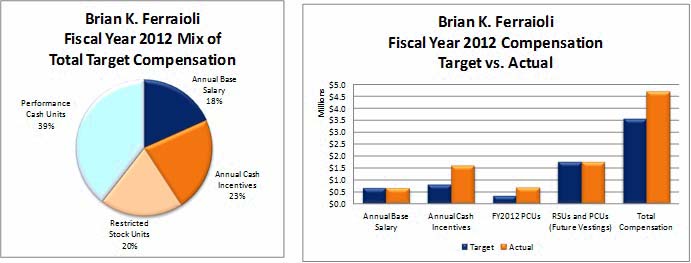
Brian K. Ferraioli
Leadership and Performance Highlights.
|
|
·
|
Mr. Ferraioli joined us in July 2007 as our Executive Vice President, Finance, and served in that position until October 2007, when he was appointed to his current position. Over the last five years, Mr. Ferraioli has made numerous strategic personnel and policy changes within our organization to enable our continued growth and success. More recently, under his leadership: (i) we have amended our credit facility for lender commitments up to $1.45 billion; (ii) we have increased our restricted and unrestricted cash and cash equivalents, escrowed cash and restricted and unrestricted short-term investment balance from $0.9 billion at August 31, 2008 to $1.4 billion at August 31, 2012, and repeatedly generated strong operating cash flows; and (iii) Standards & Poor’s increased the Company’s credit rating to an investment grade of BBB- with a stable outlook.
|
|
|
·
|
In fiscal year 2012, Mr. Ferraioli provided proactive financial leadership at both corporate and business unit level ensuring the Company met or exceeded all key financial targets. He served as key advisor to our Chief Executive Officer on numerous strategic business decisions, which culminated in the agreement to be acquired by CB&I at a premium of 72% over the closing price for last trading day prior to announcement (for further discussion please see our current report on Form 8-K filed with the SEC on July 30, 2012), such as: (i) exercised the put options of our subsidiary NEH to sell its investment in the Westinghouse Group back to Toshiba; (ii) successfully completed the divestiture of substantially all of the assets of the E&C business unit for approximately $290 million in cash proceeds; (iii) executed a share buyback program via a $150 million Dutch auction tender offer; and (iv) resolved complex legal settlements. Mr. Ferraioli continued to strengthen our financial and accounting function through the following actions in fiscal year 2012: (i) ensured shareholders and investors understood the numerous complex transactions; (ii) successfully recruited a Chief Accounting Officer with high potential talent and a strong public accounting background; and (iii) supported a significant investment and upgrade in our enterprise resource planning (ERP) system.
|
Fiscal Year 2012 Compensation Summary.
|
|
·
|
Mr. Ferraioli’s base salary and annual incentive targets remained unchanged from the prior fiscal year, but his long term incentive targets increased due to the implementation of the new performance based LTI awards (PCUs), for which he received a one-time supplemental transition grant for a target of $700,000 in addition to normal annual LTI target levels. The core PCU program is designed to be a three-year performance period with earned awards paid at the end of the three years. To address the negative financial impact to the executive from our transition to PCUs from previous stock option awards, which incrementally vested over a four-year service period, three Relative TSR performance periods began in fiscal year 2012, which include the one-time supplemental transition award. Mr. Ferraioli’s target total compensation for fiscal year 2012 was $3,550,000, which increased from his fiscal year 2011 target of $2,850,000.
|
|
|
·
|
For fiscal year 2012, Mr. Ferraioli’s performance based target compensation totaled $2,200,000 (or 62%) of total target compensation. As discussed above Mr. Ferraioli provided outstanding operational and strategic leadership throughout fiscal year 2012 which resulted in strong financial performance, especially as compared to prior years, and record stock performance for fiscal year 2012. As a result, the Compensation Committee approved an annual cash incentive payout at 200% of target for Mr. Ferraioli and the earned maximum payout level of 200% for the first 25% of the PCU award per the terms of the award. See “INCENTIVE COMPENSATION AND OTHER PROGRAMS – Annual Cash Incentive Compensation” and “-Long-Term Incentive Compensation” below.
|
|
|
·
|
Additionally, in light of the significant strategic initiatives underway, in October 2011, the Chief Executive Officer recommended, and the Compensation Committee approved, a $1 million non-qualified deferred compensation award, with a two-year cliff vesting period, to be given to Mr. Ferraioli in order to better ensure his retention with the Company.
|
14
|
Elements of Compensation
|
Fiscal Year
2012 Target
Compensation
|
Fiscal Year
2012 Actual
Compensation
|
Actual Market
Position (1)
|
||||||
|
Annual Base Salary
|
$ | 650,000 | $ | 650,000 |
Above 75th
|
||||
|
Incentive Compensation (vested in 2012):
|
|||||||||
|
Annual Cash Incentive Compensation
|
$ | 800,000 | $ | 1,600,000 | (2) |
Above 75th
|
|||
|
Performance Cash Units
(FY2012 Performance Period)
|
$ | 350,000 | $ | 700,000 | (2) |
50th to 75th
|
|||
|
Compensation Subtotal
|
$ | 1,800,000 | $ | 2,950,000 | |||||
|
Incentive Compensation (future vesting):
|
|||||||||
|
Restricted Stock Units
(Vestings FY2013, FY2014, and FY2015)
|
$ | 700,000 | (3) | $ | 700,000 | (3) |
50th to 75th
|
||
|
Performance Cash Units
(FY2013 & FY2014 Performance Periods)
|
$ | 1,050,000 | (4) | $ | 1,050,000 | (4) |
50th to 75th
|
||
|
Total Compensation, Excluding Other Compensation (5)
|
$ | 3,550,000 | $ | 4,700,000 |
Above 75th
|
||||
|
|
(1)
|
Market Position of Market Peer Group for Chief Financial Officer for companies with median revenues of $6.4 billion; compensation components are shown on the chart to indicate placement against market position for Fiscal Year 2012 Actual Compensation.
|
|
|
(2)
|
For further discussion of annual cash incentive compensation and earned PCU compensation, please see “INCENTIVE COMPENSATION AND OTHER PROGRAMS” below.
|
|
|
(3)
|
Amount represents the value of equity at the time of award by the Compensation Committee, which have a three-year service based vesting of 33% per year.
|
|
|
(4)
|
Two additional PCU measurement periods began in fiscal year 2012 that are shown at target levels until the end of the performance period ends and earned PCUs are calculated. The first with a $350,000 target and a 2-year measurement period ending on August 31, 2013 and the second with a $700,000 target and a 3-year measurement period ending on August 31, 2014.
|
|
|
(5)
|
Total compensation excludes all other compensation reflected in the “Summary Compensation Table for the Fiscal Years Ended August 31, 2012, 2011 and 2010” below.
|
David L. Chapman, Sr.
Leadership and Performance Highlights.
|
|
·
|
Mr. Chapman joined us in April 2002 as President of our Fabrication & Manufacturing Division, which is now known as the Fabrication & Manufacturing Group. Under Mr. Chapman’s leadership for the past decade, Fabrication & Manufacturing consistently provides our highest operating profit margins as compared to our other business units. Under his leadership, we have expanded our fabrication and manufacturing operations into Mexico, the United Arab Emirates and Brazil through a joint venture and started operations on our nuclear modular facility in Lake Charles, Louisiana. Mr. Chapman’s industry expertise and leadership has enabled the Fabrication & Manufacturing business unit to consistently achieve one of our highest levels of business unit operating profit margins and puts him at high risk for recruitment by competitors. Accordingly, our Compensation Committee deems these levels appropriate and key to his retention.
|
|
|
·
|
In fiscal year 2012, Mr. Chapman led the F&M business unit to a record year of induction bending orders, increased sales and earnings for pipe fabrication facilities, and opened a new pipe fabrication facility in Abu Dhabi. Under Mr. Chapman’s leadership his business unit responded to an emergency request from one client and fabricated over 1,800 spools in just over three months which resulted in greatly improved profitability. Additionally, he was able to book additional business to mitigate a backlog shortfall when a significant phase for one of their larger projects was cancelled.
|
Fiscal Year 2012 Compensation Summary.
|
|
·
|
Mr. Chapman’s base salary and annual incentive targets remained unchanged from the prior fiscal year, but his long term incentive targets increased due to the implementation of the new performance based LTI awards (PCUs), for which he received a one-time supplemental transition grant for a target of $600,000 in addition to normal annual LTI target levels. The core PCU program is designed to be a three-year performance period with earned awards paid at the end of the three years. To address the negative financial impact to the executive from our transition to PCUs from previous stock option awards, which incrementally vested over a four-year service period, three Relative TSR performance periods began in fiscal year 2012, which include the one-time supplemental transition award. Mr. Chapman’s target total compensation for fiscal year 2012 was $3,550,000, which increased from his fiscal year 2011 target of $2,950,000.
|
|
|
·
|
For fiscal year 2012, Mr. Chapman’s performance based target compensation totaled $2,200,000 (or 62%) of total target compensation. As discussed above Mr. Chapman provided outstanding operational and strategic leadership throughout fiscal year 2012 which resulted in strong financial performance, especially as compared to prior years, and record stock performance for fiscal year 2012. As a result, the Compensation Committee approved an annual cash incentive payout at 100% of target for Mr. Chapman and the earned maximum payout level of 200% for the first 25% of the PCU award per the terms of the award. See “INCENTIVE COMPENSATION AND OTHER PROGRAMS – Annual Cash Incentive Compensation” and “-Long-Term Incentive Compensation” below.
|
15
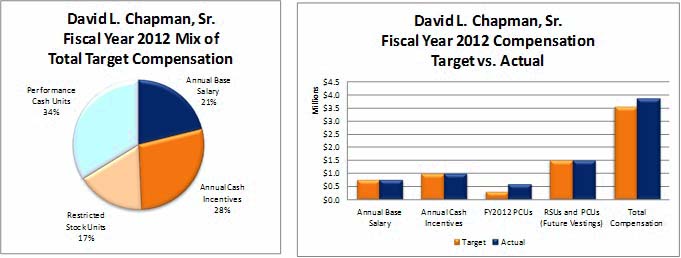
|
Elements of Compensation
|
Fiscal Year
2012 Target
Compensation
|
Fiscal Year
2012 Actual
Compensation
|
Actual Market
Position (1)
|
||||||
|
Annual Base Salary
|
$ | 750,000 | $ | 750,000 |
Above 75th
|
||||
|
Incentive Compensation (vested in 2012):
|
|||||||||
|
Annual Cash Incentive Compensation
|
$ | 1,000,000 | $ | 1,000,000 | (2) |
Above 75th
|
|||
|
Performance Cash Units
(FY2012 Performance Period)
|
$ | 300,000 | $ | 600,000 | (2) |
50th to 75th
|
|||
|
Compensation Subtotal
|
$ | 2,050,000 | $ | 2,350,000 | |||||
|
Incentive Compensation (future vesting):
|
|||||||||
|
Restricted Stock Units
(Vestings FY2013, FY2014, and FY2015)
|
$ | 600,000 | (3) | $ | 600,000 | (3) |
50th to 75th
|
||
|
Performance Cash Units
(FY2013 & FY2014 Performance Periods)
|
$ | 900,000 | (4) | $ | 900,000 | (4) |
50th to 75th
|
||
|
Total Compensation, Excluding Other Compensation (5)
|
$ | 3,550,000 | $ | 3,850,000 |
Above 75th
|
||||
|
|
(1)
|
Market Position of Market Peer Group for president of a business unit with revenues of $400 million; compensation components are shown on the chart to indicate placement against market position for Fiscal Year 2012 Actual Compensation.
|
|
|
(2)
|
For further discussion of annual cash incentive compensation and earned PCU compensation, please see “INCENTIVE COMPENSATION AND OTHER PROGRAMS” below.
|
|
|
(3)
|
Amount represents the value of equity at the time of award by the Compensation Committee, which have a three-year service based vesting of 33% per year.
|
|
|
(4)
|
Two additional PCU measurement periods began in fiscal year 2012 that are shown at target levels until the end of the performance period ends and earned PCUs are calculated. The first with a $300,000 target and a 2-year measurement period ending on August 31, 2013 and the second with a $600,000 target and a 3-year measurement period ending on August 31, 2014.
|
|
|
(5)
|
Total compensation excludes all other compensation reflected in the “Summary Compensation Table for the Fiscal Years Ended August 31, 2012, 2011 and 2010” below.
|
George P. Bevan
Leadership and Performance Highlights.
|
|
·
|
Mr. Bevan joined us in September 1994 as Vice President of Business Development. He held that position until February 1996, when he was appointed Executive Vice President of Corporate Development. Mr. Bevan served as Executive Vice President of Corporate Development until September 2003, when he was appointed as our Vice President of Government Affairs and President of one of our subsidiaries. He served in those positions until April 2005 and then again from May 2006 through March 2007. From April 2005 through May 2006, Mr. Bevan worked for us as a consultant on hurricane Katrina and Rita related matters while he was employed by the Sterling group, a re-processor of PVC. In March 2007, Mr. Bevan was appointed President of the Infrastructure Division and then Commercial and State & Local Government (CSL) Division of our Environmental & Infrastructure Group. He served as CSL Division President until his June 2008 appointment as President of our Environmental & Infrastructure Group.
|
|
|
·
|
In fiscal year 2012, Mr. Bevan led the E&I business unit to achieve strong financial earnings, cash flow and backlog. More specifically, under his leadership, E&I completed and achieved all financial incentives for the largest design and build contract ever let by the United States Core of Army Engineers, which is also the largest storm surge barrier in the world. E&I’s largest and longest running nuclear waste clean-up project, MOX, exceeded over 12 million safety hours without a lost work day, which is the most ever by a Department of Energy contractor and Mr. Bevan was instrumental in negotiating over $350 million of baseline change orders for the MOX project.
|
16
Fiscal Year 2012 Compensation Summary.
|
|
·
|
Mr. Bevan’s base salary and annual incentive targets remained unchanged from the prior fiscal year, but his long term incentive targets increased due to the implementation of the new performance based LTI awards (PCUs), for which he received a one-time supplemental transition grant for a target of $600,000 in addition to normal annual LTI target levels. The core PCU program is designed to be a three-year performance period with earned awards paid at the end of the three years. To address the negative financial impact to the executive from our transition to PCUs from previous stock option awards, which incrementally vested over a four-year service period, three Relative TSR performance periods began in fiscal year 2012, which include the one-time supplemental transition award. Mr. Bevan’s target total compensation for fiscal year 2012 was $2,505,000,which increased from his fiscal year 2011 target of $1,955,000.
|
|
|
·
|
For fiscal year 2012, Mr. Bevan’s performance based target compensation totaled $1,465,000 (or 58%) of total target compensation. As discussed above Mr. Bevan provided outstanding operational and strategic leadership throughout fiscal year 2012 which resulted in strong financial performance, especially as compared to prior years, and record stock performance for fiscal year 2012. As a result, the Compensation Committee approved an annual cash incentive payout of 150% of target for Mr. Bevan and the earned maximum payout level of 200% for the first 25% of the PCU award per the terms of the award. See “INCENTIVE COMPENSATION AND OTHER PROGRAMS – Annual Cash Incentive Compensation” and “-Long-Term Incentive Compensation” below.
|
|
|
·
|
Additionally, in light of the significant achievements underway, in October 2011, the Chief Executive Officer recommended, and the Compensation Committee approved, a $750,000 non-qualified deferred compensation award, with a two-year cliff vesting period, to be given to Mr. Bevan in order to better ensure his retention with the Company.
|

|
Elements of Compensation
|
Fiscal Year
2012 Target
Compensation
|
Fiscal Year
2012 Actual
Compensation
|
Actual Market
Position (1)
|
||||||
|
Annual Base Salary
|
$ | 615,000 | $ | 615,000 |
At 75th
|
||||
|
Incentive Compensation (vested in 2012):
|
|||||||||
|
Annual Cash Incentive Compensation
|
$ | 615,000 | $ | 922,500 | (2) |
Above 75th
|
|||
|
Performance Cash Units
(FY2012 Performance Period)
|
$ | 212,500 | $ | 425,000 | (2) |
Below 50th
|
|||
|
Compensation Subtotal
|
$ | 1,442,500 | $ | 1,962,500 | |||||
|
Incentive Compensation (future vesting):
|
|||||||||
|
Restricted Stock Units
(Vestings FY2013, FY2014, and FY2015)
|
$ | 425,000 | (3) | $ | 425,000 | (3) |
Below 50th
|
||
|
Performance Cash Units
(FY2013 & FY2014 Performance Periods)
|
$ | 637,500 | (4) | $ | 637,500 | (4) |
Below 50th
|
||
|
Total Compensation, Excluding Other Compensation (5)
|
$ | 2,505,000 | $ | 3,025,000 | (6) |
Above 75th
|
|||
|
|
(1)
|
Market Position of Market Peer Group for president of a business unit with revenues of $2 billion; compensation components are shown on the chart to indicate placement against market position for Fiscal Year 2012 Actual Compensation.
|
|
|
(2)
|
For further discussion of annual cash incentive compensation and earned PCU compensation, please see “INCENTIVE COMPENSATION AND OTHER PROGRAMS” below.
|
|
|
(3)
|
Amount represents the value of equity at the time of award by the Compensation Committee, which have a three-year service based vesting of 33% per year.
|
|
|
(4)
|
Two additional PCU measurement periods began in fiscal year 2012 that are shown at target levels until the end of the performance period ends and earned PCUs are calculated. The first with a $212,500 target and a 2-year measurement periods ending on August 31, 2013 and the second with a $425,000 target and a 3-year measurement period ending on August 31, 2014.
|
|
|
(5)
|
Total compensation excludes all other compensation reflected in the “Summary Compensation Table for the Fiscal Years Ended August 31, 2012, 2011 and 2010” below.
|
|
|
(6)
|
Excluding the one-time supplemental transition grant of PCUs, Mr. Bevan’s fiscal year 2012 actual total compensation would have been between the 50th and 75th percentiles of market and in line with our compensation philosophy.
|
17
Eli Smith
Leadership and Performance Highlights.
|
|
·
|
Mr. Smith joined us in May 2009 as Senior Vice President and Manager of Procurement and Contracts with the Power Group and was responsible for all aspects of procurement, contracts, and subcontracts for all divisions of the Power Group. Mr. Smith was recruited because of his industry experience, unique qualifications and focus on project execution.
|
|
|
·
|
In August 2010, Mr. Smith was promoted to President and Chief Operating Officer of Power Group where he oversaw operations and project execution for Shaw’s Nuclear Division, Fossil Division and Plant Services Division. On July 16, 2012, Mr. Smith was promoted to President of Power Group with same operational and project execution responsibility as before plus additional responsibilities for general running of Power Group and overhead functions, essentially continuing his then-current duties plus those of the former President of the Power Group.
|
|
|
·
|
During fiscal year 2012, Mr. Smith led the Power Group in the following operational initiatives: (i) focusing on safety, (ii) strengthening oversight on project and overhead costs, and (iii) providing transparency and efficiencies through enhancing tools and systems. These operational initiatives resulted in the successful completion of a number of large projects either at or above plan and the achievement of a project performance bonus at approximately $15 million above plan level. Additionally, Mr. Smith played a pivotal role in the successful resolution of significant claims on a large fixed-price project and its conversion to reimbursable, which resulted in an increase of profits by approximately $30 million.
|
Fiscal Year 2012 Compensation Summary.
|
|
·
|
Mr. Smith’s target total compensation for fiscal year 2012 was $2,184,541, which increased from his fiscal year 2011 target of $1,600,000. Fiscal year 2012 total target compensation of $2,184,541 reflects “earned” base salary and annual cash incentive compensation levels and actual long-term incentive compensation awarded in October 2011 as follows:
|
|
|
–
|
In October 2011, which is when fiscal year 2012 compensation levels were approved for our executives, Mr. Smith (as then President and Chief Operating Officer of Power Group) was awarded an increase of 15% to his total target compensation, which included base salary increase from $525,000 to $605,000. Incentive compensation targets of 100% for annual cash incentives and 105% for long-term incentives did not change; however, their respective target dollar amounts increased in conjunction with the base salary increase.
|
|
|
–
|
In July 2012, Mr. Smith was promoted to President of Power Group and was awarded an increase in compensation of 24%. The Committee determined that this increase was: (i) appropriate in consideration of his increased responsibilities, (ii) in line with our compensation philosophy to target total compensation between market 50th and 75th; and (iii) consistent with compensation of internal peers with similar responsibilities. Mr. Smith’s base salary increased to $750,000. Incentive compensation targets of 100% for annual cash incentives and 105% for long-term incentives did not change; however, their respective target dollar amounts increased in conjunction with the base salary increase.
|
|
|
·
|
As was the case for the rest of our NEOs, Mr. Smith’s fiscal year 2012 long term incentive target awards increased due to the implementation of the new performance based LTI awards (PCUs), for which he received a supplemental transition grant for a target of $317,625 in addition to annual LTI target levels. The core PCU awards are designed to be a three-year performance period with earned awards paid at the end of the three years. To address the negative financial impact to the executive from our transition to PCUs from previous stock option awards, which incrementally vested over a four-year service period, three Relative TSR performance periods began in fiscal year 2012, which include the one-time supplemental transition award.
|
|
|
·
|
For fiscal year 2012, Mr. Smith’s performance based target compensation totaled $1,251,083 (or 57%) of total target compensation. As discussed above Mr. Smith provided outstanding operational and strategic leadership throughout fiscal year 2012 which resulted in strong financial performance, especially as compared to prior years, and record stock performance for fiscal year 2012. As a result, the Compensation Committee approved an annual cash incentive payout of 195% of target for Mr. Smith and the earned maximum payout level of 200% for the first 25% of the PCU award per the terms of the award. See “INCENTIVE COMPENSATION AND OTHER PROGRAMS – Annual Cash Incentive Compensation” and “-Long-Term Incentive Compensation” below.
|
|
|
·
|
Additionally, in light of the significant achievements underway, in October 2011, the Chief Executive Officer recommended, and the Compensation Committee approved, a $750,000 non-qualified deferred compensation award, with a two-year cliff vesting period, to be given to Mr. Smith in order to better ensure his retention with the Company.
|
18
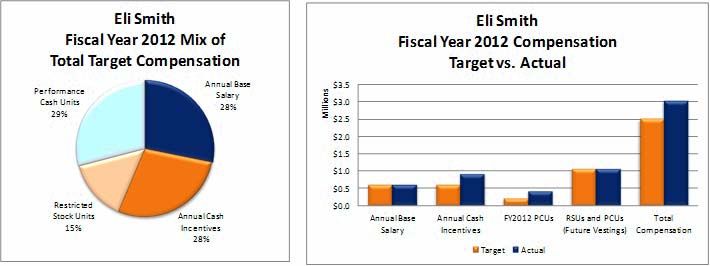
|
Elements of Compensation
|
Fiscal Year
2012 Target
Compensation
|
Fiscal Year
2012 Actual
Compensation
|
Actual Market
Position (1)
|
||||||
|
Annual Base Salary
|
$ | 615,833 | (6) | $ | 615,833 | (6) |
Above 75th
|
||
|
Incentive Compensation (vested in 2012):
|
|||||||||
|
Annual Cash Incentive Compensation
|
$ | 615,833 | $ | 1,200,000 | (2) |
Above 75th
|
|||
|
Performance Cash Units
(FY2012 Performance Period)
|
$ | 158,812 | $ | 317,624 | (2) |
50th to 75th
|
|||
|
Compensation Subtotal
|
$ | 1,390,478 | $ | 2,133,457 | |||||
|
Incentive Compensation (future vesting):
|
|||||||||
|
Restricted Stock Units
(Vestings FY2013, FY2014, and FY2015)
|
$ | 317,625 | (3) | $ | 317,625 | (3) |
50th to 75th
|
||
|
Performance Cash Units
(FY2013 & FY2014 Performance Periods)
|
$ | 476,438 | (4) | $ | 476,438 | (4) |
50th to 75th
|
||
|
Total Compensation, Excluding Other Compensation (5)
|
$ | 2,184,541 | $ | 2,927,520 | (7) |
Above 75th
|
|||
|
|
(1)
|
Market Position of Market Peer Group for president of a business unit with revenues of $2 billion; compensation components are shown on the chart to indicate placement against market position for Fiscal Year 2012 Actual Compensation.
|
|
|
(2)
|
For further discussion of annual cash incentive compensation and earned PCU compensation, please see “INCENTIVE COMPENSATION AND OTHER PROGRAMS” below.
|
|
|
(3)
|
Amount represents the value of equity at the time of award by the Compensation Committee, which have a three-year service based vesting of 33% per year.
|
|
|
(4)
|
Two additional PCU measurement periods began in fiscal year 2012 that are shown at target levels until the end of the performance period ends and earned PCUs are calculated. The first with a $158,813 target and a 2-year measurement periods ending on August 31, 2013 and the second with a $317,625 target and a 3-year measurement period ending on August 31, 2014.
|
|
|
(5)
|
Total compensation excludes all other compensation reflected in the “Summary Compensation Table for the Fiscal Years Ended August 31, 2012, 2011 and 2010” below.
|
|
|
(6)
|
Target and actual annual base salary for fiscal year 2012 reflects two base salary changes, as follows: from $525,000 at beginning of fiscal year to $605,000 in October 2011 and additional increase to $750,000 in July 2012 in conjunction with his promotion to President of Power Group.
|
|
|
(7)
|
Excluding the one-time supplemental transition grant of PCUs, Mr. Smith’s fiscal year 2012 actual total compensation would have been between the 50th and 75th percentiles of market and in line with our compensation philosophy.
|
19
INCENTIVE COMPENSATION AND OTHER PROGRAMS
Our incentive compensation programs are designed as a “plan within a plan” in order to preserve the deductibility under Section 162(m) of the Internal Revenue Code, while giving the Compensation Committee the flexibility to tailor awards to reflect financial, operational and individual achievements based on subjective as well as objective criteria. The “outer layer” component of the incentive compensation programs is entirely objective. The Compensation Committee approves a specific incentive compensation “funding trigger,” or threshold level of performance that makes these incentives entirely at risk. For fiscal year 2012, the funding triggers ( the 162(m) performance goals) were $55 million in operating income and positive operating cash flows for the fiscal year, as reflected by our audited consolidated financial results, and both of these performance goals were achieved with fiscal year 2012 results of $234.9 million in operating income and $129.8 million in operating cash flows, resulting in a 162(m) funding pool of $55 million for our incentive compensation programs. The Compensation Committee approves the performance goals and objectives for the “inner layer” components of our incentive compensation programs and these are described in further detail below. All incentive compensation for our executives were achieved per their respective “inner layer” performance goals and objectives and the aggregate payout levels remain under the 162(m) funding pool of $55 million.
Annual Cash Incentive Compensation
Our NEOs’ annual cash incentive compensation opportunity is provided through our Management Incentive Program (MIP), which is operated under the Omnibus Plan. The MIP is a performance-based annual award that can be earned for the achievement of “inner layer” specific financial goals and variable operational and strategic performance factors.
|
|
·
|
MIP Performance-Based Objectives. At the beginning of fiscal year 2012, the Compensation Committee determined that incentive compensation should be based on criteria that would further the Company’s long- and short-term business strategies and thus developed two primary components having equal weight: (i) target financial performance goals, and (ii) evaluation of several variable performance factors aligned with increasing shareholder value.
|
|
|
–
|
Target Financial Performance Goals (50% of the MIP award opportunity). The fiscal year 2012 financial performance goals were based on (i) EBITDA, (ii) operating cash flow for our business units, and (iii) the Company’s consolidated results. Target and actual results, for both our consolidated EBITDA and consolidated operating cash flow, exclude the results from our investment in the Westinghouse segment because the results of that segment are subject to significant non-cash and non-operating foreign exchange translation fluctuations. Additionally, the Compensation Committee has the ability to make adjustments to both target and actual results as deemed necessary for one-time significant items that may occur during the fiscal year.
|
|
|
–
|
Variable Performance Factors (50% of the MIP award opportunity). These variable performance factors are not given a specific weighting or score and not all of the listed metrics apply to all of the eligible participants of our MIP. The selection and achievement of the variable performance factors applicable to the NEOs are based upon an evaluation by the Compensation Committee of various operational and strategic performance factors that are aligned with increasing shareholder value, including: year-over-year performance of business units and our consolidated financial results; magnitude of business unit contribution to consolidated results; individual performance; environmental, health and safety performance; legal and regulatory compliance; ethics; organizational development; earnings growth; new awards; revenue; effective cost management; attraction, retention and development of high potential employees; compliance with our internal Sarbanes Oxley program and other relevant factors as recommended by our Chief Executive Officer, Chief Financial Officer, or Senior Vice President of Human Resources.
|
|
|
·
|
Weighting of MIP Performance-Based Objectives.
|
|
Weighting of Performance Goals and Factors (1)
|
||||||||||||||||||||||||
|
Named Executive Officers
|
Shaw
Consolidated |
Shaw
Consolidated |
Business
Unit |
Business
Unit |
Variable
Performance |
Total
Performance |
||||||||||||||||||
|
J. M. Bernhard, Jr.
|
40 | % | 10 | % | -- | -- | 50 | % | 100 | % | ||||||||||||||
|
Brian K. Ferraioli
|
40 | % | 10 | % | -- | -- | 50 | % | 100 | % | ||||||||||||||
|
David L. Chapman, Sr.
|
20 | % | 5 | % | 20 | % | 5 | % | 50 | % | 100 | % | ||||||||||||
|
George P. Bevan
|
20 | % | 5 | % | 20 | % | 5 | % | 50 | % | 100 | % | ||||||||||||
|
Eli Smith
|
20 | % | 5 | % | 20 | % | 5 | % | 50 | % | 100 | % | ||||||||||||
|
|
(1)
|
Weighting of MIP Performance-Based Objectives is illustrated above for all business units that apply to our NEOs. Each NEO is responsible for and performance is based on their respective business unit. See “Fiscal Year 2012 Performance Results” for further discussion.
|
20
|
|
·
|
Individual MIP Target. Eligible employees, including our NEOs, have a MIP target award opportunity expressed as a percentage of earned annual base salary (prorated for mid-year hires and mid-year base salary changes). For our NEOs, the Compensation Committee sets these target percentages at the beginning of the fiscal year based upon market information, internal equity considerations and the executive’s ability to assist the Company and its subsidiaries in achieving or exceeding the financial, operational and strategic goals. The below table presents the MIP targets for our NEOs:
|
|
Named Executive Officer
|
MIP Target Percentage
|
MIP Target Amount
|
|
J.M. Bernhard, Jr.
|
165%
|
$3,300,000
|
|
Brian K. Ferraioli
|
123%
|
$800,000
|
|
David L. Chapman, Sr.
|
133%
|
$1,000,000
|
|
George P. Bevan
|
100%
|
$615,000
|
|
Eli Smith
|
100%
|
$615,833 (1)
|
|
|
(1)
|
Mr. Smith’s fiscal year 2012 MIP target amount is prorated for mid-year base salary changes as discussed in “COMPENSATION DISCUSSION OF OUR NAMED EXECUTIVE OFFICERS “ above.
|
|
|
·
|
MIP Payout Calculation. The financial goals and variable performance factors are calculated independently and in total provide a pool of MIP funds for each business unit. Eligible employees, including our NEOs, are eligible for a potential MIP award opportunity of up to 200% of their respective individual targets and individual award levels vary based on individual performance.
|
The Compensation Committee reviews the Company and business unit results against the performance-based objectives. This review is are generally based on preliminary results, due to the timing of our annual Compensation Committee meeting and the subsequent filing of our Form 10-K, and in some instances includes adjustments for items to ensure consistency in the accounting treatment of actual and target metrics or other unusual items as recommended by our Chief Executive Officer and Chief Financial Officer. Please see “Fiscal Year 2012 Performance Results” below for detailed discussion of fiscal year 2012 performance. Our Chief Executive Officer, in consultation with our Chief Financial Officer, recommends MIP percentages for Shaw Consolidated and each business unit. As previously described, the Compensation Committee has the sole authority to approve or to modify any proposed MIP award within the potential payout range of 0-200% of an individual’s MIP target and existing contractual obligations, provided the total MIP payouts are within the calculated pool of MIP funds and within 162(m) maximum levels for our executive officers. See “Role of Compensation Committee” for further discussion. The allocation of the pool of MIP funds to the eligible employees further links MIP payout levels with our pay-for-results philosophy.
|
|
·
|
Fiscal Year 2012 Performance Results. For fiscal year 2012, the Company’s assessment of MIP performance results was as follows:
|
|
|
–
|
Target Financial Performance Goals (50% of the MIP award opportunity). As provided for in the MIP design, and approved by the Compensation Committee, the fiscal year 2012 performance results, which exclude the results from our investment in the Westinghouse segment, included positive EBITDA adjustments of $23.7 million for an unexpected ruling on a motion for a partial summary judgment in a litigation matter and for transaction costs associated with the sale of substantially all the assets of E&C. There were no adjustments made to operating cash flow results.
|
The Compensation Committee met on October 16, 2012 to review our preliminary fiscal year 2012 performance results, that consisted of adjusted EBITDA of $340.0 million (calculated as the sum of our preliminary EBITDA results of $316.3 million, plus the $23.7 million of approved positive adjustments discussed above) and preliminary operating cash flows of $153.9 million. These preliminary results exceeded our aggressive targets of $328.8 million for EBITDA and $121.2 million for operating cash flows.
The final fiscal year 2012 performance results, as reported in the Company’s Form 10-K for the fiscal year ended August 31, 2012, consisted of adjusted EBITDA of $338.3 million (calculated as the sum of our final EBITDA results of $314.6 million, plus the $23.7 million of approved positive adjustments discussed above) and final operating cash flows of $148.8 million. The final adjusted EBITDA results and final unadjusted operating cash flow results continued to exceed our target goals.
|
|
–
|
Variable Performance Factors (50% of the MIP award opportunity). In addition to the exceptional stock performance which had appreciated by 81% from the August 31, 2011 closing price, the final EBITDA results of $314.6 million represented a significant improvement (1,773%) from prior year’s EBITDA loss of $18.8 million. These items were considered, in addition to various other items as described above, as part of the Compensation Committee’s assessment of variable performance factors and achievement levels.
|
On October 16, 2012, the Compensation Committee reviewed and approved the pool of MIP funds for the respective business units as follows: 155% for Corporate (consolidated financial results, excluding Westinghouse), 97% for F&M Group, 102% for E&I Group, and 107% for Power Group. As discussed in more detail at “COMPENSATION DISCUSSION OF OUR NAMED EXECUTIVE OFFICERS,” our NEOs each provided exceptional strategic and operational leadership for fiscal year 2012 and accordingly the Compensation Committee approved the following MIP awards for our NEOs:
|
Named Executive Officer
|
MIP Award as Percentage of Target
|
MIP Award Amount
|
|
J.M. Bernhard, Jr.
|
200%
|
$6,600,000
|
|
Brian K. Ferraioli
|
200%
|
$1,600,000
|
|
David L. Chapman, Sr.
|
100%
|
$1,000,000
|
|
George P. Bevan
|
150%
|
$922,500
|
|
Eli Smith
|
195%
|
$1,200,000
|
21
Our pay-for-results philosophy is evidenced by our Chief Executive Officer’s payout levels for the past three years, as follows:
|
J.M. Bernhard, Jr.
Chief Executive Officer
|
Historical MIP Awards as
Percentage of Target
|
|
|
Fiscal Year 2010
|
17.6 | % |
|
Fiscal Year 2011
|
0 | % |
|
Fiscal Year 2012
|
200 | % |
Long-Term Incentive Compensation
Long-term incentive (LTI) awards are granted under our Omnibus Plan, and are typically granted at the same time as decisions relating to salary increases and annual cash incentive compensation awards, which is generally within the first 60 days of each fiscal year. This is concurrent with the release of our financial results and the completion of the audit of our financial statements for the preceding fiscal year. The Compensation Committee may also approve grants of long-term incentive awards to NEOs and other managerial employees at other times during the year due to special circumstances, such as new hires or promotions. We do not back date or re-price options, and if our stock price declines after the grant date, we do not replace options. We also do not seek to time equity grants to take advantage of material information about the Company, either positive or negative, that has not been publicly disclosed. For fiscal year 2012, the Committee granted LTI awards in the form of PCUs and RSUs, as further described below.
|
|
·
|
Individual LTI Target. Eligible employees, including our NEOs, have a LTI targets expressed as a percentage of annual base salary. The Compensation Committee sets these target percentages at the beginning of the fiscal year based upon market information, internal equity considerations and the executive’s ability to assist the Company and its shareholders by increasing future stock price performance. The below table presents the fiscal year 2012 LTI targets awards for our NEOs, which is inclusive of the annual PCUs and RSUs, plus the transition PCUs:
|
|
Fiscal Year 2012 LTI Target
|
||||||||||||
|
Named Executive Officer
|
LTI Target Percentage (2)
|
PCU Target Amount (1)
|
RSU Target Amount
|
|||||||||
|
J.M. Bernhard, Jr.
|
235 | % | $ | 4,700,000 | $ | 2,350,000 | ||||||
|
Brian K. Ferraioli
|
215 | % | $ | 1,400,000 | $ | 700,000 | ||||||
|
David L. Chapman, Sr.
|
160 | % | $ | 1,200,000 | $ | 600,000 | ||||||
|
George P. Bevan
|
138 | % | $ | 850,000 | $ | 425,000 | ||||||
|
Eli Smith
|
103 | % | $ | 635,250 | $ | 317,625 | ||||||
|
|
(1)
|
PCU Target Amount is inclusive of both the annual and transition PCUs (for further discussion see “LTI Vesting and Performance Periods” below). It is anticipated that in future years, the grant mix will be an equal weighting of RSUs and PCUs.
|
|
|
(2)
|
LTI Target Percentage represents the annual target percentage approved by the Compensation Committee and does not include the transition PCUs.
|
|
|
·
|
LTI Compensation Tied to Stock Performance. As previously described, in addition to RSUs, which are subject to the “outer layer” 162(m) performance threshold, we have further emphasized performance-based pay and compliance with our burn rate commitment by replacing stock options with PCUs for our LTI program.
|
The core measure of performance for PCU awards is TSR, calculated as the change in stock price from the beginning to the end of a specified measurement period, including dividend distributions assuming these are reinvested in common stock. As a way to smooth out any stock reactions that may take place in the market at beginning or end of our performance period(s), our PCU program design uses the average closing price for the 20 trading days prior to the beginning and end of each performance or measurement period in our TSR calculation.
We have further emphasized performance by using relative TSR as the “inner layer” performance measure for our PCU awards. Relative TSR aligns our shareholders’ interests, given that TSR is a direct measure of the Company’s stock performance, but more importantly it measures how the Company is performing relative to our industry sector. Within our industry sector, we have identified eight engineering, procurement, construction and installation companies, collectively referred to as the “PCU Peer Group”, with whom we internally compare ourselves and whom analysts who track Shaw’s performance also monitor.
22
|
PCU Peer Group
|
|
Chicago Bridge & Iron Co.
|
|
Fluor Corporation
|
|
Foster Wheeler AG
|
|
Jacobs Engineering Group Inc.
|
|
KBR Inc.
|
|
The Babcock & Wilcox Company
|
|
Tetra Tech Inc
|
|
URS Corporation
|
Additionally, it is these companies we continually compete with for talent. This list differs from the Market Peer Group that we use for competitive compensation benchmarking purposes, which is discussed in “Executive Compensation Comparative Analysis” above.
|
|
·
|
LTI Vesting and Performance Periods. Fiscal year 2012 LTI awards vest over the next three years. Annual RSUs incrementally vest over a three-year service period and represent 50% of each NEO’s annual target LTI. Annual PCUs vest at the end of a three-year performance period, and also represent 50% of each NEO’s annual target LTI. Beginning in fiscal year 2012, PCUs were issued as a replacement for the previous practice of awarding stock options, which incrementally vested over a four-year service period. In modeling the impact of the transition, it was identified that our NEOs would experience gaps of vesting, which would result in a negative financial impact. To address this transition, the Committee approved a one-time, supplemental PCU award of 50% of each NEO’s annual target LTI, which vests at the end of the one year and two year performance periods. The table below includes the vesting schedule and performance cycles for the fiscal year 2012 PCU grant. The first two performance cycles listed are related to the supplemental PCU award. The final cycle is related to the annual award.
|
|
Performance Cycle
|
Performance Cycle
End Date
|
Percentage of
Target Award that
can be Earned
|
|
Fiscal Year 2012
|
8/31/12
|
25%
|
|
Fiscal Year 2012 - 2013
|
8/31/13
|
25%
|
|
Fiscal Year 2012 - 2014
|
8/31/14
|
50%
|
|
|
·
|
Earned PCU Calculation. The relative TSR performance is calculated as follows:
|
The ultimate payout is based on the executive’s PCU target award and the Company’s TSR relative to the median TSR of the PCU Peer Group and then compared against the pre-established Relative TSR metrics, which include a threshold target and maximum for which the executive can earn between 0% and 200% of his individual target award depending on the level of performance achieved. Linear interpolation is used when Relative TSR is between threshold, target and maximum to determine the corresponding percentage of target award earned.
|
Relative TSR Performance
|
Percentage of Target Award Earned
|
|
|
Maximum
|
+25% or Above
|
200%
|
|
Target
|
0%
|
100%
|
|
Threshold
|
-25%
|
50%
|
|
Below Threshold
|
-25% or Below
|
0%
|
Additionally, the PCU program provides for two additional performance measures that, if occur, would set a threshold or maximum earned PCUs as described below:
|
|
–
|
At the end of the performance period, if during any 20 consecutive trading-day period during the Performance Period the Company’s actual closing stock price on each day during the 20 day period is at least 50% greater than the Company’s average actual closing price over the 20 trading days ending on the day before the first day of the Performance Period, then the number of earned PCUs should be at least target award.
|
|
|
–
|
At the end of the performance period, if the Company’s three-year average annual TSR is negative, the number of earned PCUs amount cannot exceed target award.
|
23
The Compensation Committee certifies the relative TSR achievement, described above, and approves the individual PCU awards for our executive officers, including our NEOs.
|
Performance Cycle
|
Performance Cycle
End Date (1)
|
Percentage of
Target Award that
can be Earned
|
|
Fiscal Year 2012
|
8/31/12
|
25%
|
|
Fiscal Year 2012 - 2013
|
8/31/13
|
25%
|
|
Fiscal Year 2012 - 2014
|
8/31/14
|
50%
|
|
|
(1)
|
Earned awards are paid within 60 days following the completion of the fiscal year.
|
|
|
·
|
Fiscal Year 2012 Performance Results. Management calculated and the Compensation Committee certified the below performance results.
|
For fiscal year 2012, Shaw’s TSR was +85.49% and the PCU Peer Group median TSR was +12.86% which resulted in a Relative TSR of +72.63%. This far exceeded the +25% maximum and therefore each executive earned 200% (of the 25%) for this measurement period (see each NEOs actual PCU award for fiscal year 2012 in “COMPENSATION DISCUSSION OF OUR NAMED EXECUTIVE OFFICERS”).
Stock Ownership Guidelines
Since January 1, 2010, our executives and non-employee directors are expected to maintain a certain minimum level of stock ownership. They have up to five years to meet the expected ownership levels. We determine the value of stock holdings for purposes of these guidelines based on the value as measured at the time the stock-based award was granted, including stock options and restricted stock, whether vested or unvested. The stock-based ownership guidelines are summarized in the table below.
|
Named Executive Officer
|
Stock Ownership Guidelines (2)
|
Meets Criteria (1)
|
|
J.M. Bernhard, Jr.
|
6 x Annual Salary
|
ü
|
|
Brian K. Ferraioli
|
2.5 x Annual Salary
|
ü
|
|
David L. Chapman, Sr.
|
2.5 x Annual Salary
|
ü
|
|
George P. Bevan
|
2.5 x Annual Salary
|
ü
|
|
Eli Smith
|
2.5 x Annual Salary
|
ü
|
|
|
(1)
|
As of August 31, 2012.
|
|
|
(2)
|
Stock ownership guideline for executive officers who are not direct reports of the Chief Executive Officer is 1.5x their annual salary.
|
BENEFITS AND OTHER COMPENSATION
Below are descriptions of the other benefits received by our NEOs. These benefits are either generally available to all employees, or were set at the time of hire and are outlined in each NEO’s respective employment agreements.
Retirement Programs. We maintain our 401(k) Plan, which is a tax-qualified, defined contribution retirement plan available to all eligible employees (including our NEOs). The plan offers a voluntary pre-tax and Roth after-tax salary deferral feature under Sections 401(k) and 402A of the Internal Revenue Code. The value of Company-paid matching contributions to our NEOs under our 401(k) Plan is set forth in the “Summary Compensation Table for the Fiscal Years Ended August 31, 2012, 2011 and 2010” under the “All Other Compensation” column and related notes.
24
Deferred Compensation Arrangements. The Shaw Group Inc. Deferred Compensation Plan (the Deferred Compensation Plan) is a non-qualified deferred compensation plan for a select group of key employees designed to assist our employees in receiving a portion of their cash compensation in a tax efficient manner. This plan promotes retention because our employees must remain with the Company for a fixed period of time in order to receive any employer contributions.
In October 2011, the Chief Executive Officer recommended, and the Compensation Committee approved, non-qualified deferred compensation awards for three of our NEOs. The details of those awards are as follows:
|
|
·
|
Mr. Ferraioli received an award for $1 million with a two-year cliff vesting period. This award was given to him in order to better ensure his retention with the Company based on his increased focus on project execution and fiscal responsibility coupled with his Shaw-specific and overall industry experience which should lead our financial organization to best-in-class levels.
|
|
|
·
|
Mr. Bevan received an award for $750,000 with a two-year cliff vesting period. This award was given to him in order to better ensure his retention with the Company based on his Shaw-specific and overall industry experience to lead our E&I Group to best-in-class levels by moving focus from the successful completion of the hurricane protection project for the USACE to identifying a strong pipeline of work, including expanding the E&I business into mining and coastal restoration within the Commercial, State and Local Division, and establish Federal Division as an industry leader with the DOE & DOD.
|
|
|
·
|
Mr. Smith received an award for $750,000 with a two-year cliff vesting period. This award was given to him in order to better ensure his retention with the Company through the leadership transition from his then role of Chief Operating Officer & President of the Power Group to his now current role as President of the Power Group, which occurred in July 2012. His succession to President of the Power Group is based on his strong procurement and contract background, which makes him especially poised to manage the complex nuclear contracts.
|
On December 12, 2011, the Company converted a $15 million, plus accumulated interest, deferred compensation award that was owed to Mr. Bernhard to a Supplemental Executive Retirement Plan (SERP) to make it clear that this award is a retirement benefit. The deferred compensation award was originally granted to Mr. Bernhard in 2001 and is currently fully vested. The economic terms and conditions of this award remain unchanged after the conversion to a SERP.
Welfare and Other Benefits. We maintain welfare benefit programs to meet the health care and welfare needs of our employees and their families.
Perquisites. Under our Flexible Perquisites Program (the Flex Program), certain executive officers, including our NEOs, receive a payment equal to 4% of their paid annual base salary, paid quarterly in arrears. The current Flex Program replaced a prior design in which the executive could choose from a combination of benefits that best meet their needs, such as, insurance, health, legal, financial planning, social, entertainment, travel and other benefits, and significantly reduced the administrative costs associated with the prior program. The Compensation Committee believes the payments to our NEOs under the Flex Program are reasonable and consistent with our overall compensation philosophy and necessary to remain competitive for top executive talent. We do not provide a gross-up for taxes on any executive perquisites.
In addition to the Flex Program, we are obligated to provide certain specific perquisites and executive benefits under existing employment agreements executed prior to the introduction of the Flex Program in 2005. These additional benefits include providing home security services and personal use of our aircraft to our Chief Executive Officer to ensure his safety and to minimize his travel time. Our corporate aircraft also enables our executives to minimize business travel time required as the corporate headquarters has limited access to commercial flights from the closest regional airport. This perquisite is governed by our Executive Compensation Guidelines, which are discussed above in “Executive Summary - Compensation Best Practices.” A description of the relevant provisions of the employment agreements with each of our NEOs is set forth in “EXECUTIVE COMPENSATION - Employment Agreements” below.
Relocation. Fiscal year 2012 included relocation expenses associated with Mr. Ferraioli’s move to Baton Rouge, Louisiana. Consistent with market practices, we provide gross-up of related employment and income taxes in order to ensure that the relocation reimbursement is cost neutral to the employee. See “EXECUTIVE COMPENSATION” below for additional details regarding Mr. Ferraioli’s relocation expenses in fiscal year 2012.
25
Employment Agreements. The Company believes it is in the mutual best interest of the Company and certain executive officers to have employment agreements. An employment agreement provides an effective means through which the Company, among other matters, may potentially secure the continued employment of the executive officer, discourage competitors from recruiting the executive officer, establish appropriate awards to incentivize future successful performance, growth, vision and development by the executive officer, and also provide for certain restrictions and requirements if the executive officer leaves the Company. At the same time, the agreement provides the executive officer with a level of security so that he can concentrate his focus, talents and efforts on the responsibilities and duties of his position.
We summarize our NEOs’ employment agreements in the “EXECUTIVE COMPENSATION - Employment Agreements” section below. We have limited the use of individual employment agreements to circumstances where we believe it is necessary to recruit or retain senior executives, given that we do not have a broad-based executive severance program as many of our peers have. Our Executive Compensation Guidelines specifically prohibit future executive agreements from providing guaranteed MIP awards and most tax gross ups, except in limited cases such as relocation expenses.
Severance and Change in Control Benefits. We provide severance and change in control benefits to our NEOs in their employment agreements. We strive to provide compensation that matches our understanding of the labor market for executives at similar levels in our highly competitive industry. We base our understanding of market compensation on information provided by our external compensation consultant, public filings by our Market Peer Group and negotiations with executives who recently joined our management team from other companies. While we seek to maintain parity among the vast majority of our senior executives, we recognize that certain of our NEOs have roles and responsibilities that may warrant a different approach from other senior executives. This is also true of our Market Peer Group, as our compensation consultant advises that the change in control and severance provisions vary by position. Based upon data gathered from the sources described above, a two- to three-year severance pay multiple is at market for most executives. With respect to severance, our competitors have vastly different approaches. Some have broad-based severance programs that provide a certain number of weeks of severance per year of service, with minimum and maximum amounts that vary. These programs tend to have lower individual amounts of severance than those companies with employment agreements, but cover a broader range of participants. Others provide severance through employment agreements containing one-, two-, or three-year severance pay multiples. We have designed severance and change in control provisions to apply to a narrow group of executives and to be consistent with these market trends.
The majority of our agreements covering our executive management team have severance and/or change in control payments with a two-year or less multiple. A few of our most senior officers’ employment agreements have termination and/or change in control provisions that provide for payment multiples above two-years. Specifically, the pay upon termination and/or change in control provision in the employment agreement of our Chairman, President and Chief Executive Officer, Mr. Bernhard, is three years, which is consistent with many of our peers and appropriately reflects Mr. Bernhard’s critical role in the Company. In the case of the President of our Fabrication & Manufacturing Group, Mr. Chapman, his pay upon termination and/or change in control provision is two years if triggered during the initial term, but three years if triggered during the Part-Time Employment Period (discussed below under “EXECUTIVE COMPENSATION - Employment Agreements”); however, the three-year multiple is based on a reduced salary rather than Mr. Chapman’s full-time employment salary. We believe that this arrangement is appropriate due to Mr. Chapman’s extensive experience in the industrial fabrication business. See “EXECUTIVE COMPENSATION - Potential Payments Upon Termination or a Change in Control” for a detailed description of the benefits offered to each named executive officer.
TAX AND ACCOUNTING CONSIDERATIONS
Tax Deductibility of Executive Compensation. Section 162(m) of the Internal Revenue Code generally prohibits a public company from deducting compensation in excess of $1 million paid in any year to certain of the executive officers. Certain compensation is specifically exempt from the deduction limit to the extent it qualifies as “performance-based.” As described previously, our incentive compensation programs are designed as a “plan within a plan” in order to preserve the deductibility under Section 162(m) of the Internal Revenue Code, while giving the Compensation Committee the flexibility to tailor awards to reflect financial, operational and individual achievements based on subjective as well as objective criteria. Incentive awards for our executive officers, including our NEOs, under our long-term incentive plans (in the form of RSUs and PCUs) and annual cash incentives (under our MIP) are structured generally to be deductible under Section 162(m). See “Incentive Compensation and Other Programs” for further discussion on “inner plan” performance measures. The Compensation Committee intends, however, to continue its practice of paying competitive compensation consistent with our philosophy to attract, retain and motivate executive officers to manage our business in the best interests of Shaw and our shareholders. The Compensation Committee, therefore, may choose to provide non-deductible compensation to our executive officers if it deems such compensation to be in the best interests of Shaw and our shareholders. Further, a portion of Mr. Bernhard’s base salary is non-deductible.
26
Accounting for Share-Based Compensation. Before we grant share-based compensation awards, we analyze the expected financial reporting impact of the award in accordance with ASC 718. In connection to our commitment to limit the amount of shares granted to employees and non-employee directors over fiscal years 2011 to 2013, the Compensation Committee has determined that awarding share-based long-term equity incentive compensation settled in the form of cash (RSUs and PCUs), which requires mark-to-market accounting, is appropriate under certain circumstances in order to appropriately manage our shares available for grant under our Omnibus Plan.
FISCAL YEAR 2013 COMPENSATION DECISIONS
The table below sets forth the fiscal year 2013 target total compensation for our NEOs by type of compensation in amounts and as a percentage of the executives’ fiscal year 2013 target total compensation. Our Compensation Committee made adjustments of 3.5% for all of our NEOs’, except Mr. Smith’s, regular target total compensation levels from fiscal year 2012 levels. Mr. Smith’s regular target total compensation levels increased by 24% from fiscal year 2012 levels as part of his promotion in July 2012.
For fiscal year 2013, we intend to continue using EBITDA and operating cash flow under our MIP as part of the financial and operational performance metrics. Consistent with prior years, for our fiscal year 2013 MIP, we set EBITDA and operating cash flow targets at what we consider aggressive levels that we believe will be a challenge for our employees to achieve.
Disclosing the specific financial targets in advance would likely result in competitive harm to the Company because, among other reasons, such detail would enable our competitors to use the information to our disadvantage as they would know our targeted margins and possibly be able to calculate our pricing on new project proposals. In addition, our clients could use the information to seek and obtain a lower price, possibly resulting in lower profit margins. We will discuss the targets after completion of the fiscal year.
Fiscal Year 2013 Target Total Compensation Table
|
Named Executive Officer
|
Annual Base Salary
|
Target
Annual Cash Incentive Compensation
|
Target
Long-Term Incentive Compensation
|
Target Total Compensation
|
||||||||||||
|
J.M. Bernhard, Jr.
|
||||||||||||||||
|
Chairman, President and
|
$ | 2,070,000 | $ | 3,415,000 | $ | 4,865,000 | $ | 10,350,000 | ||||||||
|
Chief Executive Officer
|
||||||||||||||||
|
Brian K. Ferraioli
|
||||||||||||||||
|
Executive Vice President and
|
$ | 672,750 | $ | 828,000 | $ | 1,449,000 | $ | 2,949,750 | ||||||||
|
Chief Financial Officer
|
||||||||||||||||
|
David L. Chapman, Sr.
|
||||||||||||||||
|
President, Fabrication &
|
$ | 776,250 | $ | 1,035,000 | $ | 1,242,000 | $ | 3,053,250 | ||||||||
|
Manufacturing Group
|
||||||||||||||||
|
George P. Bevan
|
||||||||||||||||
|
President, Environmental &
|
$ | 636,525 | $ | 636,525 | $ | 879,750 | $ | 2,152,800 | ||||||||
|
Infrastructure Group
|
||||||||||||||||
|
Eli Smith
|
||||||||||||||||
|
President, Power Group
|
$ | 750,000 | $ | 750,000 | $ | 787,500 | $ | 2,287,500 | ||||||||
27
COMPENSATION COMMITTEE REPORT
The Compensation Committee has reviewed and discussed with management the disclosure set forth above under the heading “COMPENSATION DISCUSSION AND ANALYSIS.” Based on its review and discussion, the Compensation Committee has recommended to the Board that the “COMPENSATION DISCUSSION AND ANALYSIS” be included in this amendment to The Shaw Group Inc.’s annual report on Form 10-K for the fiscal year ended August 31, 2012.
THE COMPENSATION COMMITTEE
Daniel A. Hoffler, Chairman
James F. Barker
Albert D. McAlister
28
EXECUTIVE COMPENSATION
The following table summarizes the compensation for each of our NEOs for the fiscal years ended August 31, 2012, 2011 and 2010.
SUMMARY COMPENSATION TABLE FOR THE FISCAL YEARS ENDED AUGUST 31, 2012, 2011 AND 2010
|
Name and Principal Position
|
Years
|
Salary
($) (2) |
Bonus
($) (3) |
Stock
Awards |
Option
Awards |
Non-Equity
Incentive |
All
Other |
Total ($)
|
|||||||||||||||||||||
|
J. M. Bernhard, Jr.
|
2012
|
2,000,000 | — | 7,518,825 | — | 6,600,000 | 713,099 | 16,831,924 | |||||||||||||||||||||
|
Chairman, President and
|
2011
|
2,000,000 | — | 2,473,679 | 3,137,146 | — | 669,580 | 8,280,405 | |||||||||||||||||||||
|
Chief Executive Officer
|
2010
|
1,972,768 | — | 2,473,671 | 2,826,137 | 580,800 | 554,268 | 8,407,644 | |||||||||||||||||||||
|
Brian K. Ferraioli
|
2012
|
650,000 | — | 2,239,650 | — | 1,600,000 | 1,057,203 | 5,546,853 | |||||||||||||||||||||
|
Executive Vice President and Chief
|
2011
|
650,000 | — | 736,832 | 603,038 | — | 36,006 | 2,025,876 | |||||||||||||||||||||
|
Financial Officer
|
2010
|
645,935 | — | 736,852 | 548,925 | 140,800 | 35,431 | 2,107,943 | |||||||||||||||||||||
|
David L. Chapman, Sr.
|
2012
|
750,000 | — | 1,919,700 | — | 1,000,000 | 40,120 | 3,709,820 | |||||||||||||||||||||
|
President, Fabrication &
|
2011
|
750,000 | 750,000 | 631,584 | 516,888 | — | 33,771 | 2,682,243 | |||||||||||||||||||||
|
Manufacturing Group
|
2010
|
750,000 | 750,000 | 631,583 | 470,500 | — | 34,270 | 2,636,353 | |||||||||||||||||||||
|
George P. Bevan (1)
|
2012
|
609,688 | — | 1,359,788 | — | 922,500 | 783,780 | 3,675,756 | |||||||||||||||||||||
|
President, Environmental &
|
|||||||||||||||||||||||||||||
|
Infrastructure Group
|
|||||||||||||||||||||||||||||
|
Eli Smith (1)
|
2012
|
615,833 | — | 1,016,241 | — | 1,200,000 | 784,013 | 3,616,087 | |||||||||||||||||||||
|
President, Power Group
|
|||||||||||||||||||||||||||||
|
(1)
|
Messrs. Bevan and Smith were not NEOs in fiscal years 2010 and 2011; therefore, for each of Messrs. Bevan and Smith, the Summary Compensation Table includes information only for fiscal year 2012.
|
|
(2)
|
The amounts reported in this column for 2012 reflect the earned annual base salary for each of our NEOs. The amounts reported for Messrs. Bernhard, Ferraioli and Chapman in 2011 and for Mr. Chapman in 2010 have been adjusted to reflect earned annual base salary rather than the actual amount of salary paid to each NEO in the applicable fiscal year, as was previously reported. The difference between earned annual base salary and actual amount of salary paid differs slightly due to the number of business hours in each fiscal year. The Company elected to adjust the previously reported amounts for consistency and ease of comparability. The amounts reported for Messrs. Bernhard and Ferraioli in 2010 were not adjusted, as each of these NEOs received salary adjustments during the fiscal year and therefore their earned annual base salary is pro-rated. The amounts reported in the “Total” column for 2011 and 2010 for these NEOs have also been adjusted to reflect this change.
|
|
(3)
|
For Mr. Chapman, the amounts in fiscal years 2011 and 2010 represent guaranteed minimum annual MIP cash incentive compensation that was previously provided under a prior employment agreement. His employment agreement was amended during fiscal year 2011, and his guaranteed MIP award was removed beginning in fiscal year 2012. The balance of the annual MIP compensation, if any, is included in the Non-Equity Incentive Plan Compensation column. The bifurcated presentation of the total annual MIP compensation is necessary to comply with the SEC guidance on this required disclosure. None of our NEOs received guaranteed minimum annual cash incentive compensation for fiscal year 2012.
|
|
(4)
|
This column represents the total grant date fair value, computed in accordance with ASC 718, of PCUs granted during fiscal year 2012 and RSUs granted during fiscal years 2012, 2011 and 2010. The grant date fair value of PCUs was calculated using a Monte Carlo simulation model. The assumptions used in the calculation of the grant date fair value of PCUs are included in Note 13 to our audited consolidated financial statements in our annual report on Form 10-K for the fiscal year ended August 31, 2012. The grant date fair value of RSUs is calculated using the last quoted sale price of our common stock on the NYSE on the grant date. The table below includes a breakdown of the grant date fair values included in the Stock Awards column above as well as the maximum value of the PCUs at the grant date assuming the highest level of performance is achieved.
|
29
|
Name
|
Years
|
PCU Awards:
Grant Date |
PCU Awards:
Maximum Value |
RSU Awards:
Grant Date |
|||||||||
|
J. M. Bernhard, Jr.
|
2012
|
5,168,825 | 9,400,000 | 2,350,000 | |||||||||
|
2011
|
— | — | 2,473,679 | ||||||||||
|
2010
|
— | — | 2,473,671 | ||||||||||
|
Brian K. Ferraioli
|
2012
|
1,539,650 | 2,800,000 | 700,000 | |||||||||
|
2011
|
— | — | 736,832 | ||||||||||
|
2010
|
— | — | 736,852 | ||||||||||
|
David L. Chapman, Sr.
|
2012
|
1,319,700 | 2,400,000 | 600,000 | |||||||||
|
2011
|
— | — | 631,584 | ||||||||||
|
2010
|
— | — | 631,583 | ||||||||||
|
George P. Bevan
|
2012
|
934,788 | 1,700,000 | 425,000 | |||||||||
|
Eli Smith
|
2012
|
698,616 | 1,270,500 | 317,625 | |||||||||
Fiscal year 2012 LTI awards vest over the next three years. Annual RSUs incrementally vest over a three-year service period and represent 50% of each NEO’s annual target LTI. Annual PCUs vest at the end of a three year performance period, and also represent 50% of each NEO’s annual target LTI. Beginning in fiscal year 2012, PCUs were issued as a replacement for the previous practice of awarding stock options, which incrementally vested over a four-year service period. In modeling the impact of the transition, it was identified that our NEOs would experience gaps of vesting, which would result in a negative financial impact. To address this transition, the Committee approved a one-time, supplemental PCU award of 50% of each NEO’s annual target LTI, which vests at the end of the one year and two year performance periods. The table below includes the vesting schedule and performance cycles for the fiscal year 2012 PCU grant. The first two performance cycles listed are related to the supplemental PCU award. The final cycle is related to the annual award.
|
Performance Cycle
|
Performance Cycle
End Date
|
Percentage of
Target Award that
can be Earned
|
|
Fiscal Year 2012
|
8/31/12
|
25%
|
|
Fiscal Year 2012 - 2013
|
8/31/13
|
25%
|
|
Fiscal Year 2012 - 2014
|
8/31/14
|
50%
|
|
(5)
|
This column represents the total grant date fair value, computed in accordance with ASC 718, of stock options granted during fiscal years 2011 and 2010. Stock options were not granted in fiscal year 2012. The assumptions used in the calculation of grant date fair value are included in Note 13 to our audited consolidated financial statements in our annual report on Form 10-K for the fiscal year ended August 31, 2012. The dollar value of the stock option awards approved by the Compensation Committee for each of the option awards in fiscal year 2011 is unchanged from fiscal year 2010. The fiscal year 2011 over fiscal year 2010 increase in total grant date fair value, computed in accordance with ASC 718, is due to the share valuation methodology developed and recommended by Meridian to calculate the actual number of option awards granted.
|
|
(6)
|
Amounts shown in this column represent the annual cash incentive compensation paid for fiscal years 2012, 2011 and 2010 under our MIP, excluding any guaranteed minimum annual cash incentive compensation included in the Bonus column of this table. See “Compensation Discussion of Our Named Executive Officers” and "Incentive Compensation and Other Programs” above under “COMPENSATION DISCUSSION AND ANALYSIS” as well as “Grants of Plan-Based Awards during Fiscal Year 2012” below for additional information.
|
|
(7)
|
The following table describes the components of the “All Other Compensation” column for fiscal year 2012. Some of the amounts in the table below were paid directly by the Company and some were reimbursed by the Company to the NEOs. The table below does not include amounts for the following perquisites because there was no incremental cost associated with these perquisites during fiscal year 2012.
|
|
– The Company purchases tickets to athletic and other entertainment events generally for client entertainment purposes. If the tickets are not being used for client entertainment purposes, employees, including the Company’s NEOs, may use the tickets.
|
|
|
– We are a member of a hunting and fishing club in southwest Louisiana that we use primarily for client entertainment purposes. If the Company is not using the club for client entertainment purposes, employees, including the Company’s NEOs, may use the club.
|
|
|
– Guests may accompany NEOs on business trips periodically. If the Company’s aircraft is used and a guest travels with the NEO on the business trip, there is no incremental cost to the Company.
|
30
All Other Compensation
|
|
J. M.
Bernhard, Jr.
|
Brian K.
Ferraioli
|
David L. Chapman, Sr.
|
George P.
Bevan
|
Eli Smith
|
|||||||||||||||
|
(a) Company Paid Insurance Premiums
|
$ | 1,920 | $ | 1,920 | $ | 1,920 | $ | 1,920 | $ | 1,920 | ||||||||||
|
(b) Company Contributions to 401(k) Plan
|
7,500 | 7,500 | 7,500 | 7,590 | 7,500 | |||||||||||||||
|
(c) Nonqualified Deferred Compensation
|
— | 1,000,000 | — | 750,000 | 750,000 | |||||||||||||||
|
(d) Personal Use of Corporate Aircraft
|
291,148 | 8,482 | — | — | — | |||||||||||||||
|
(e) Automobile Expenses
|
39,051 | — | — | — | — | |||||||||||||||
|
(f) Security Services
|
282,400 | — | — | — | — | |||||||||||||||
|
(g) Flex Program
|
80,000 | 26,000 | 30,000 | 24,270 | 24,593 | |||||||||||||||
|
(h) Tax Gross-up Payments on Relocation Benefits
|
— | 7,178 | — | — | — | |||||||||||||||
|
(i) Other
|
11,080 | 6,123 | 700 | — | — | |||||||||||||||
|
TOTAL
|
$ | 713,099 | $ | 1,057,203 | $ | 40,120 | $ | 783,780 | $ | 784,013 | ||||||||||
|
|
(a)
|
Represents the dollar value of the premiums paid directly by us for life insurance, long-term disability insurance and accidental death and dismemberment insurance. These premiums are paid for certain executives, including, but not limited to, the NEOs, and represent the amounts that exceed the costs of the programs generally available to all full-time professional employees.
|
|
|
(b)
|
Represents our contributions to our 401(k) Plan, which is a tax-qualified, defined contribution retirement plan available to all eligible employees. The Company provides a matching contribution of 50% of each employee’s contribution to the 401(k) Plan up to six percent of each employee’s eligible compensation, subject to applicable Internal Revenue Code limitations. As a result of nondiscrimination testing of highly compensated employees, refunds of employee 401(k) Plan withholdings and the forfeiture of our corresponding contribution may take place in subsequent years. The amounts included remain subject to potential reduction for past or potential forfeitures as a result of nondiscrimination testing. The amounts shown are calculated on a fiscal year, rather than a calendar year, basis; therefore, the contributions in the table may be greater than the annual Internal Revenue Code limitation for certain employees.
|
|
(c)
|
Represents contributions made to our Deferred Compensation Plan for Messrs. Ferraioli, Bevan and Smith. See “Nonqualified Deferred Compensation” below for additional information.
|
|
|
(d)
|
The Company allows Mr. Bernhard personal use of the corporate aircraft, in accordance with his employment agreement, in order to ensure his personal safety as our Chief Executive Officer, minimize his time away from the office and compensate for the limited number of commercial flights into and out of the local airport in Baton Rouge, Louisiana.
|
|
|
The Company allowed Mr. Ferraioli limited personal use of the corporate aircraft during fiscal year 2012, in accordance with the terms of his relocation agreement.
|
||
|
The incremental cost of personal use of the corporate aircraft was calculated by multiplying certain variable operating costs per hour by the number of hours flown by each NEO for personal use (excluding the hours associated with deadhead legs, which are often directed by the Company for repositioning of the aircraft to locations most beneficial to the Company’s operations).
|
||
|
The following variable operating costs were included in our calculation of incremental cost:
|
||
|
|
- fuel;
|
|
|
|
- incremental repairs and maintenance;
|
|
|
|
- catering and supplies;
|
|
|
|
- travel and lodging expenses for the crew; and
|
|
|
|
- landing, flight planning and other related fees.
|
|
| The following costs were not included in our calculation of incremental cost: | ||
|
- fixed costs, such as crew compensation, lease expenses, insurance and hangar rent;
|
||
|
- costs associated with regularly scheduled or planned maintenance, upgrades and improvements and aviation subscriptions and publications; and
|
||
|
- the amount of our disallowed tax deduction. Internal Revenue Code Section 274(e) limits the amount that companies can deduct for the personal use of corporate aircraft to the amount recognized as income by the executive that used the aircraft. For fiscal year 2012, the total amount of our disallowed tax deduction resulting from personal use of the corporate aircraft by our employees, including our NEOs, was approximately $3.3 million.
|
31
|
(e)
|
The Company provides Mr. Bernhard with a Company-owned automobile for business and personal use. The aggregate incremental cost reflected in the table above includes fuel, maintenance, insurance and annual depreciation expense based on an estimated useful life of 5 years. We have included 100% of the costs paid by us as the aggregate incremental costs, which includes both personal and business use of the automobile. Although Mr. Bernhard does not keep detailed records of automobile use for business purposes, he estimates his business use at 20%.
|
|
|
(f)
|
Represents the cost of security services provided at Mr. Bernhard’s personal residence as required by the Company. The amount for fiscal year 2011 was lower due to an insurance recovery that was not repeated in the current year.
|
|
|
(g)
|
Represents 4% of each NEO’s annual base salary paid out on a calendar quarter basis in accordance with our Flex Program. See discussion above under “COMPENSATION DISCUSSION AND ANALYSIS - Benefits and Other Compensation.”
|
|
|
(h)
|
Represents a tax gross-up payment made to Mr. Ferraioli to cover taxes on portions of his relocation expenses incurred in fiscal year 2012. In general, all professional employees, including the NEOs, are eligible for tax reimbursements for relocation expenses.
|
|
|
(i)
|
Represents other amounts including the total amount paid for country club dues and related fees for Mr. Bernhard, relocation expenses for Mr. Ferraioli and cost incurred by us for Mr. Chapman’s spouse to accompany him to a business function.
|
GRANTS OF PLAN-BASED AWARDS DURING FISCAL YEAR 2012
The following table provides information about cash and equity incentive compensation awarded to our NEOs in fiscal year 2012. During fiscal year 2012, the NEOs received three types of plan-based awards:
Management Incentive Program. Our MIP is based on achieving or exceeding identified Company and business unit financial goals and variable operational and strategic performance factors. Awards under our MIP may be made in the form of cash-based awards, non-qualified stock options, incentive stock options, stock appreciation rights, restricted stock, restricted stock units, performance shares, performance units, or other stock-based awards. For additional information about our MIP, see “COMPENSATION DISCUSSION AND ANALYSIS - Incentive Compensation and Other Programs.”
Performance Cash Units. The PCUs are granted under our Omnibus Plan. In fiscal year 2012, we issued PCUs to certain executives in connection with our annual long-term equity incentive compensation grant and as a one-time transition grant. For additional information, see “COMPENSATION DISCUSSION AND ANALYSIS - Incentive Compensation and Other Programs.”
Restricted Stock Units. The RSUs are granted under our Omnibus Plan. In fiscal year 2012, we issued RSUs to eligible employees in connection with our annual long-term equity incentive compensation grant. For additional information, see “COMPENSATION DISCUSSION AND ANALYSIS - Incentive Compensation and Other Programs.”
Grants of Plan-Based Awards During the Fiscal Year Ended August 31, 2012
|
Grant
|
Estimated Future Payouts
Under Non-Equity Incentive Plan |
Estimated Future Payouts
Under Equity Incentive Plan |
All Other
Stock |
Grant
Date |
|||||||
|
Name
|
Grant Type
|
Grant
Date (1)
|
Approval
Date (1)
|
Threshold
($)(2a)
|
Target
($)
|
Maximum
($)(2b)
|
Threshold
(#)
|
Target
(#)
|
Maximum
(#)
|
Units
(#)(4)
|
Awards
($)(5)
|
|
J. M. Bernhard, Jr.
|
MIP
|
—
|
3,300,000
|
6,600,000
|
|||||||
|
PCUs - Annual
|
11/1/2011
|
10/20/2011
|
—
|
4,700,000
|
9,400,000
|
5,168,825
|
|||||
|
RSUs - Annual
|
11/1/2011
|
10/20/2011
|
101,075
|
2,350,000
|
|||||||
|
Brian K. Ferraioli
|
MIP
|
—
|
800,000
|
1,600,000
|
|||||||
|
PCUs - Annual
|
11/1/2011
|
10/20/2011
|
—
|
1,400,000
|
2,800,000
|
1,539,650
|
|||||
|
RSUs - Annual
|
11/1/2011
|
10/20/2011
|
30,108
|
700,000
|
|||||||
|
David L. Chapman, Sr.
|
MIP
|
—
|
1,000,000
|
2,000,000
|
|||||||
|
PCUs - Annual
|
11/1/2011
|
10/20/2011
|
—
|
1,200,000
|
2,400,000
|
1,319,700
|
|||||
|
RSUs - Annual
|
11/1/2011
|
10/20/2011
|
25,806
|
600,000
|
|||||||
|
George P. Bevan
|
MIP
|
—
|
615,000
|
1,230,000
|
|||||||
|
PCUs - Annual
|
11/1/2011
|
10/20/2011
|
—
|
850,000
|
1,700,000
|
934,788
|
|||||
|
RSUs - Annual
|
11/1/2011
|
10/20/2011
|
18,280
|
425,000
|
|||||||
|
Eli Smith
|
MIP
|
—
|
615,833
|
1,231,666
|
|||||||
|
PCUs - Annual
|
11/1/2011
|
10/20/2011
|
—
|
635,250
|
1,270,500
|
698,616
|
|||||
|
RSUs - Annual
|
11/1/2011
|
10/20/2011
|
13,661
|
317,625
|
|||||||
32
|
(1)
|
The Compensation Committee approved the awards classified as “PCUs – Annual” and “RSUs – Annual” on October 20, 2011, and determined that the grants would be awarded on November 1, 2011, the first full trading day following the day of our earnings release.
|
|
(2)
|
These columns show the range of possible cash payouts under the performance-based portion of our MIP related to fiscal year 2012 performance. For additional information related to our annual cash incentive awards and amounts actually paid to each of our NEOs, see “COMPENSATION DISCUSSION AND ANALYSIS - Compensation Discussion of Our Named Executive Officers” and “- Incentive Compensation and Other Programs.”
|
|
(a) No threshold exists for the NEOs.
|
|
| (b) Calculated as 200% of the NEO’s fiscal year 2012 annual MIP cash incentive compensation target. | |
|
(3)
|
These columns show the range of PCUs that may be earned under the PCU Program. For each earned PCU, $1 will be paid. Each executive can earn between 0% and 200% of their individual target award depending on the level of performance achieved, which is measured by comparing Shaw’s TSR to the median TSR of the PCU Peer Group, over a three-year performance period. For additional information, see “COMPENSATION DISCUSSION AND ANALYSIS - Compensation Discussion of Our Named Executive Officers” and “- Incentive Compensation and Other Programs.”
|
|
(4)
|
This column shows the number of RSUs granted under our Omnibus Plan to our NEOs during fiscal year 2012. For additional information related to the terms and conditions of the RSUs granted, see “Outstanding Equity Awards at 2012 Fiscal Year End” below.
|
|
(5)
|
This column shows the total grant date fair value, computed in accordance with ASC 718, of PCUs and RSUs granted during fiscal year 2012 to our NEOs. The assumptions used in the calculation of the grant date fair value of PCUs are included in Note 13 to our audited consolidated financial statements in our annual report on Form 10-K for the fiscal year ended August 31, 2012. The grant date fair value of RSUs is calculated using the last quoted sale price of our common stock on the NYSE on the grant date.
|
OUTSTANDING EQUITY AWARDS AT 2012 FISCAL YEAR END
The following table provides information regarding outstanding unexercised stock options and unvested stock awards held by each of our NEOs at August 31, 2012. Each grant of stock options or unvested stock awards is shown separately for each NEO. For information on the beneficial ownership of our common stock, please refer to “ITEM 2. SECURITY OWNERSHIP OF CERTAIN BENEFICIAL OWNERS AND MANAGEMENT AND RELATED STOCKHOLDER MATTERS - Security Ownership of Management and Directors” below.
33
Outstanding Equity Awards at August 31, 2012
The outstanding stock options and RSUs at August 31, 2012 vest according to the following vesting schedules:
|
Option Awards
|
Stock Awards
|
||||||||||||||||||||||||||||||||
|
RSUs & Earned PCUs
|
Equity Incentive Plan Awards
|
||||||||||||||||||||||||||||||||
|
Name
|
Grant
Date |
Number of
Securities |
Number of
Securities |
Option
Exercise |
Option
Expiration |
Grant
Date |
Number
Of Shares |
Market
Value |
Grant
Date |
Number of
Unearned |
Market or
Payout |
||||||||||||||||||||||
|
J. M. Bernhard, Jr.
|
10/10/2003
|
304,000 | — | 11.20 |
10/10/2013
|
||||||||||||||||||||||||||||
|
10/13/2004
|
232,800 | — | 12.66 |
10/13/2014
|
|||||||||||||||||||||||||||||
|
10/13/2005
|
206,000 | — | 20.76 |
10/13/2015
|
|||||||||||||||||||||||||||||
|
11/1/2006
|
206,991 | — | 26.70 |
11/1/2016
|
|||||||||||||||||||||||||||||
|
12/7/2007
|
72,130 | — | 67.19 |
12/7/2017
|
|||||||||||||||||||||||||||||
|
10/31/2008
|
170,153 | 56,718 | 17.89 |
10/31/2018
|
|||||||||||||||||||||||||||||
|
1/28/2009
|
34,568 | 1,454,621 | (1a) | ||||||||||||||||||||||||||||||
|
10/29/2009
|
73,712 | 73,713 | 27.79 |
10/29/2019
|
10/29/2009
|
44,507 | 1,872,855 | (1a) | |||||||||||||||||||||||||
|
10/29/2010
|
40,489 | 121,470 | 30.56 |
10/29/2020
|
10/29/2010
|
60,709 | 2,554,635 | (1a) | |||||||||||||||||||||||||
|
11/1/2011
|
101,075 | 4,253,236 | (1a) | ||||||||||||||||||||||||||||||
|
11/1/2011
|
2,350,000 | 2,350,000 |
(1b)
|
11/1/2011
|
7,050,000 | 7,050,000 | |||||||||||||||||||||||||||
|
Total
|
1,306,275 | 251,901 | 2,590,859 | 12,485,347 | 7,050,000 | 7,050,000 | |||||||||||||||||||||||||||
|
Brian K. Ferraioli
|
8/1/2007
|
21,231 | — | 48.99 |
8/1/2017
|
||||||||||||||||||||||||||||
|
12/7/2007
|
15,347 | — | 67.19 |
12/7/2017
|
|||||||||||||||||||||||||||||
|
10/31/2008
|
42,616 | 10,481 | 17.89 |
10/31/2018
|
|||||||||||||||||||||||||||||
|
1/28/2009
|
8,091 | 340,469 | (1a) | ||||||||||||||||||||||||||||||
|
10/29/2009
|
21,957 | 21,957 | 27.79 |
10/29/2019
|
10/29/2009
|
13,258 | 557,897 | (1a) | |||||||||||||||||||||||||
|
10/29/2010
|
12,060 | 36,183 | 30.56 |
10/29/2020
|
10/29/2010
|
18,084 | 760,975 | (1a) | |||||||||||||||||||||||||
|
11/1/2011
|
30,108 | 1,266,945 | (1a) | ||||||||||||||||||||||||||||||
|
11/1/2011
|
700,000 | 700,000 |
(1b)
|
11/1/2011
|
2,100,000 | 2,100,000 | |||||||||||||||||||||||||||
|
Total
|
113,211 | 68,621 | 769,541 | 3,626,286 | 2,100,000 | 2,100,000 | |||||||||||||||||||||||||||
|
David L. Chapman Sr.
|
12/7/2007
|
17,265 | — | 67.19 |
12/7/2017
|
||||||||||||||||||||||||||||
|
10/31/2008
|
14,482 | 14,482 | 17.89 |
10/31/2018
|
|||||||||||||||||||||||||||||
|
1/28/2009
|
8,826 | 371,398 | (1a) | ||||||||||||||||||||||||||||||
|
10/29/2009
|
9,410 | 18,820 | 27.79 |
10/29/2019
|
10/29/2009
|
11,364 | 478,197 | (1a) | |||||||||||||||||||||||||
|
10/29/2010
|
10,337 | 31,014 | 30.56 |
10/29/2020
|
10/29/2010
|
15,501 | 652,282 | (1a) | |||||||||||||||||||||||||
|
11/1/2011
|
25,806 | 1,085,916 | (1a) | ||||||||||||||||||||||||||||||
|
11/1/2011
|
600,000 | 600,000 | (1b) |
11/1/2011
|
1,800,000 | 1,800,000 | |||||||||||||||||||||||||||
|
Total
|
51,494 | 64,316 | 661,497 | 3,187,793 | 1,800,000 | 1,800,000 | |||||||||||||||||||||||||||
|
George P. Bevan
|
11/1/2006
|
2,232 | — | 26.70 |
11/1/2016
|
||||||||||||||||||||||||||||
|
12/7/2007
|
2,302 | — | 67.19 |
12/7/2017
|
|||||||||||||||||||||||||||||
|
10/31/2008
|
27,152 | 9,051 | 17.89 |
10/31/2018
|
|||||||||||||||||||||||||||||
|
1/28/2009
|
5,517 | 232,155 | (1a) | ||||||||||||||||||||||||||||||
|
10/29/2009
|
13,331 | 13,331 | 27.79 |
10/29/2019
|
10/29/2009
|
8,049 | 338,702 | (1a) | |||||||||||||||||||||||||
|
10/29/2010
|
7,322 | 21,968 | 30.56 |
10/29/2020
|
10/29/2010
|
10,980 | 462,038 | (1a) | |||||||||||||||||||||||||
|
11/1/2011
|
18,280 | 769,222 | (1a) | ||||||||||||||||||||||||||||||
|
11/1/2011
|
425,000 | 425,000 | (1b) |
11/1/2011
|
1,275,000 | 1,275,000 | |||||||||||||||||||||||||||
|
Total
|
52,339 | 44,350 | 467,826 | 2,227,117 | 1,275,000 | 1,275,000 | |||||||||||||||||||||||||||
|
Eli Smith
|
6/1/2009
|
5,602 | 1,868 | 29.00 |
6/1/2019
|
6/1/2009
|
1,362 | 57,313 | (1a) | ||||||||||||||||||||||||
|
10/29/2009
|
2,744 | 2,745 | 27.79 |
10/29/2019
|
10/29/2009
|
1,657 | 69,727 | (1a) | |||||||||||||||||||||||||
|
10/29/2010
|
4,738 | 14,215 | 30.56 |
10/29/2020
|
10/29/2010
|
7,104 | 298,936 | (1a) | |||||||||||||||||||||||||
|
11/1/2011
|
13,661 | 574,855 | (1a) | ||||||||||||||||||||||||||||||
|
11/1/2011
|
317,624 | 317,624 | (1b) |
11/1/2011
|
952,876 | 952,876 | |||||||||||||||||||||||||||
|
Total
|
13,084 | 18,828 | 341,408 | 1,318,455 | 952,876 | 952,876 | |||||||||||||||||||||||||||
34
|
(1)
|
These columns include unvested RSUs as well as earned but unvested PCUs at August 31, 2012.
(a) The market value of RSUs was determined by multiplying the number of unvested shares of stock by $42.08, the closing market price of our common stock on August 31, 2012, the last trading day of our fiscal year.
(b) The market value of PCUs was determined by multiplying the number of earned but unvested PCUs by one dollar, the value that will be paid out in cash for each earned PCU. See Note 3 below for additional details on the vesting of PCUs.
|
|||||||||||||
|
(2)
|
The number and payout value of unearned/unvested PCUs was determined using the maximum level (200% of the target award) based on our fiscal year 2012 performance. The payout value of PCUs was calculated by multiplying the maximum number of PCUs as of 8/31/12 by one dollar, the value that will be paid in cash for each earned PCU. See Note 3 below for additional details on the vesting of PCUs.
|
|||||||||||||
|
(3)
|
The outstanding stock options and RSUs at August 31, 2012 vest according to the following vesting schedules: | |||||||||||||
|
Grant Date
|
Vesting Dates – Option Awards
|
|||
|
10/10/2003
|
10/10/2004
|
10/10/2005
|
10/10/2006
|
10/10/2007
|
|
10/13/2004
|
10/13/2005
|
10/13/2006
|
10/13/2007
|
10/13/2008
|
|
10/13/2005
|
10/13/2006
|
10/13/2007
|
10/13/2008
|
10/13/2009
|
|
11/01/2006
|
11/01/2007
|
11/01/2008
|
11/01/2009
|
11/01/2010
|
|
08/01/2007
|
08/01/2008
|
08/01/2009
|
08/01/2010
|
08/01/2011
|
|
12/07/2007
|
01/01/2009
|
01/01/2010
|
01/01/2011
|
01/01/2012
|
|
10/31/2008
|
01/01/2010
|
01/01/2011
|
01/01/2012
|
01/01/2013
|
|
06/01/2009
|
06/01/2010
|
06/01/2011
|
06/01/2012
|
06/01/2013
|
|
10/05/2009
|
10/05/2010
|
10/05/2011
|
10/05/2012
|
10/05/2013
|
|
10/29/2009
|
01/01/2011
|
01/01/2012
|
01/01/2013
|
01/01/2014
|
|
10/29/2010
|
01/01/2012
|
01/01/2013
|
01/01/2014
|
01/01/2015
|
|
Grant Date
|
Vesting Dates – Stock Awards (RSUs)
|
|||
|
01/28/2009
|
01/01/2010
|
01/01/2011
|
01/01/2012
|
01/01/2013
|
|
06/01/2009
|
06/01/2010
|
06/01/2011
|
06/01/2012
|
06/01/2013
|
|
10/05/2009
|
10/05/2010
|
10/05/2011
|
10/05/2012
|
10/05/2013
|
|
10/29/2009
|
01/01/2011
|
01/01/2012
|
01/01/2013
|
01/01/2014
|
|
10/29/2010
|
01/01/2012
|
01/01/2013
|
01/01/2014
|
01/01/2015
|
|
11/01/2011
|
11/01/2012
|
11/01/2013
|
11/01/2014
|
|
The PCUs granted in fiscal year 2012 include three performance cycles. The number of earned PCUs is calculated at the end of each performance cycle. Earned amounts are paid following certification by the Compensation Committee of the level of performance achieved and the percentage of the target award earned, which shall occur no later than 60 days following the end of each performance cycle. Recipients must be employed on the date of payout, which is projected to occur by November 1st each year, in order to receive the award. The percentage of the target award that can be earned in each performance cycle and that will vest following certification by the Compensation Committee each year is laid out in the table below:
|
Performance Cycle
|
Performance
Cycle End Date
|
Vesting Date
|
Percentage of
Target Award
that can be Earned
|
|
Fiscal Year 2012
|
8/31/12
|
10/22/2012 (Actual)
|
25%
|
|
Fiscal Year 2012 - 2013
|
8/31/13
|
11/01/2013 (Projected)
|
25%
|
|
Fiscal Year 2012 - 2014
|
8/31/14
|
11/01/2014 (Projected)
|
50%
|
OPTIONS EXERCISED AND STOCK VESTED DURING FISCAL YEAR 2012
The following table provides information for each of our NEOs regarding the number of shares acquired upon the vesting of RSUs during fiscal year 2012 and the value realized. Our NEOs did not exercise any stock options during fiscal year 2012:
35
Stock Vested During the Fiscal Year Ended August 31, 2012
|
Stock Awards
|
||
|
Name
|
Number of Shares
Acquired on
Vesting (#)
|
Value Realized on
Vesting ($) (1)
|
|
J. M. Bernhard, Jr.
|
123,664
|
3,326,562
|
|
Brian K. Ferraioli
|
31,284
|
841,540
|
|
David L. Chapman, Sr.
|
43,659
|
1,174,427
|
|
George P. Bevan
|
18,797
|
505,639
|
|
Eli Smith
|
4,558
|
120,065
|
|
(1)
|
The value realized upon the vesting of RSUs is the number of shares acquired on vesting multiplied by the closing market price of our common stock on the vesting date. Upon the vesting of RSUs, shares may have been surrendered to satisfy income tax withholding requirements upon election by the employee. The amounts shown and the value realized do not give effect to the surrender of shares to cover such tax withholding obligations.
|
NONQUALIFIED DEFERRED COMPENSATION
Deferred Compensation Plan
We maintain The Shaw Group Inc. Deferred Compensation Plan (the Deferred Compensation Plan), which is a non-qualified deferred compensation plan offered to a select group of key employees. This plan is designed to assist our employees in receiving a portion of their cash compensation in a tax efficient manner, and it also promotes retention because our employees must remain with the Company for a fixed period of time in order to receive amounts contributed by the Company pursuant to the plan. The long-term deferral awards are evidenced by individual agreements with the participating employees. Three of our NEOs, Messrs. Ferraioli, Bevan and Smith, received discretionary employer contributions during fiscal year 2012. See “COMPENSATION DISCUSSION AND ANALYSIS” above for additional information.
The Company funds awards under the Deferred Compensation Plan. Participant contributions are not allowed. Participants are allowed to invest deferred amounts in a number of approved investment options. The following table shows the investment options and the rate of return for the period September 1, 2011 through August 31, 2012 for each fund that was offered through the Deferred Compensation Plan as of August 31, 2012. Earnings for each executive are based on the returns generated by the funds below and each executive’s individual investment selections.
|
Fund Name
|
Rate of Return
|
|
PIMCO Total Return Institutional
|
8.62
|
|
Vanguard Institutional Index Fund
|
17.98
|
|
Vanguard Inflation-Protected Securities Fund Investor Shares
|
8.43
|
|
American Funds Growth Fund of America
|
13.51
|
|
American Funds EuroPacific Growth
|
1.48
|
|
Westwood SMidCap Institutional Fund
|
7.43
|
|
FFI Government Fund
|
0.01
|
|
JP Morgan Short Duration Bond Select
|
1.62
|
|
MFS Institutional Large Cap Value
|
16.29
|
|
Dreyfus/The Boston Company Small/Mid Cap Growth Fund
|
21.57
|
|
Vanguard Extended Market Index Institutional Fund
|
13.28
|
|
Vanguard Total Bond Market Fund
|
5.85
|
|
Vanguard FTSE All-World ex-US Index Institutional
|
-1.98
|
|
Vanguard Target Income Retirement
|
8.02
|
|
Vanguard 2010 Target Retirement
|
8.82
|
|
Vanguard 2015 Target Retirement
|
9.19
|
|
Vanguard 2020 Target Retirement
|
9.56
|
|
Vanguard 2025 Target Retirement
|
9.85
|
|
Vanguard 2030 Target Retirement
|
10.18
|
|
Vanguard 2035 Target Retirement
|
10.45
|
|
Vanguard 2040 Target Retirement
|
10.54
|
|
Vanguard 2045 Target Retirement
|
10.57
|
|
Vanguard 2050 Target Retirement
|
10.56
|
|
Vanguard 2055 Target Retirement
|
10.58
|
36
Withdrawals of unvested funds from the Deferred Compensation Plan prior to the applicable employee’s vesting date are not permitted, although participants are allowed to take hardship distributions from the vested portion of their account balances for unforeseeable emergencies. An unforeseeable emergency shall mean (1) a severe financial hardship of the participant that results from an illness or accident of the participant, the participant’s spouse or the participant's dependent, (2) loss of the participant’s property due to casualty, or (3) a similar extraordinary and unforeseeable circumstance arising as a result of events beyond the participant’s control.
Once vested, the participant’s account balance is paid out at a time selected by the participant in either annual installments or a lump sum, subject to certain plan provisions. However, upon the participant's disability or death, or a change in control, regardless of the participant’s distribution election, his or her unpaid account balance will become 100% vested and paid out in a single lump sum. The Deferred Compensation Plan defines disability as either (1) the inability of a participant to engage in a substantially gainful activity by reason of a medically determinable physical or mental impairment which is expected to result in death or to last at least 12 months, or (2) the receipt by a participant of income replacement benefits for at least 3 months under our accident and health plan. A change of control for purposes of the Deferred Compensation Plan generally means (1) a change in the ownership of the Company, where any person or group acquires more than 50% of the total fair market value or the total voting power of our stock, (2) a change in the effective control of the Company where any person or group acquires ownership of 30% or more of the voting power of our stock, or a majority of the members of our Board are replaced in a twelve month period, or (3) a change in the ownership of a substantial portion of our assets, meaning that a person or group acquires 40% or more of the total gross fair market value of all of our assets.
Supplemental Executive Retirement Plan
In addition to the Deferred Compensation Plan, in April 2001, the Company agreed to set aside $5,000,000 per year during each of fiscal years 2001, 2002 and 2003 as a retirement benefit for Mr. Bernhard after several months of negotiation and just shortly after Mr. Bernhard successfully led the Company through the acquisition of Stone & Webster, Inc., which was at the time, the largest acquisition in the Company’s history. The $15 million, plus accumulated interest, is payable to Mr. Bernhard upon termination of employment. On December 12, 2011, the Company converted Mr. Bernhard’s deferred compensation award to a Supplemental Executive Retirement Plan (SERP) to make it clear that the award was a retirement benefit. There were no changes to the economics or timing of payments as part of this conversion; however, the conversion to a SERP is fully compliant with Section 409A of the Internal Revenue Code and eliminated the misconceptions associated with the language in his employment agreement regarding the deferred compensation award and non-compete provision. Mr. Bernhard’s SERP is near the market median for company-provided retirement benefits for long-service chief executive officers, including founders, of similarly-sized companies. For additional information, see “COMPENSATION DISCUSSION AND ANALYSIS” above.
The funds in Mr. Bernhard’s SERP are invested in short-term interest-bearing securities in accordance with our investment policy and earned interest at a rate of 1.40% during fiscal year 2012. The full award value of the SERP has not been included in the Summary Compensation Table for the fiscal year ended 2012, as this is not considered a new award for Mr. Bernhard, but simply a re-characterization of the nonqualified deferred compensation award granted to him in 2001.
The following table provides summary information with respect to amounts credited, earnings and account balances for our NEOs under our Deferred Compensation Plan or other agreements.
Nonqualified Deferred Compensation for the Fiscal Year Ended August 31, 2012
|
Executive
ContributionsFiscal Year
|
Registrant
ContributionsFiscal Year
|
Aggregate
EarningsFiscal Year
|
Aggregate
Withdrawals/Distributions
|
Aggregate
BalanceFiscal Year End
|
|
|
Name
|
($)
|
($)(1)
|
($)(2)
|
($)
|
($)(3)
|
|
J. M. Bernhard, Jr.
|
|||||
|
Deferred Compensation Plan
|
—
|
—
|
—
|
—
|
—
|
|
SERP
|
—
|
—
|
258,470
|
—
|
18,739,816
|
|
Brian K. Ferraioli
|
|||||
|
Deferred Compensation Plan
|
—
|
1,000,000
|
66,654
|
—
|
1,066,654
|
|
David L. Chapman, Sr.
|
|||||
|
Deferred Compensation Plan
|
—
|
—
|
—
|
—
|
—
|
|
George P. Bevan
|
|||||
|
Deferred Compensation Plan
|
—
|
750,000
|
73,554
|
—
|
823,554
|
|
Eli Smith
|
|||||
|
Deferred Compensation Plan
|
—
|
750,000
|
82,220
|
—
|
1,110,867
|
|
(1)
|
These amounts are reflected in the “All Other Compensation” column of the Summary Compensation Table.
|
|
(2)
|
None of the earnings in this column are included in the Summary Compensation Table because they were not preferential or above-market.
|
|
(3)
|
See the “Nonqualified Deferred Compensation” narrative above for additional information on the amounts awarded to Messrs. Bernhard, Ferraioli and Bevan. For Mr. Smith, in addition to the $750,000 contribution described above, Mr. Smith’s aggregate balance also includes $200,000, plus earnings, related to amounts awarded upon hire in fiscal year 2009. Mr. Smith was not an NEO in fiscal year 2009.
|
37
EMPLOYMENT AGREEMENTS
Each of our NEOs, other than Mr. Smith, is party to an employment agreement. Below are descriptions of the individual employment agreements of our NEOs at August 31, 2012. Descriptions of termination benefits are not included here as they are discussed in detail in the “Potential Payments upon Termination or a Change in Control” section below. Additional information regarding these agreements is also included in “COMPENSATION DISCUSSION AND ANALYSIS” above. Although Mr. Smith is not party to an employment agreement, his offer letter is also summarized below.
J. M. Bernhard, Jr.
Mr. Bernhard serves as the Chairman of our Board, President and Chief Executive Officer under a second amended and restated employment agreement entered into and effective as of December 12, 2011. Unless either party gives written notice to terminate the agreement, the agreement automatically renews on each day of the term for a successive three-year term. The agreement provides that Mr. Bernhard will, among other things, be entitled to:
|
|
(a)
|
an annual base salary as set by our Board, which may be increased on an annual basis by our Board at its discretion, but may not be decreased without Mr. Bernhard’s consent;
|
|
|
(b)
|
discretionary annual cash incentive compensation under any such program established by us, including the MIP, or, in the absence of or in addition to any such program, annual cash incentive compensation as determined by our Board;
|
|
|
(c)
|
participation in our discretionary long-term equity incentive plans;
|
|
|
(d)
|
other benefits including country club memberships and initiation fees, an automobile and a mid-size jet aircraft for his use;
|
|
|
(e)
|
reasonable paid vacation at Mr. Bernhard’s discretion, but not less than five weeks of vacation per year, with unlimited carryover; and
|
|
|
(f)
|
participation in our various employee benefit plans or programs that we provide to our employees in general.
|
Although not provided within his employment agreement, Mr. Bernhard also participates in our Flex Program.
Pursuant to Mr. Bernhard’s employment agreement described above, upon his termination of employment for any reason, he shall receive, as a supplemental executive retirement plan benefit, the sum of $15 million plus interest accrued thereon from the dates of deposit in years 2001, 2002 and 2003. Additional information regarding this benefit is discussed in the “Nonqualified Deferred Compensation” section above.
Brian K. Ferraioli
Mr. Ferraioli serves as Executive Vice President and Chief Financial Officer under an amended and restated employment agreement entered into on December 31, 2008, with an effective date as of January 1, 2008, as further amended by the parties on December 17, 2009. Unless either party gives written notice to terminate the agreement, the agreement automatically renews on each day of the term for a successive two-year term. Under the agreement, Mr. Ferraioli is entitled to:
|
|
(a)
|
an annual base salary in the amount of Mr. Ferraioli’s base salary as of the effective date, which may be increased on an annual basis by our Board at its discretion, but may not be decreased without Mr. Ferraioli’s consent;
|
|
|
(b)
|
participation in our MIP, with an annual performance award range of 0% to 200% of his MIP target, which was initially 100% of his annual base salary, and for fiscal year 2012 was $800,000;
|
|
|
(c)
|
participation in our discretionary long-term equity incentive plans, with a target award that was valued in the range of 100% to 200% of his annual base salary as of the effective date of his agreement, and for fiscal year 2012 was $1,400,000;
|
|
|
(d)
|
initiation fee for a country club membership (not used to date);
|
|
|
(e)
|
participation in our Flex Program;
|
|
|
(f)
|
four weeks of paid vacation per year with unlimited carryover; and
|
|
|
(g)
|
participation in our various employee benefit plans or programs that we provide to our employees in general.
|
38
David L. Chapman, Sr.
Mr. Chapman serves as President of our Fabrication & Manufacturing Group under a new employment agreement entered into and effective as of April 8, 2011. The initial term of the agreement is two years and six months, commencing on the effective date. Approximately half-way through the initial term, the Company and Mr. Chapman shall discuss renewal of the agreement. The initial term may be terminated by Mr. Chapman upon three months’ prior written notice, after which Mr. Chapman shall provide part-time employment services commencing on the date specified (the “Part-Time Employment Period Commencement Date”), for a term ending on the third anniversary of the Part-Time Employment Period Commencement Date (the “Part-Time Employment Period”). Mr. Chapman and the Company may mutually agree to a shorter Part-Time Employment Period. During the Part-Time Employment Period, Mr. Chapman shall perform services, as reasonably requested by the Company, for a minimum of 20 hours per week. Under the agreement, Mr. Chapman is entitled to:
|
|
(a)
|
an annual base salary during the initial term in the amount of Mr. Chapman’s current base salary as of the effective date, which may be increased on an annual basis by the Company at its discretion, but may not be decreased without Mr. Chapman’s consent;
|
|
|
(b)
|
a part-time salary during the Part-Time Employment Period of $450,000 per year, as well as $400 per hour for each hour worked in excess of 20 hours in any week during the Part-Time Employment Period;
|
|
|
(c)
|
participation in our MIP during both the initial term and the Part-Time Employment Period with an annual performance award range of 0% to 200% of his MIP target, which was 133% of his annual base salary for fiscal year 2012, or $1,000,000;
|
|
|
(d)
|
participation in our discretionary long-term equity incentive plans during both the initial term and the Part-Time Employment Period, with a target award that was valued in the range of 100% to 200% of his annual base salary as of the effective date of his agreement, and for fiscal year 2012 was $1,200,000;
|
|
|
(e)
|
reimbursement of operating expenses incurred by Mr. Chapman for the use of his personal aircraft for Company-approved business during both the initial term and the Part-Time Employment Period;
|
|
|
(f)
|
initiation fee for a country club membership;
|
|
|
(g)
|
participation in our Flex Program;
|
|
|
(h)
|
four weeks of paid vacation per year with unlimited carryover during both the initial term and Part-Time Employment Period; and
|
|
|
(i)
|
participation in our various employee benefit plans or programs that we provide to our employees in general, during both the initial term and the Part-Time Employment Period.
|
George P. Bevan
During fiscal year 2012, Mr. Bevan served as President of our Environmental & Infrastructure Group under an amended and restated employment agreement entered into on December 31, 2008, but effective as of November 1, 2008. Unless either party gives written notice to terminate the agreement, the agreement automatically renews on each day of the term for a successive two-year term. Under the agreement, Mr. Bevan is entitled to:
|
|
(a)
|
an annual base salary in the amount of Mr. Bevan’s base salary as of the effective date, which may be increased on an annual basis by our Board at its discretion, but may not be decreased without Mr. Bevan’s consent;
|
|
|
(b)
|
participation in our MIP, with an annual performance award range of 0% to 200% of his MIP target, which was initially 80% of his annual base salary, and for fiscal year 2012 was $615,000;
|
|
|
(c)
|
participation in our discretionary long-term equity incentive plans;
|
|
|
(d)
|
four weeks of paid vacation per year with unlimited carryover, of which the unused portion shall be paid to Mr. Bevan at the end of the term; and
|
|
|
(e)
|
participation in our various employee benefit plans or programs that we provide to our employees in general.
|
Eli Smith
During fiscal year 2012, Mr. Smith did not serve under an employment agreement. He did receive an offer letter upon hire, dated April 21, 2009 and signed April 23, 2009, of which purpose was to clarify the salary, benefits and other key provisions of his employment. The letter does not create an actual or implied contract of employment nor does it change the “employment at will” relationship. Under the terms of the offer letter, Mr. Smith is entitled to:
39
|
|
(a)
|
participation in our MIP, with an annual performance award range of 0% to 200% of his MIP target, which was initially 70% of his base salary and for fiscal year 2012 was $615,833;
|
|
|
(b)
|
participation in our discretionary long-term equity incentive plans, with a target award that was initially valued at 50% of his annual base salary, and for fiscal year 2012 was $635,250;
|
|
|
(c)
|
four weeks of paid vacation per year in accordance with company policy; and
|
|
|
(d)
|
participation in our various employee benefit plans or programs that we provide to our employees in general.
|
POTENTIAL PAYMENTS UPON TERMINATION OR A CHANGE IN CONTROL
This section sets forth information regarding compensation and benefits that each of the NEOs would receive in the event of a change in control without termination of employment or in the event of termination of employment under the following circumstances: (1) voluntary resignation by the NEO; (2) resignation by the NEO for good reason; (3) resignation by the NEO in connection with a change in control; (4) termination by us without cause; (5) termination by us for cause; (6) death; or (7) disability, as determined by the NEOs individual employment agreements, our long-term equity incentive plans or our Deferred Compensation Plan. As of August 31, 2012, Mr. Smith was the only NEO not party to an employment agreement.
The employment agreements of our NEOs generally contain the following definitions as they relate to termination of employment or a change in control:
“Good Reason” shall exist upon the occurrence of any of the following events without the executive’s express written consent: (1) for Messrs. Bernhard and Ferraioli, any material decrease of executive’s duties or responsibilities (other than in connection with the termination of executive for misconduct or disability (as defined below) or, for Mr. Chapman, in connection with the delivery of a notice to commence the Part-Time Employment Period); (2) any material decrease of executive’s base compensation; (3) for Messrs. Bernhard and Ferraioli, our requirement that they perform services at executive offices that are no longer in Baton Rouge, Louisiana, or for Messrs. Chapman and Bevan, that they perform services at a business office more than 25 miles away from their office of employment at the time of the commencement of their employment agreement; or (4) any other material breach by us of any of our obligations to the executive under his employment agreement. An executive must provide written notice to us no more than 90 days after the change in terms or status has occurred, and we shall have 30 days after receipt of the notice to resolve the issue causing the change in terms or status.
“Disability” means that an executive has been absent from the full-time performance of the executive’s duties with us for a period ranging from 90 to 180 consecutive calendar days, as individually specified in each employment agreement, as a result of the executive’s incapacity due to a disability. A disability shall exist if: (1) the executive is unable to engage in any substantial gainful activity by reason of any medically determinable physical or mental impairment that can be reasonably expected to result in death or can be expected to last for a continuous period of not less than 12 months; or (2) the executive is receiving income replacement benefits for a period of not less than three months under any of our employee accident and health plans. The number of days each executive must have been absent from his duties is as follows: Mr. Bernhard, 180 days and Messrs. Ferraioli, Chapman and Bevan, 120 days.
We refer to a change in control in the executive employment agreements as a “Corporate Change.” A Corporate Change means a “change in our ownership,” a “change in our effective control,” or a “change in the ownership of our substantial assets.” A “change in our ownership” shall occur on the date that any one person, or more than one person acting as a group, acquires ownership of our stock that, together with stock held by such person or group, constitutes more than 50% of the total fair market value or total voting power of our stock. A “change in our effective control” shall occur on the date that a majority of the members of our Board is replaced during any 12-month period by directors whose appointment or election is not endorsed by a majority of the members of our Board prior to the date of the appointment or election. A “change in the ownership of our substantial assets” occurs on the date that any one person, or more than one person acting as a group, acquires assets from us that have a total gross fair market value equal to or more than 75% of the total gross fair market value of all of our assets immediately prior to such acquisition or acquisitions. A Corporate Change requires the executive to provide us with notice of his intent to terminate within 90 days following the effective date of the Corporate Change, but in no event later than February 13th of the year following the year in which the applicable Corporate Change occurred.
“Misconduct,” or “Cause,” per Mr. Bernhard’s employment agreement means: (1) the continued failure by Mr. Bernhard to substantially perform his duties with us (other than a failure resulting from his incapacity due to a Disability or any such actual or anticipated failure after the issuance of a notice of termination by Mr. Bernhard for Good Reason), after a written demand for substantial performance is delivered to Mr. Bernhard by our Board, allowing 30 days for him to effect a potential cure; (2) Mr. Bernhard’s engaging in conduct which is demonstrably and materially injurious to us, monetarily or otherwise (other than such conduct resulting from his incapacity due to physical or mental illness and other than any such actual or anticipated conduct after the issuance of a notice of termination by him for Good Reason); or (3) Mr. Bernhard’s conviction for the commission of a felony. The definition of Misconduct, or Cause, in Messrs. Ferraioli, Chapman and Bevan’s employment agreements is somewhat different, and means: (1) any willful breach or habitual neglect of duty or the executive’s material and continued failure to substantially perform his duties for us (other than a failure resulting from the executive’s incapacity due to Disability or any such actual or anticipated failure after the issuance of a notice of termination by the executive for Good Reason) in a professional manner and in a manner reasonably expected as appropriate for the position, which breach is not cured within 30 days of receipt of written notice from us specifying the alleged breach; (2) the intentional misappropriation or attempted misappropriation of a material business opportunity of ours, including an attempt to secure any personal profit in connection with entering into any transaction on behalf of us; (3) the intentional misappropriation or attempted misappropriation of any of our funds or property; (4) the violation of our Code of Corporate Conduct or Anti-Fraud Policy; or (5) the commission of a felony offense or a misdemeanor offense involving violent or dishonest behavior, or the engagement in any other conduct involving fraud or dishonesty.
40
Payments Due under the Named Executive Officer Employment Agreements
Good Reason, Termination without Cause and Corporate Change. The employment agreements with Messrs. Bernhard, Ferraioli and Bevan provide that in the event an executive resigns for Good Reason, is terminated by us without Cause, or resigns for a Corporate Change, the executive will become immediately and fully vested in all long-term equity incentive awards previously granted to that executive, and we must pay to the executive, in a lump sum within 15 days following his applicable termination date, the amounts detailed below. Mr. Chapman’s employment agreement provides the same payments and benefits, but only if he executes a severance agreement and release in which he waives the right to sue the Company for claims relating to his employment:
|
(a)
|
An amount equal to a combination of his base salary and cash incentive compensation: (1) Mr. Bernhard receives an amount equal to three times the sum of his base salary in effect immediately prior to termination plus his highest cash incentive compensation paid by us during the three years prior to termination; (2) Mr. Ferraioli receives an amount equal to two times the sum of his base salary in effect immediately prior to termination plus his most recent annual MIP cash incentive compensation paid by us; (3) Mr. Chapman receives an amount equal to two times his base salary in effect immediately prior to his termination if triggered during the initial term or three times his Part-Time Employment Period salary if triggered during the Part-Time Employment Period (as discussed above under “Employment Agreements”), plus his highest annual cash incentive compensation paid by us during the two years prior to termination; and (4) Mr. Bevan receives his base salary in effect immediately prior to termination plus his most recent annual MIP cash incentive compensation paid by us, both multiplied by the remaining term per his agreement.
|
|
(b)
|
An amount necessary to cover the cost to obtain life, long-term disability, accidental death and dismemberment, health, dental and vision insurance benefits (health and welfare benefits) covering the executive (and, as applicable, his spouse and dependents) that are substantially similar to those that he was receiving immediately prior to termination: (1) Mr. Bernhard receives an amount necessary to cover these costs for a three-year period commencing on the date of termination; (2) Messrs. Ferraioli and Bevan receive an amount necessary to cover these costs for a period commencing on the date of termination and ending on the earlier to occur of (A) a fixed period of time following the executive’s termination, which for Mr. Ferraioli is 24 months, and for Mr. Bevan is 18 months, or (B) in the event that the Company or the executive has given notice to fix the employment agreement term, the remaining portion of the term; and (3) Mr. Chapman receives an amount necessary to cover these costs for an 18 month period commencing on the date of termination.
|
|
(c)
|
For Mr. Bernhard alone, a lump sum payment related to his SERP (as discussed above under “Nonqualified Deferred Compensation”), the use of a mid-size jet aircraft for 150 hours per year for the next ten years and a lump sum equal to the amount necessary to obtain for a three-year period following termination other benefits (including country club dues, automobile allowance and a flexible perquisite benefit) that are substantially similar to those that he was receiving immediately prior to termination.
|
Death. In the event of an executive’s death during the term of his employment agreement, Messrs. Bernhard, Ferraioli and Bevan will be considered immediately and totally vested in all long-term equity incentive awards previously granted to them. Mr. Chapman’s employment agreement does not include immediate and total vesting in the event of death. In the case of Mr. Bernhard’s death, his surviving spouse or estate is entitled to receive, within the 30-day period following his death: (1) a lump sum payment equal to one year’s base salary and a pro-rata MIP cash incentive compensation payment in the amount he would have otherwise been entitled to receive; (2) a lump sum payment equal to the cost to obtain health, dental and vision insurance benefits covering his spouse and dependents that are substantially similar to those that his spouse and dependents were receiving immediately prior to termination for a 30-month period; and (3) a lump sum payment related to his SERP (as discussed above under “COMPENSATION DISCUSSION AND ANALYSIS” and “Nonqualified Deferred Compensation”). In the event of Messrs. Ferraioli, Chapman and Bevan’s death, their surviving spouses or estate will be entitled to a lump sum payment within 30 days of their death equal to the cost to obtain health, dental and vision insurance benefits covering their spouse and dependents that are substantially similar to those that their spouse and dependents were receiving immediately prior to termination, for a one year period for Messrs. Ferraioli and Bevan and an 18 month period for Mr. Chapman.
In addition to the items specified in the executives’ employment agreements, each executive may also be entitled to receive payouts from third parties under certain insurance policies, as more fully described below.
Disability. In the event of an executive’s Disability during the term of his employment agreement, Messrs. Bernhard, Ferraioli and Bevan will be considered immediately and totally vested in all long-term equity incentive awards previously granted to them. Mr. Chapman’s employment agreement does not include immediate and total vesting in the event of his disability, but the grant agreements under which his long-term equity incentive awards were granted do allow for accelerated vesting in the event of disability. We will also pay the following benefits to the executives:
|
(a)
|
Monthly payments equal to the amount by which the executive’s monthly base salary immediately prior to termination exceeds the monthly benefit received pursuant to any disability insurance covering him; the applicable term of payment is 12 months for Messrs. Bernhard, Chapman and Bevan and 24 months for Mr. Ferraioli. Mr. Chapman’s employment agreement provides these monthly payments only if he executes a severance agreement and release in which he waives the right to sue the Company for claims relating to his employment.
|
|
(b)
|
For Messrs. Bernhard, Ferraioli and Bevan, a lump sum payment within 15 days of the executive’s termination equal to the cost to obtain health and dental insurance benefits covering the executive (and, as applicable, his spouse and dependents) that are substantially similar to those that the executive was receiving immediately prior to termination. The amount we pay should cover a period of 30 months for Mr. Bernhard; for Messrs. Ferraioli and Bevan, the period shall begin with the termination date and end with the earlier to occur of (1) a fixed period of time following the date of termination, 24 months for Mr. Ferraioli, or 18 months for Mr. Bevan, or (2) in the event that the Company or the executive has given notice to fix the employment agreement term, the remaining portion of the term.
|
|
(c)
|
For Mr. Bernhard alone, on or before the later to occur of either the fifteenth day following the day we typically grant annual MIP cash incentive compensation awards or February 28th of the year following his termination, a pro-rata MIP cash incentive compensation payment in the amount Mr. Bernhard would have otherwise been entitled to receive under the terms of the applicable incentive plans. Mr. Bernhard is also entitled to a lump sum payment equal to the value in his SERP (as discussed above under “Nonqualified Deferred Compensation”) as well as the use of a mid-size jet aircraft for 150 hours per year for the next ten years.
|
41
In addition to the items specified in the executive’s employment agreements, each executive may also be entitled to receive payouts from third parties under certain insurance policies, as more fully described below.
Confidentiality and Noncompetition Agreements. Each of our NEOs has agreed not to reveal our confidential information during and after termination of employment with us. In addition, we have entered into agreements with each of Messrs. Bernhard, Chapman and Bevan that provide for post-employment non-competition and non-solicitation obligations. Specifically, the agreements provide that at all times during the executive’s employment and for two years following termination (or, in the case of Messrs. Bernhard and Chapman, the period of severance pay under such executive’s employment agreement (but no longer than two years) upon certain terminations of employment), the respective executive will not compete with Shaw (whether as an employee, owner, partner or otherwise) in specified lines of business or otherwise invest in or provide services to competitors of Shaw. In addition, the agreements provide that at all times during the executive’s employment and for two years following termination, the executive will not solicit or offer employment to any individual who was an employee or officer of Shaw or its affiliates during the six months immediately preceding such solicitation or offer of employment.
Mitigation. The executives are not required to mitigate the amount of any severance payments described above by seeking other employment, nor will the amount of payments we are required to provide to the executives be reduced by any compensation the executives may earn as a result of employment with a third-party employer during any severance payment periods.
Information Regarding the Potential Payments Upon Termination or Change in Control Table
The following table sets forth the details, on an executive-by-executive basis, of the estimated compensation and benefits that would be provided to each NEO in the event that such executive’s employment with us is terminated for any reason or in the event of a change in control. We have assumed that the termination events, or the change in control, as applicable, occurred effective August 31, 2012, the last day of our fiscal year. The actual amounts that would be paid can only be determined at the time of termination of employment or a change in control. The amounts included in the table are based on the following assumptions and governing documents:
Governing Documents. The amounts included in the table are based on provisions included in the following:
|
|
·
|
The employment agreements between the NEOs and us, which are summarized under “Employment Agreements” and above.
|
|
|
·
|
Our long-term equity incentive plans, which are summarized below, and the related long-term incentive award agreements between the NEOs and us.
|
|
|
·
|
Our Deferred Compensation Plan, which is summarized under “Nonqualified Deferred Compensation” above.
|
Resignation versus Retirement. The designation of an event as a resignation or retirement is dependent upon an individual’s age. We use the normal retirement age, as defined by the Social Security Administration, to determine when an employee is eligible for retirement. For our NEOs, the normal retirement age is 66 or older. An individual who does not satisfy the retirement criteria is considered to have resigned. At August 31, 2012, only one of our named executive officers, Mr. Chapman, has met the eligibility criteria for retirement.
Change in Control. All references to a “Change in Control” in the table below refer to the change in control definition that is relevant to the applicable employment agreement, long-term equity incentive plan or non-qualified deferred compensation plan being discussed, whether it is a Corporate Change, either of the Change in Control definitions found in the 2001 Incentive Plan or Omnibus Plan or the Change in Control definition found in our Deferred Compensation Plan.
|
|
·
|
Employment Agreements — The compensation and benefits associated with a resignation for a Corporate Change are set forth in each individual employment agreement. The agreements for Messrs. Bernhard and Ferraioli provide these executives with an election to terminate employment for a Corporate Change. Messrs. Chapman and Bevan may also terminate employment for a Corporate Change but only if they are not retained in their current or a comparable position.
|
|
|
·
|
Long-Term Equity Incentive Plans — The 2001 Incentive Plan and Omnibus Plan and related agreements address the benefits that our executives are entitled to receive in connection with a Change in Control (as defined below) without termination.
|
|
|
·
|
Non-Qualified Deferred Compensation Plan – The Deferred Compensation Plan addresses the benefits that our executives are entitled to receive in connection with a Change in Control (as defined above under “Nonqualified Deferred Compensation) without termination.
|
Insurance Proceeds and Benefits. We provide life insurance and accidental death and dismemberment insurance to certain executives, including our NEOs, both with a benefit of two times the executive’s annual base salary up to a maximum of $750,000 each. The amount provided to all other salaried employees only includes a benefit of one times the employee’s annual base salary up to a maximum of $100,000 each. We also provide business travel accidental death and dismemberment insurance to certain executives, including our NEOs, with a principal sum benefit amount up to a maximum of $750,000. The amount provided to all other salaried employees only includes a principal sum benefit amount up to a maximum of $500,000. Amounts included in the tables below will not be paid by us; they are simply additional amounts the NEOs may be entitled to receive from the third party insurance providers. In the event of death, life insurance, accidental death and dismemberment insurance and business travel accidental death and dismemberment insurance benefits are paid by our third party insurance providers directly to the beneficiary designated by the employee. In the event of disability, accidental death and dismemberment insurance, business travel accidental death and dismemberment insurance and long-term disability insurance benefits are paid by our third party insurance providers directly to the employee.
42
Continuing Health and Welfare Benefits. We have calculated health, dental and vision insurance benefits at the COBRA rates in effect at August 31, 2012. We have calculated life, long-term disability and accidental death and dismemberment insurance benefits at the Company’s rates in effect at August 31, 2012.
Nonqualified Deferred Compensation. As noted previously in the “COMPENSATION DISCUSSION AND ANALYSIS” and “Nonqualified Deferred Compensation” sections above, three of our NEOs, Messrs. Ferraioli, Bevan and Smith, received discretionary employer contributions under the Deferred Compensation Plan during fiscal year 2012. Also, during fiscal year 2012, we converted a $15 million, plus accumulated interest, deferred compensation award that was owed to Mr. Bernhard to a SERP. We have only included in the tables any payment of the aggregate balances shown in the Nonqualified Deferred Compensation Table that was accelerated in connection with a termination event. Please note that such amounts set forth below are no more than those reflected in the Nonqualified Deferred Compensation table, and that such balances will only be paid once. The tables below do not include amounts related to Mr. Bernhard’s SERP, as the full balance vested prior to August 31, 2012.
Reimbursement of Excise Tax and Gross-up. As of August 31, 2012, Messrs. Ferraioli and Bevan were eligible to receive a payment in an amount necessary to offset any excise tax imposed under the Internal Revenue Code on payments received under the change in control termination scenario and any other excise or regular income taxes imposed on them as a result of this initial excise tax reimbursement. To the extent that any payment or benefit received or to be received by these NEOs under their employment agreements in connection with a change in control would constitute an “excess parachute payment” (as defined in Section 280G of the Internal Revenue Code) subject to the excise tax imposed by Section 4999 of the Internal Revenue Code, we must “gross-up” such payment and benefit by paying to the executive additional amounts (gross-up payments), which must include any excise taxes and income taxes imposed upon such gross-up payments, so that the executive is in the same “net” after-tax position he would have been if such payment, benefit and gross-up payments had not constituted excess parachute payments. Messrs. Bernhard and Chapman were not eligible to receive a reimbursement of excise tax or gross up payment under their agreements. Instead, if any payments or benefits received or to be received by Messrs. Bernhard or Chapman in connection with their terminations of employment would constitute an “excess parachute payment,” an independent tax advisor would determine whether (a) such payments should be reduced to the extent necessary so that no portion would be subject to the excise tax or (b) Messrs. Bernhard and Chapman would receive, in the aggregate, greater payments and benefits on an after tax basis if the payments were not reduced, in which case, no such reduction would be made.
Section 409A of the Code. Notwithstanding the timing of payments otherwise noted in this section, if the executive in question is a “specified employee” as defined in Section 409A of the Internal Revenue Code at the date of his termination, any amounts that are considered subject to the deferred compensation rules of such Internal Revenue Code section shall not be paid until a period of six months from the date of his separation of service with us has passed. We expect that each of our NEOs would be considered “specified employees” at the time of their termination from employment.
Reimbursement of Expenses & Accrued Vacation. We have assumed that all reimbursements of expenses are current and that all vacation has been taken at August 31, 2012; therefore, amounts related to expenses and accrued vacation for all NEOs are excluded from the tables below.
Accelerated Vesting of Stock Options, Restricted Stock Units and Performance Cash Units. We have assumed that the value of our common stock for purposes of valuing stock options and RSUs was $42.08 per share based on the closing market price on August 31, 2012, the last trading day of our fiscal year, and that all unvested stock options not automatically forfeited were exercised on such day. We have not included in the tables the value of any stock options that were vested prior to August 31, 2012. We have assumed that the PCUs will be paid out at the maximum level (200% of the target award) based on the level of performance achieved and certified by the Compensation Committee for the fiscal year 2012 performance cycle. In addition, we have applied the following provisions from our long-term equity incentive plans to the tables below.
Our 2001 Incentive Plan provides for the immediate vesting of restricted stock in the event of retirement, death or disability, and the immediate vesting of restricted stock, restricted stock units and stock options upon a Change in Control; each of these terms are defined below as they are used in the 2001 Incentive Plan, and may differ from the definitions provided for the same terms in the employment agreements of our NEOs. Our 2001 Incentive Plan also gives the Compensation Committee the discretion to allow for immediate vesting of stock options. In April 2006, the Compensation Committee approved the immediate vesting of stock options in the event of death for all existing awards and future awards granted under our 2001 Incentive Plan.
|
|
·
|
“Retirement” shall mean the participant’s voluntary retirement on or after the participant’s normal retirement date as determined by the Compensation Committee in its sole discretion.
|
|
|
·
|
“Disability” shall mean the inability of the participant to engage in any substantial, gainful activity by reason of any medically determinable physical or mental impairment which can be expected to result in death or which has lasted or can be expected to last for a continuous period of 12 months or more.
|
|
|
·
|
“Change in Control” shall mean the occurrence of any of the following events: (1) any “person” or “group” as defined in the Exchange Act, as amended, but excluding any 10% or larger shareholder of record, directly or indirectly, becomes the “beneficial owner” (as defined in the Exchange Act, as amended) of our securities representing 20% or more of the combined voting power of all of our then outstanding securities which are entitled to vote with respect to the election of our Board; (2) during a period of 24 consecutive months, the individuals who, at the beginning of such period, constitute our Board cease for any reasons other than death or disability to constitute a majority of our Board (unless the individual was elected by or with the recommendation of at least two-thirds of the directors of our Board at the beginning of such 24-month period); (3) an entity other than us or a subsidiary of us acquires all or substantially all of our assets; or (4) we file a report or a proxy statement with the SEC disclosing that a change in control may have, has, or will occur.
|
Our Omnibus Plan provides for immediate vesting of share based awards only upon a Change in Control. The following types of awards qualify for immediate vesting: (a) all stock options, including those awarded to our non-employee directors, and SARs (unless exchanged for qualifying replacement awards); and (b) all awards other than stock options and SARs that are not vested and as to which vesting depends solely upon satisfaction by a participant of a service obligation. For all other awards, treatment upon a Change in Control shall be determined by the applicable award agreement.
43
|
|
·
|
“Change in Control” shall mean the occurrence of any of the following events: (1) any person becomes the beneficial owner of 50% or more of our voting securities; (2) any person acquires assets from us that have a total gross fair market value equal to or more than 75% of the total gross fair market value of all our assets immediately prior to such acquisition; or (3) our directors cease to constitute a majority of our Board during any given twelve-month period unless a majority of the directors in office at the beginning of that period approved the nomination of any new director.
|
The amounts in the table below are as of August 31, 2012, and do not reflect any changes in compensation occurring after this date.
Potential Payments Upon Termination or Change in Control Table
| Executive and Compensation Element |
Voluntary
Resignation,
including
Retirement
|
Resignation by
Executive for
Good Reason or Termination by the Company (other than for Misconduct or Disability)
|
Termination
by the
Company for
Misconduct
|
Death
|
Disability
|
Resignation by Executive in Connection with a Change in Control (15)
|
||||||||||||||||||
| J. M. Bernhard, Jr. | ||||||||||||||||||||||||
|
Base salary
|
$ | — | $ | 6,000,000 | (2) | $ | — | $ | 2,000,000 | (3) | $ | 1,880,000 | (4) | $ | 6,000,000 | (2) | ||||||||
|
Incentive compensation
|
— | 19,800,000 | (5) | — | 6,600,000 | (6) | 3,300,000 | (6) | 19,800,000 | (5) | ||||||||||||||
|
Insurance proceeds and benefits
|
— | — | — | 2,250,000 | (7) | 2,292,197 | (8) | — | ||||||||||||||||
|
Continuing health & welfare benefits
|
— | 65,556 | (9) | — | 28,812 | (10) | 49,831 | (11) | 65,556 | (9) | ||||||||||||||
|
Accelerated vesting of RSUs, stock options and PCUs (12)
|
— | 23,360,048 | — | 23,360,048 | 23,360,048 | 23,360,048 | ||||||||||||||||||
|
SERP (13)
|
— | — | — | — | — | — | ||||||||||||||||||
|
Other benefits
|
4,873,000 | (14) | 5,230,660 | (14) | — | — | 4,873,000 | (14) | 5,230,660 | (14) | ||||||||||||||
|
TOTAL
|
$ | 4,873,000 | $ | 54,456,264 | $ | — | $ | 34,238,860 | $ | 35,755,076 | $ | 54,456,264 | ||||||||||||
|
Brian K. Ferraioli
|
||||||||||||||||||||||||
|
Base salary
|
$ | — | $ | 1,300,000 | (2) | $ | — | $ | — | $ | 1,056,000 | (4) | $ | 1,300,000 | (2) | |||||||||
|
Incentive compensation
|
— | 3,200,000 | (5) | — | — | — | 3,200,000 | (5) | ||||||||||||||||
|
Insurance proceeds and benefits
|
— | — | — | 2,250,000 | (7) | 2,435,113 | (8) | — | ||||||||||||||||
|
Continuing health & welfare benefits
|
— | 31,440 | (9) | — | 8,066 | (10) | 27,597 | (11) | 31,440 | (9) | ||||||||||||||
|
Accelerated vesting of RSUs, stock options and PCUs (12)
|
— | 6,710,415 | — | 6,710,415 | 6,710,415 | 6,710,415 | ||||||||||||||||||
|
Nonqualified deferred compensation (16)
|
— | — | — | 1,066,654 | 1,066,654 | 1,066,654 | ||||||||||||||||||
|
Reimbursement of Excise Tax and Gross-Up (17)
|
— | — | — | — | — | 2,699,861 | ||||||||||||||||||
|
TOTAL
|
$ | — | $ | 11,241,855 | $ | — | $ | 10,035,135 | $ | 11,295,779 | $ | 15,008,370 | ||||||||||||
|
David L. Chapman, Sr. (1)
|
||||||||||||||||||||||||
|
Base salary
|
$ | — | $ | 1,500,000 | (2) | $ | — | $ | — | $ | 626,000 | (4) | $ | 1,500,000 | (2) | |||||||||
|
Incentive compensation
|
— | 1,000,000 | (5) | — | — | — | 1,000,000 | (5) | ||||||||||||||||
|
Insurance proceeds and benefits
|
— | — | — | 2,250,000 | (7) | 1,740,000 | (8) | — | ||||||||||||||||
|
Continuing health & welfare benefits
|
— | 23,994 | (9) | — | 12,374 | (10) | — | 23,994 | (9) | |||||||||||||||
|
Accelerated vesting of RSUs, stock options and PCUs (12)
|
371,398 | 5,964,333 | — | 721,718 | 5,614,013 | 5,964,333 | ||||||||||||||||||
|
TOTAL
|
$ | 371,398 | $ | 8,488,327 | $ | — | $ | 2,984,092 | $ | 7,980,013 | $ | 8,488,327 | ||||||||||||
|
George P. Bevan
|
||||||||||||||||||||||||
|
Base salary
|
$ | — | $ | 1,230,000 | (2) | $ | — | $ | — | $ | 491,000 | (4) | $ | 1,230,000 | (2) | |||||||||
|
Incentive compensation
|
— | 922,500 | (5) | — | — | — | 922,500 | (5) | ||||||||||||||||
|
Insurance proceeds and benefits
|
— | — | — | 2,250,000 | (7) | 1,800,000 | (8) | — | ||||||||||||||||
|
Continuing health & welfare benefits
|
— | 23,994 | (9) | — | 8,249 | (10) | 21,114 | (11) | 23,994 | (9) | ||||||||||||||
|
Accelerated vesting of RSUs, stock options and PCUs (12)
|
— | 4,164,633 | — | 4,164,633 | 4,164,633 | 4,164,633 | ||||||||||||||||||
|
Nonqualified deferred compensation (16)
|
— | — | — | 823,554 | 823,554 | 823,554 | ||||||||||||||||||
|
Reimbursement of Excise Tax and Gross-Up (17)
|
— | — | — | — | — | 1,332,198 | ||||||||||||||||||
|
TOTAL
|
$ | — | $ | 6,341,127 | $ | — | $ | 7,246,436 | $ | 7,300,301 | $ | 8,496,879 | ||||||||||||
|
Eli Smith
|
||||||||||||||||||||||||
|
Base salary
|
$ | — | $ | — | $ | — | $ | — | $ | — | $ | — | ||||||||||||
|
Incentive compensation
|
— | — | — | — | — | — | ||||||||||||||||||
|
Insurance proceeds and benefits
|
— | — | — | 2,250,000 | (7) | 1,500,000 | (8) | — | ||||||||||||||||
|
Continuing health & welfare benefits
|
— | — | — | — | — | — | ||||||||||||||||||
|
Accelerated vesting of RSUs, stock options and PCUs (12)
|
— | — | — | 2,474,314 | 2,498,747 | 1,228,247 | ||||||||||||||||||
|
Nonqualified deferred compensation (16)
|
— | — | — | 1,110,867 | 1,110,867 | 1,110,867 | ||||||||||||||||||
|
TOTAL
|
$ | — | $ | — | $ | — | $ | 5,835,181 | $ | 5,109,614 | $ | 2,339,114 |
44
|
(1)
|
For Mr. Chapman, we are assuming that the Part-Time Employment Period (as discussed above under “Employment Agreements”) has not already commenced, as three months’ written notice would be required and no such notice had been received as of August 31, 2012, and therefore that his termination occurred during the initial term of his agreement. We are also assuming that he executed a severance agreement and release, waiving his right to sue the Company for claims relating to his employment, as required by his employment agreement, in exchange for certain severance payments and benefits.
|
|
(2)
|
Represents a lump sum payment of the NEO’s base salary at August 31, 2012, multiplied by the following: | |
|
–Mr. Bernhard: A fixed amount of three.
|
||
|
–Mr. Ferraioli: A fixed amount of two.
|
||
|
–Mr. Chapman: A fixed amount of two.
–Mr. Bevan: The remaining term of his employment agreement – 2 years.
|
||
|
(3)
|
For Mr. Bernhard, represents a lump sum payment of one year of the NEO’s annual base salary at August 31, 2012. | |
|
(4)
|
Represents monthly payments of the amount by which the NEO’s monthly base salary exceeds the monthly benefit received pursuant to any disability insurance. The monthly benefit for short-term disability insurance is calculated as 66.6% of each participant’s base salary, with a maximum weekly benefit of $3,000. The monthly benefit for long-term disability insurance is calculated as 60% of each participant’s base salary, with a maximum monthly benefit of $10,000. Monthly payments will be made for a period of one year for Mr. Bernhard, Mr. Chapman and Mr. Bevan and for a period of two years for Mr. Ferraioli. | |
|
(5)
|
For Mr. Bernhard, represents a lump sum payment of the highest cash incentive compensation paid in the last three fiscal years multiplied by three. For Mr. Ferraioli, represents a lump sum payment of the most recent annual MIP cash incentive compensation paid multiplied by two. For Mr. Chapman, represents a lump sum payment of the highest annual cash incentive compensation paid during the two-year period prior to termination. For Mr. Bevan, represents a lump sum payment of the most recent annual MIP cash incentive compensation paid multiplied by the remaining term of his agreement, as noted in (1) above. | |
|
(6)
|
In the event of Mr. Bernhard’s death, represents a lump sum payment of the full amount expected to be paid for fiscal year 2012 performance under our MIP. In the event of Mr. Bernhard’s disability, represents a lump sum payment of half of the amount expected to be paid for fiscal year 2012 performance under our MIP. As described above, in order for us to have terminated Mr. Bernhard on August 31, 2012, for Disability, he must have been absent from the full-time performance of his duties for 180 consecutive calendar days. Therefore, at August 31, 2012, Mr. Bernhard would only have been entitled to receive a MIP cash incentive compensation payment for the portion of the year (approximately six months) that he actually worked prior to becoming disabled. | |
|
(7)
|
Represents amounts that are payable by our third party insurance providers. Amounts paid in accordance with our accidental death and dismemberment insurance policy will only be paid in the event that death is accidental; amounts paid in accordance with our business travel accidental death and dismemberment insurance policy will only be paid in the event that death is accidental and occurred while traveling for business purposes. Therefore, amounts shown are likely higher than those that will actually be paid. For all NEOs, the amounts in the table include benefits of: | |
| – |
Two times each NEO’s annual base salary, capped at $750,000 (payable in accordance with our life insurance policy);
|
|
| – |
Two times each NEO’s annual base salary, capped at $750,000 (payable in accordance with our accidental death and dismemberment insurance policy); and
|
|
| – | A principal sum of $750,000 (payable in accordance with our business travel accidental death and dismemberment insurance policy). | |
|
(8)
|
Represents amounts that are payable by our third party insurance providers. Amounts paid in accordance with our accidental death and dismemberment insurance policy will only be paid in the event that disability is caused by dismemberment; amounts paid in accordance with our business travel accidental death and dismemberment insurance policy will only be paid in the event that disability is caused by dismemberment that occurred while traveling for business purposes. Therefore, amounts shown are likely higher than those that would actually be paid. The table above includes payments of: | |
| – |
Disability benefits to each NEO (calculated in accordance with our long-term disability plan);
|
|
| – |
Two times each NEO’s annual base salary, capped at $750,000 (payable in accordance with our accidental death and dismemberment insurance policy); and
|
|
| – | A principal sum of $750,000 (payable in accordance with our business travel accidental death and dismemberment insurance policy). | |
45
|
(9)
|
Represents a lump sum payment for the cost to obtain health and welfare benefits for each NEO that are substantially similar to those that the NEO was receiving immediately prior to termination for the periods specified below:
|
|
–Mr. Bernhard: 3 years from date of termination
|
|
|
–Mr. Ferraioli: 2 years from date of termination
|
|
|
–Mr. Chapman: 18 months from date of termination
|
|
|
–Mr. Bevan: 18 months from date of termination
|
|
|
(10)
|
Represents a lump sum payment for the cost to obtain health, dental and vision insurance benefits covering the NEO’s spouse and dependents, if any, that are substantially similar to those that the NEO was receiving immediately prior to termination in the event of death. The coverage period is 30 months for Mr. Bernhard, one year for Messrs. Ferraioli and Bevan and 18 months for Mr. Chapman. See the narrative above the table for additional information.
|
|
(11)
|
Represents a lump sum payment for the cost to obtain health, dental and vision insurance benefits that are substantially similar to those that the NEO was receiving immediately prior to termination for the coverage periods specified below:
|
|
–Mr. Bernhard: 30 months
|
|
|
–Mr. Ferraioli: 24 months
|
|
|
–Mr. Bevan: 18 months
|
|
|
See the narrative above the table for additional information.
|
|
|
(12)
|
Messrs. Bernhard, Ferraioli, Chapman (only for the scenarios specified below) and Bevan’s employment agreements provide for accelerated vesting of stock options, RSUs and PCUs. Mr. Smith does not have an employment agreement and Mr. Chapman’s employment agreement does not provide for accelerated vesting in the event of Death or Disability; however, our long-term incentive plans and/or individual grant agreements provide for accelerated vesting in the event of Disability, Death or a Change in Control. The table below provides the number of stock options, RSUs and PCUs used to determine the value estimated to be realized upon accelerated vesting in accordance with:
- the employment agreements of Messrs. Bernhard, Ferraioli, Chapman and Bevan,
- the Death and Disability provisions in our long-term incentive plans and/or individual grant agreements for Messrs. Chapman and Smith, (as noted above, Mr. Chapman’s employment
agreement does not provide for accelerated vesting in the event of Death or Disability and Mr. Smith does not have an employment agreement),
- the Retirement provisions in our long-term incentive plans and/or individual grant agreements for Mr. Chapman. Mr. Chapman has met the eligibility criteria for retirement as of August 31, 2012.
|
|
Named Executive
Officers |
Termination
Scenario |
Stock
Options |
Restricted
Stock Units |
Performance
Cash Units |
|
J. M. Bernhard, Jr.
|
All scenarios with amounts in the table above
|
251,901
|
240,859
|
9,400,000
|
|
Brian K. Ferraioli
|
All scenarios with amounts in the table above
|
68,621
|
69,541
|
2,800,000
|
|
David L. Chapman, Sr.
|
All scenarios with amounts in the table above except Retirement, Death and Disability
|
64,316
|
61,497
|
2,400,000
|
|
Retirement
|
—
|
8,826
|
—
|
|
|
Death
|
14,482
|
8,826
|
—
|
|
|
Disability
|
49,834
|
61,497
|
2,400,000
|
|
|
George P. Bevan
|
All scenarios with amounts in the table above
|
44,350
|
42,826
|
1,700,000
|
|
Eli Smith
|
Death
|
18,828
|
23,784
|
1,270,500
|
|
Disability
|
16,960
|
23,784
|
1,270,500
|
| The value of stock options was estimated by multiplying the number of accelerated “in-the-money” stock options by the difference between $42.08, the closing price of our common stock on August 31, 2012, and the stated exercise price of the stock options. The value of RSUs was estimated by multiplying the number of RSUs, for which vesting was accelerated, by $42.08, the closing price of our common stock on August 31, 2012. The value of PCUs was estimated by multiplying the number of PCUs, for which vesting was accelerated, by one dollar (the value of each earned performance cash unit). For all termination scenarios except the Change in Control scenario, the number of PCUs was determined to be 200% of each executive’s target award based on the level of performance achieved as of August 31, 2012. For the Change in Control scenario, the number of PCUs was determined to be 200% of each executive’s target award based on the level of performance achieved as of August 31, 2012 and the subsequent Change in Control calculation specified in the applicable grant agreement. See Note 15 below for additional details on accelerated vesting in accordance with our long-term incentive plans in the event of a Change in Control. |
46
| (13) | Upon termination or a Corporate Change, Mr. Bernhard is entitled to receive a lump sum payment, totaling $18,739,816, the value of his SERP at August 31, 2012. For additional information, see “COMPENSATION DISCUSSION AND ANALYSIS” and “Nonqualified Deferred Compensation” above. Please note that we have not included the amount in the table above, as it is was fully vested as of August 31, 2012 and already reflected in the Nonqualified Deferred Compensation table. | |
| (14) | Under certain termination scenarios, Mr. Bernhard will be entitled to the use of a mid-size jet aircraft (which shall mean a jet aircraft comparable to but not less than the jet aircraft most commonly used by Mr. Bernhard in the year prior to the date of termination) for 150 hours per year for the next ten years. The amount above represents the estimated incremental cost at August 31, 2012, of his aircraft usage assuming the maximum number of hours is used each year. If Mr. Bernhard does not use the full 150 hours allowed each year, the actual cost incurred by us may be less than the total amount listed. If Mr. Bernhard terminates employment for Good Reason, Termination without Cause or for a Corporate Change, he will also be entitled to a lump sum payment equal to the amount necessary to obtain for a three-year period following termination other benefits that are substantially similar to those that he was receiving immediately prior to termination, including country club dues, an automobile allowance and a flexible perquisite benefit. | |
| (15) | The compensation and benefits reflected in this column for a Corporate Change for Messrs. Bernhard and Ferraioli are considered to be “single trigger” because the executives will each be entitled to resign for any reason during the 90 days following the Corporate Change and receive the amounts above under the terms of their employment agreements. The compensation and benefits reflected in this column for a Corporate Change for Messrs. Chapman and Bevan are considered to be “double trigger” because the executives will only be entitled to receive these amounts upon certain qualifying terminations of employment described above in “EXECUTIVE COMPENSATION - Employment Agreements.” Also, in the case of Mr. Chapman, these “double trigger” amounts are subject to his execution of a release of claims. Mr. Smith does not have an employment agreement, so the amounts reflected in this column are in accordance with the benefits outlined in the bullets below. | |
| In the event that Messrs. Chapman or Bevan do not elect to terminate employment following a Corporate Change, they would only be entitled to the following benefits: | ||
| - |
the immediate vesting of non-qualified deferred compensation awards under our Deferred Compensation Plan,
|
|
| - | the immediate vesting of RSUs and stock options under our 2001 Incentive Plan and | |
| - | the immediate vesting of RSUs and stock options (assuming that replacement awards are not issued) under our Omnibus Plan. | |
| The table below reflects the nonqualified deferred compensation and values estimated to be realized upon accelerated vesting in connection with a Corporate Change without termination of employment, as well as the number of options/units that would be accelerated for Messrs. Chapman, Bevan and Smith. The calculations laid out in Note 12 were used to determine the value estimated to be realized upon accelerated vesting of long-term incentive awards. | ||
|
Named Executive Officer
|
Nonqualified
Deferred |
Accelerated
Vesting of |
Stock
Options |
Restricted
Stock Units |
Performance
Cash Units |
|
($)
|
($)
|
(#)
|
(#)
|
(#)
|
|
|
David L. Chapman, Sr.
|
—
|
3,564,333
|
64,316
|
61,497
|
—
|
|
George P. Bevan
|
823,554
|
2,464,633
|
44,350
|
42,826
|
—
|
|
Eli Smith
|
1,110,867
|
1,228,247
|
18,828
|
23,784
|
—
|
| (16) | Represents a lump sum payment resulting from accelerated vesting in accordance with our Deferred Compensation Plan (acceleration occurs in the event of death, disability or change in control). See “Nonqualified Deferred Compensation” and the narrative above for additional information. Please note that the amounts in the table above are the same as the amounts included in the Nonqualified Deferred Compensation table, and they will only be paid out once. We are including the amounts here again since vesting is accelerated under certain termination scenarios. |
| (17) | Represents the amounts that would be payable to Mr. Ferraioli and Mr. Bevan on August 31, 2012, in accordance with their employment agreements, to offset any excise tax imposed under the Internal Revenue Code on payments received under the change in control termination scenario and other excise or regular income taxes imposed on the executive as a result of this initial excise tax reimbursement. |
47
DIRECTOR COMPENSATION
Director Compensation
Our director compensation program is intended to attract and retain directors with demonstrated ability, integrity, judgment, and experience to fulfill their responsibility to oversee management and to develop and oversee the implementation of strategies aimed at creating sustainable long-term value for our shareholders. The program is also intended to recognize the time commitments and responsibilities associated with serving on the board of directors of a public company.
The form and amount of director compensation is periodically reviewed and assessed by our Compensation Committee. Our Compensation Committee reviews data concerning director compensation practices, levels, and trends for companies comparable to the Company in revenue, lines of business, and complexity. This data is provided by our compensation consultant, Pay Governance, LLC. Changes to director compensation, if any, are recommended by our Compensation Committee for action. Employee directors are not compensated for service as a director.
Non-Employee Director Compensation
Fees Earned. For services rendered during fiscal year 2012, our non-employee directors received the following fees, as applicable:
|
|
·
|
Board Cash Retainer. $110,000 annual cash retainer, payable on a calendar year quarterly basis;
|
|
|
·
|
Audit Committee Chairman. $25,000 annual cash retainer, payable on a calendar year quarterly basis;
|
|
|
·
|
Compensation Committee Chairman. $5,000 annual cash retainer, payable on a calendar year quarterly basis;
|
|
|
·
|
Nominating and Corporate Governance Committee Chairman. $5,000 annual cash retainer, payable on a calendar year quarterly basis; and
|
|
|
·
|
Lead Director. $5,000 annual cash retainer, payable on a calendar year quarterly basis.
|
Equity Compensation. Consistent with our past practice, on January 25, 2012, each of our non-employee directors received RSUs with respect to 3,713 shares of our common stock.
Our Compensation Committee and our Board approved the methodology used to determine the fiscal year 2012 equity awards to our non-employee directors. Each equity award had an aggregate value of $105,000, and was granted entirely in the form of RSUs.
Expense Reimbursement. We reimburse our non-employee directors for travel and out-of-pocket expenses incurred in connection with attendance at Board and Committee meetings, other meetings on our behalf, and director education programs.
Stock Ownership Policy for Non-Employee Directors
Beginning January 1, 2010, our Corporate Governance Principles required each non-employee member of our Board to retain ownership of a minimum of 25% of the shares of stock-based awards received through our long-term equity incentive compensation plans, with flexibility for tax considerations, until the non-employee director retires or otherwise ceases serving as a member of our Board.
48
The following table sets forth information regarding fiscal year 2012 compensation for non-employee directors:
Non–Employee Director Compensation for the Fiscal Year Ended August 31, 2012
|
Name
|
Fees Earned
or Paid in
Cash
(1)
|
Stock
Awards
(2)
|
Option
Awards
(3)
|
Total
|
||||||||||||
|
James F. Barker*
|
$ | 110,000 | $ | 105,004 | $ | — | $ | 215,004 | ||||||||
|
Thos. E. Capps
|
110,000 | 105,004 | — | 215,004 | ||||||||||||
|
Daniel A. Hoffler
|
115,000 | 105,004 | — | 220,004 | ||||||||||||
|
David W. Hoyle
|
120,000 | 105,004 | — | 225,004 | ||||||||||||
|
Michael J. Mancuso
|
135,000 | 105,004 | — | 240,004 | ||||||||||||
|
Albert D. McAlister
|
110,000 | 105,004 | — | 215,004 | ||||||||||||
|
Stephen R. Tritch
|
110,000 | 105,004 | — | 215,004 | ||||||||||||
|
(1)
|
Amounts shown in this column reflect the total cash compensation earned by or paid to each non-employee director in fiscal year 2012 in connection with Board and Committee retainers.
|
|
(2)
|
This column represents the total grant date fair value, computed in accordance with Accounting Standards Codification Topic 718 Compensation — Stock Compensation (ASC 718), of stock awards granted during fiscal year 2012. The fair value of stock awards is calculated using the last quoted sale price of a share of our common stock on the NYSE on the grant date.
|
|
As of August 31, 2012, our non-employee directors had the following aggregate number of unvested stock awards: Mr. Barker — 5,146; Mr. Capps — 5,146; Mr. Hoffler — 5,146; Secretary Hoyle — 5,146; Mr. Mancuso — 5,146; Mr. McAlister — 5,146; and Mr. Tritch — 5,146.
|
|
|
(3)
|
We did not grant any stock options to our non-employee directors during fiscal year 2012.
|
|
As of August 31, 2012, our non-employee directors held the following aggregate number of outstanding (vested and unvested) option awards: Mr. Barker — 13,159; Mr. Capps — 8,481; Mr. Hoffler — 10,659; Secretary Hoyle — 15,987; Mr. Mancuso — 9,590; Mr. McAlister — 15,987; and Mr. Tritch — 4,154.
|
COMPENSATION COMMITTEE INTERLOCKS AND INSIDER PARTICIPATION
Our Board has certain standing committees, including our Compensation Committee. Messrs. Barker, Hoffler (chairman) and McAlister are the members of our Compensation Committee. No member of our Compensation Committee is now, or at any time has been, employed by or served as an officer of the Company or any of our subsidiaries or had any substantial business dealings with the Company or any of our subsidiaries. None of our executive officers is now, or at any time has been, a member of the compensation committee or board of directors of another entity, one of whose executive officers has been a member of the Compensation Committee or our Board.
NON-GAAP FINANCIAL MEASURE
EBITDA is a supplemental, non-GAAP financial measure and is a measure of operating performance used internally. EBITDA is defined as earnings before interest expense, taxes, depreciation and amortization. We have presented EBITDA because it is used by the financial community as a method of measuring our performance and of evaluating the market value of companies considered to be in similar businesses. We believe that the line item on our consolidated statements of operations entitled “Income (loss) before income taxes and earnings (losses) from unconsolidated entities” is the most directly comparable GAAP measures to EBITDA. Since EBITDA is not a measure of performance calculated in accordance with GAAP, it should not be considered in isolation of, or as a substitute for, income (loss) before income taxes and earnings (losses) from unconsolidated entities as an indicator of operating performance. EBITDA, as we calculate it, may not be comparable to similarly titled measures employed by other companies. In addition, this measure is not necessarily a measure of our ability to fund our cash needs. As EBITDA excludes certain financial information as compared with income (loss) before income taxes and earnings (losses) from unconsolidated entities, the most directly comparable GAAP financial measure, users of this financial information should consider the type of events and transactions which are excluded. Our non-GAAP performance measure, EBITDA, has certain material limitations as follows:
49
|
|
•
|
It does not include interest expense. Because we have borrowed money to finance our operations, pay commitment fees to maintain our credit facility, and incur fees to issue letters of credit under the credit facility, interest expense is a necessary and ongoing part of our costs and has assisted us in generating revenue. Therefore, any measure that excludes interest expense has material limitations.
|
|
|
•
|
It does not include income taxes. Because the payment of income taxes is a necessary and ongoing part of our operations, any measure that excludes income taxes has material limitations.
|
|
|
•
|
It does not include depreciation or amortization expense. Because we use capital and intangible assets to generate revenue, depreciation and amortization expense is a necessary element of our cost structure. Therefore, any measure that excludes depreciation or amortization expense has material limitations.
|
A reconciliation of EBITDA to income (loss) before income taxes and earnings (losses) from unconsolidated entities is shown below for fiscal year 2012 (in millions). To supplement this disclosure, a reconciliation on a consolidated basis of net income (loss) to income (loss) before income taxes and earnings (losses) from unconsolidated entities is also shown below for fiscal year 2012 (in millions):
|
Consolidated
|
||||
|
Net income (loss)
|
$ | 211.3 | ||
|
Earnings from unconsolidated entities, net of income taxes
|
(16.2 | ) | ||
|
Provision (benefit) for income taxes
|
45.0 | |||
|
Income (loss) before income taxes and earnings (losses) from unconsolidated entities:
|
$ | 240.1 | ||
|
Consolidated
|
Power
|
Plant
Services
|
E&I
|
F&M
|
E&C
|
Westinghouse
|
Corporate
|
|||||||||||||||||||||||||
|
Income (loss) before income taxes and earnings (losses) from unconsolidated entities:
|
$ | 240.1 | $ | 30.6 | $ | 69.8 | $ | 102.8 | $ | 68.8 | $ | 41.5 | $ | 0.1 | $ | (73.5 | ) | |||||||||||||||
|
Interest expense
|
46.9 | 0.2 | — | — | 0.2 | — | 40.6 | 5.9 | ||||||||||||||||||||||||
|
Depreciation and amortization
|
74.4 | 28.4 | 1.9 | 14.0 | 18.9 | 9.4 | — | 1.8 | ||||||||||||||||||||||||
|
Earnings (losses) from unconsolidated entities
|
26.6 | (2.4 | ) | — | 1.3 | (0.8 | ) | 8.2 | 20.3 | — | ||||||||||||||||||||||
|
Income attributable to noncontrolling interests
|
(12.4 | ) | — | — | (9.6 | ) | (2.8 | ) | — | — | — | |||||||||||||||||||||
|
EBITDA
|
$ | 375.6 | $ | 56.8 | $ | 71.7 | $ | 108.5 | $ | 84.3 | $ | 59.1 | $ | 61.0 | $ | (65.8 | ) | |||||||||||||||
|
Consolidated
|
Westinghouse
|
Excluding Westinghouse
|
||||||||||
|
EBITDA
|
$ | 375.6 | $ | 61.0 | $ | 314.6 | ||||||
ITEM 12. SECURITY OWNERSHIP OF CERTAIN BENEFICIAL OWNERS AND MANAGEMENT AND RELATED STOCKHOLDER MATTERS
SECURITY OWNERSHIP OF CERTAIN BENEFICIAL OWNERS
The following table sets forth certain information as of December 19, 2012 with respect to the beneficial ownership of the our common stock by any entity or person known to the Company to be the beneficial owner of more than 5% of the outstanding shares of our common stock. Unless otherwise indicated, all shares of our common stock are held with sole voting and investment power.
50
|
Name and Address of Beneficial Owner
|
Number of Shares Beneficially Owned
|
Percent of Outstanding Shares(1)
|
|||
|
BlackRock, Inc.
40 East 52nd Street
New York, NY 10022
|
4,820,620 | (2) |
7%
|
||
|
State Street Corporation
One Lincoln Street
Boston, MA 02111
|
3,374,367 | (3) |
5%
|
||
|
The Vanguard Group, Inc.
P.O. Box 2600
Valley Forge, PA 19482-2600
|
3,468,922 | (4) |
5%
|
||
___________________________
|
(1)
|
Based on 66,663,781 shares of our common stock outstanding as of December 19, 2012.
|
|
(2)
|
Information with respect to BlackRock, Inc., on its own behalf and on behalf of certain of its subsidiaries, is based solely on certain Schedule 13Fs filed on November 13, 2012.
|
|
(3)
|
Information with respect to State Street Corporation, on its own behalf and on behalf of certain of its subsidiaries, is based solely on the Schedule 13F filed on November 13, 2012.
|
|
(4)
|
Information with respect to The Vanguard Group, Inc. , on its own behalf and on behalf of certain of its subsidiaries, is based solely on the Schedule 13F filed on November 14, 2012. The holder shares investment power with respect to 44,049 shares reported and has sole investment power with respect to the remaining 3,424,873 shares reported. The holder has sole voting power with respect to 46,822 shares reported and has no voting power with respect to the remaining 3,422,100 shares reported.
|
SECURITY OWNERSHIP OF MANAGEMENT AND DIRECTORS
The following table sets forth the shares of our common stock beneficially owned, as of December 17, 2012, except as otherwise noted, by:
|
|
·
|
Each director;
|
|
|
·
|
Each named executive officer; and
|
|
|
·
|
All of our current directors and executive officers as a group.
|
The shareholders listed have sole voting and investment power with respect to shares beneficially owned by them, except as otherwise noted.
|
|
Amount and Nature of Beneficial Ownership
|
|||||||||||||||
|
Name of Beneficial Owner
|
Shares of
Common
Stock
(1)(2)
|
Shares Subject to Exercisable Options
(3)
|
Total
Shares of
Common
Stock
Beneficially
Owned (4)
|
Percent of
Class (5)
|
||||||||||||
|
Directors:
|
||||||||||||||||
|
J.M. Bernhard, Jr. (Chairman, President and Chief Executive Officer)
|
1,208,660 | 1,440,339 | 2,648,999 |
4.0
|
% | |||||||||||
|
James F. Barker
|
11,854 | 12,472 | 24,326 | * | ||||||||||||
|
Thos. E. Capps
|
9,533 | 7,794 | 17,327 | * | ||||||||||||
|
Daniel A. Hoffler
|
18,199 | 9,972 | 28,171 | * | ||||||||||||
|
David W. Hoyle (6)
|
35,485 | 15,300 | 50,785 | * | ||||||||||||
|
Michael J. Mancuso
|
6,760 | 8,903 | 15,663 | * | ||||||||||||
|
Albert D. McAlister (7)
|
142,568 | 15,300 | 157,868 | * | ||||||||||||
|
Stephen R. Tritch
|
3,648 | 3,467 | 7,115 | * | ||||||||||||
|
Named Executive Officers (other than Mr. Bernhard):
|
||||||||||||||||
|
Brian K. Ferraioli
|
85,348 | 146,731 | 232,079 | * | ||||||||||||
|
David L. Chapman, Sr. (8)
|
30,759 | 85,724 | 116,483 | * | ||||||||||||
|
George P. Bevan
|
36,356 | 75,378 | 111,734 | * | ||||||||||||
|
Eli Smith
|
9,679 | 19,194 | 28,873 | * | ||||||||||||
|
All current directors and executive officers as a group (14 persons)
|
1,617,031 | 1,873,869 | 3,490,900 |
5.2
|
% | |||||||||||
51
____________
|
*
|
Ownership is less than 1%
|
|
(1)
|
Includes shares over which the person or members of his immediate family hold or share voting and/or investment power and excludes shares listed under the column “Shares Subject to Exercisable Options.” For named executive officers, shares owned through our 401(k) Plan are included.
|
|
(2)
|
Includes RSUs awarded under our 2005 Director Plan or the Omnibus Plan, to our non-employee directors that may convert into shares of common stock within 60 days of December 17, 2012 (or by February 15, 2013), as follows: Mr. Barker — 2,198; Mr. Capps — 2,198; Mr. Hoffler — 2,198; Secretary Hoyle — 2,198; Mr. Mancuso — 2,198; Mr. McAlister — 2,198; and Mr. Tritch — 2,198. Includes RSUs awarded under our 2001 Employee Incentive Compensation Plan or our Omnibus Plan to employees that will convert into shares of common stock within 60 days of December 17, 2012 (or by February 15, 2013), as follows: Mr. Bernhard — 77,057; Mr. Ferraioli — 20,748; Mr. Chapman – 19,675; Mr. Bevan — 13,201; and Mr. Smith – 3,196. Restricted stock units do not have voting rights.
|
|
(3)
|
Includes shares underlying options granted by us that are exercisable at December 17, 2012, and shares underlying options that become exercisable within 60 days of December 17, 2012 (or by February 15, 2013).
|
|
(4)
|
Represents the total of shares listed under the columns “Shares of Common Stock” and “Shares Subject to Exercisable Options.”
|
|
(5)
|
Based on the number of total shares outstanding at December 19, 2012.
|
|
(6)
|
Includes 2,250 shares of common stock beneficially owned by Secretary Hoyle’s spouse. Of the shares shown as beneficially owned by Secretary Hoyle, 20,383 shares are held in a margin securities account at a brokerage firm, and are pledged as collateral security for the repayment of debt balances, if any, owned by such account.
|
|
(7)
|
Includes 77,644 shares beneficially owned by the Albert McAlister Revocable Trust (Mr. McAlister is Trustee), 27,764 shares beneficially owned by the Camille McAlister Trust (Mr. McAlister is Co-Trustee), 15,900 shares beneficially owned by the Albert McAlister 2001 Charitable Remainder Unitrust (Mr. McAlister is Trustee), 9,000 shares beneficially owned by the Albert McAlister 2008 Charitable Remainder Unitrust (Mr. McAlister is Trustee), 2,500 shares beneficially owned by Mr. McAlister’s spouse and 3,000 shares beneficially owned by A. Dial McAlister, Jr. Limited Partnership (Mr. McAlister and his son are partners).
|
|
(8)
|
Includes 2,482 shares beneficially owned by Mr. Chapman’s spouse.
|
Equity Compensation Plan Information
We have equity compensation plans pursuant to which our common stock may be issued to employees and non-employees as compensation pursuant to outstanding equity awards. The shares available for future grant are under The Shaw Group Inc. 2008 Omnibus Incentive Plan, which was previously approved by our shareholders.
The following table presents information regarding these equity compensation plans as of August 31, 2012:
|
Number of Securities
To be Issued Upon
Exercise of
Outstanding Options,
Warrants and Rights
|
Weighted-Average
Exercise Price of
Outstanding Options,
Warrants and Rights
|
Number of Securities
Remaining Available for
Future Issuance Under
Equity Compensation Plans (a)
|
|||
|
Equity compensation plans
approved by security holders
|
3,088,064
|
26.42
|
1,785,135
|
||
|
Equity compensation plans not
approved by security holders
|
—
|
—
|
—
|
||
|
Total
|
3,088,064
|
26.42
|
1,785,135
|
|
(a)
|
Excludes securities reflected in “Number of Securities to be Issues Upon Exercise of Outstanding Options, Warrants and Rights” column.
|
52
ITEM 13. CERTAIN RELATIONSHIPS AND RELATED TRANSACTIONS, AND DIRECTOR INDEPENDENCE
TRANSACTIONS WITH RELATED PERSONS
Policies and Procedures
Our Board adopted a Related Persons Transaction Policy in August 2008 for the review, approval, or ratification of related person transactions. The policy applies to covered transactions exceeding or expected to exceed $25,000 in a calendar year in which the Company and a Related Person are participants. A Related Person is defined as: (1) a director or director nominee; (2) a senior officer of the Company or any of its controlled affiliates; (3) any shareholder owning more than 5% of our common stock (or any person owning more than 5% of the equity interests of any of our controlled affiliates); (4) a person who is an immediate family member of any of the foregoing; or (5) an entity that is owned or controlled by any of the persons noted in (1) through (4) of the policy. Our Related Persons Transaction Policy requires the approval of our Audit Committee for any transactions covered by the policy. This approval process is intended to be performed in advance of a covered transaction but may be subsequently ratified by our Audit Committee. Certain transactions qualify for standing pre-approval and need not be reported to our Audit Committee. These transactions include but are not limited to: (a) employment of executive officers; (b) director compensation; and (c) transactions with another company at which a Related Person’s only relationship is as an employee (other than an executive officer), director or beneficial owner of less than 10% of that company’s shares. They are pre-approved or ratified (as applicable) if the aggregate amount involved does not exceed the greater of $200,000 or 5% of that company’s total annual revenues. Any charitable contributions, grants or endowments by the Company to a charitable organization, foundation or university at which a Related Person’s only relationship is as an employee (other than an executive officer) or a director are pre-approved or ratified (as applicable) if the aggregate amount involved does not exceed the lesser of $200,000 or 5% of the charitable organization’s total annual receipts. Transactions involving a competitive bid process also qualify for standing preapproval. The policy also requires reporting and disclosures as required by law.
Our current process for identifying transactions subject to our Related Persons Transaction Policy occurs through an annual survey requesting disclosure of existing related person transactions from certain employees, including all executive and managerial employees. Additionally, we request disclosure of any relationships with our employees, officers and directors on subcontractor pre-qualification forms. Our Code of Corporate Conduct also requires employees to avoid conflicts of interest and disclose any potential conflicts of interests. If potential related person transactions are identified, they are reviewed for compliance with the Related Persons Transaction Policy by our Chief Compliance Officer; if approval by our Audit Committee is required by the policy, we will solicit approval or ratification of the transaction by our Audit Committee. In determining whether to approve or ratify a transaction, the Audit Committee considers, among other factors (1) whether the transaction is on terms no less favorable than terms generally available to an unaffiliated third-party under the same or similar circumstances, and (2) the extent of the Related Person’s interest in the transaction.
Transactions
|
|
·
|
Employment of Mr. Chapman’s Son. During fiscal year 2012, the Company employed as a “Director of Coatings” David L. Chapman, Jr., son of David L. Chapman, Sr., President of our Fabrication & Manufacturing Group. David L. Chapman, Jr.’s compensation in fiscal year 2012 was approximately $180,000. He has been a Company employee since August 2002. We believe that David L. Chapman, Jr.’s compensation is reasonable and commensurate with his level of experience, expertise, responsibilities, duties, and service to the Company.
|
DIRECTOR INDEPENDENCE
The NYSE listing standards and the Company’s standards of independence enumerated in our Corporate Governance Principles require our Board to consist of at least a majority of independent directors. Only one director is a Company employee, and our Board has affirmatively determined that a majority of our current directors qualify as “independent” directors pursuant to the rules adopted by the SEC, the NYSE listing standards and our Corporate Governance Principles. The Company’s Corporate Governance Principles are available on our website at www.shawgrp.com on the “About Shaw” page under the “Corporate Governance” link.
Under our Board’s standards for director independence, a director is considered independent if our Board affirmatively determines that the director has no direct or indirect “material relationship” with the Company, other than as a director or owner of shares of our common stock. When assessing the “materiality” of a director’s relationship, our Board considers all facts and circumstances, not just from the director’s viewpoint, but from that of the persons or organizations with whom or which the director has an affiliation. Our Board also considers the frequency and regularity of any services the director provides, whether provided at arm’s length in the ordinary course of business and substantially on the same terms to the Company as those prevailing at the time from unrelated third parties for comparable transactions. Material relationships can include commercial, industrial, banking, consulting, legal, accounting, charitable, and familial relationships, among others. Our Board also considered the following transactions, relationships, and arrangements in determining director independence and determined that they were not material and did not impair independence:
(a) In the ordinary course of business, Shaw has made payments to an entity, which, among other things, supplies equipment to power plants, for which Mr. Mancuso serves as a director. The payments by Shaw to such entity have not, within any of the other entity’s three most recently completed fiscal years, exceeded the greater of $1 million or 2% of the other entity’s consolidated gross revenues for such years.
Our Board has reviewed the above transaction and has affirmatively determined that Mr. Mancuso qualifies as an independent director.
53
Applying the standards listed above and on the basis of information solicited from our directors, our Board has affirmatively determined that the following directors currently qualify as independent, because they have no direct or indirect material relationship with the Company (other than being a member of our Board and owning shares of our common stock): James F. Barker, Thos. E. Capps, Daniel A. Hoffler, David W. Hoyle, Michael J. Mancuso, Albert D. McAlister and Stephen R. Tritch. J.M. Bernhard, Jr., our Chairman, President, and Chief Executive Officer is currently our only non-independent director. All of the members of each of our Audit, Compensation and Nominating and Corporate Governance Committees are independent.
ITEM 14. PRINCIPAL ACCOUNTING FEES AND SERVICES
Independent Registered Public Accounting Firm Fees
The following table shows the fees related to the audit and other services provided by KPMG LLP (KPMG) for the fiscal years ended August 31, 2012 and 2011:
|
|
Fiscal Year 2012
|
Fiscal Year 2011
|
||||||||||
|
Audit Fees
|
$ | 6,250,000 | 56 | % | $ | 6,600,000 | 71 | % | ||||
|
Audit-Related Fees
|
2,557,000 | 23 | % | 1,075,000 | 12 | % | ||||||
|
Tax Fees
|
2,448,000 | 21 | % | 1,575,000 | 17 | % | ||||||
|
All Other Fees
|
- | 0 | % | - | 0 | % | ||||||
|
Total
|
$ | 11,255,000 | 100 | % | $ | 9,250,000 | 100 | % | ||||
Audit Fees. Services within audit fees primarily include the annual audit and the audit of internal control over financial reporting, as well as reviews of our quarterly reports and accounting and reporting consultations.
Audit-Related Fees. Services within audit-related fees primarily include statutory audits for our international subsidiaries, audits of certain joint ventures and due diligence services.
Tax Fees. Services within tax fees primarily include tax compliance services, tax advice, Form 5500 preparation, tax planning and expatriate tax services.
KPMG did not perform any professional services related to financial information systems design and implementation for us in fiscal year 2012.
Pre-Approval of Audit and Permissible Non-Audit Services
Under the policy on pre-approval of services to be provided by our independent registered public accountants, as adopted by our Audit Committee and described below, our Audit Committee reviews and pre-approves all audit and permissible non-audit services provided by our independent registered public accounting firm as well as the fees charged for such services.
All of the fees and services described above under “Audit Fees,” “Audit-Related Fees,” and “Tax Fees” were approved by our Audit Committee, which concluded that the provision of such services by KPMG were compatible with the maintenance of KPMG’s independence in the conduct of its auditing functions.
Our Audit Committee is required to pre-approve the engagement of our independent registered public accountant to perform any services for the Company or its subsidiaries. This pre-approval is required to be obtained prior to the engagement of the independent registered public accountant. Our Audit Committee has determined to categorize the services that might be performed by the independent registered public accountant in the following list. For engagements to provide services included in “Level 1,” our Audit Committee must pre-approve the services. For engagements to provide services included in “Level 2,” our Audit Committee has delegated its full authority to any single member of our Audit Committee to pre-approve these services. All services pre-approved by a single member shall be reviewed by our Audit Committee at its following meeting.
Audit Services
Our Audit Committee will pre-approve the independent registered public accounting firm for recurring engagements annually as a matter of course. The Levels below are intended as minimums and generally would only be required for an unforeseen audit or for audit services performed outside of recurring annual audits.
Level 1
|
|
·
|
Audit of our annual consolidated financial statements, including quarterly reviews.
|
|
|
·
|
Any other audit services not specifically listed.
|
54
Level 2
|
|
·
|
Consents to include the independent registered public accounting firm’s report in our filings with the SEC
|
|
|
·
|
Comfort letters
|
|
|
·
|
Statutory audits of foreign subsidiaries
|
|
|
·
|
Audits of wholly-owned consolidated entities (e.g., Shaw Constructors for State Contractors’ Licenses)
|
Audit Related Services
Level 1
|
|
·
|
Audits of Employee Benefit Plans
|
|
|
·
|
Due diligence related to mergers & acquisition when fees exceed $200,000
|
|
|
·
|
Internal control reviews
|
|
|
·
|
Any other audit related services not specifically listed
|
Level 2
|
|
·
|
Due diligence related to mergers & acquisitions when fees do not exceed $200,000
|
|
|
·
|
Accounting assistance & audits in connection with proposed or consummated acquisitions when fees do not exceed $200,000
|
|
|
·
|
Consultation concerning financial accounting and reporting standards when fees do not exceed $200,000
|
Tax Services
Level 1
|
|
·
|
Tax compliance services related to our consolidated federal tax return
|
|
|
·
|
Any other tax services not specifically listed
|
Level 2
|
|
·
|
Tax payment planning services when fees do not exceed $200,000
|
|
|
·
|
Tax consultation and tax planning services when fees do not exceed $200,000
|
Other Services
Level 1
|
|
·
|
Any other services when fees exceed $100,000
|
Level 2
|
|
·
|
Any other services when fees do not exceed $100,000
|
Our Audit Committee recognizes that for certain engagements, such as due diligence assistance related to mergers and acquisitions, the total fees are usually unknown. In these circumstances, a single engagement may be approved at Level 2, and then as it becomes apparent that the fees will exceed the Level 2 limitations, a Level 1 “pre-approval” will need to be obtained. This provision is a practical recognition that certain engagements will require pre-approval in a very short time frame, while providing a reasonable limitation to ensure Level 2 pre-approval is provided for larger, more material engagements.
55
PART IV
ITEM 15. EXHIBITS, FINANCIAL STATEMENT SCHEDULES
a) Documents filed as part of this Form 10-K/A.
1. Financial Statements.
The following were previously filed as part of our Annual Report on Form 10-K for the fiscal year ended August 31, 2012 filed with the SEC on October 19, 2012, which is being amended hereby.
|
|
·
|
Financial Statements and Supplementary Data.
|
|
|
·
|
Combined Financial Statements of Toshiba Nuclear Energy Holdings (US), Inc. and Toshiba Nuclear Energy Holdings (UK) Ltd.
|
|
|
·
|
Report of Independent Registered Public Accounting Firm — Ernst & Young LLP
|
|
|
·
|
Combined Balance Sheets as of March 31, 2012 and 2011
|
|
|
·
|
Combined Statements of Operations for the fiscal years ended March 31, 2012, 2011 and 2010
|
|
|
·
|
Combined Statements of Stockholders’ Equity for the fiscal years ended March 31, 2012, 2011 and 2010
|
|
|
·
|
Combined Statements of Cash Flows for the fiscal years ended March 31, 2012, 2011 and 2010
|
|
|
·
|
Notes to Combined Financial Statements
|
2. Financial Statement Schedules.
All schedules have been omitted because the information is not required or not in amounts sufficient to require submission of the schedule, or because the information required is included in the consolidated financial statements and notes thereto previously filed as part of our Annual Report on Form 10-K for the fiscal year ended August 31, 2012 filed with the SEC on October 19, 2012, which is being amended hereby.
3. Exhibit Listing.
The exhibits marked with the pound symbol (#) have been redacted and are the subject of an application for confidential treatment filed with the SEC pursuant to rules and regulations promulgated under the Exchange Act. The exhibits marked with the asterisk symbol (*) are management contracts or compensatory plans or arrangements filed pursuant to Item 601(b)(10)(iii) of Regulation S-K. The exhibits marked with the cross symbol (†) were previously filed with our Annual Report on Form 10-K for the fiscal year ended August 31, 2012, originally filed with the SEC on October 19, 2012, which is being amended hereby. The exhibits marked with the double cross symbol (††) were previously furnished with our Annual Report on Form 10-K for the fiscal year ended August 31, 2012, originally filed with the SEC on October 19, 2012, which is being amended hereby.
The exhibits marked with the section symbol (§) are interactive data files. Pursuant to Rule 406T of Regulation S-T, these interactive data files (i) are not deemed filed or part of a registration statement or prospectus for purposes of Sections 11 or 12 of the Securities Act of 1933, are not deemed filed for purposes of Section 18 of the Securities Exchange Act of 1934, irrespective of any general incorporation language included in any such filings, and otherwise are not subject to liability under these sections; and (ii) are deemed to have complied with Rule 405 of Regulation S-T (“Rule 405”) and are not subject to liability under the anti-fraud provisions of the Section 17(a)(1) of the Securities Act of 1933, Section 10(b) of the Securities Exchange Act of 1934 or under any other liability provision if we have made a good faith attempt to comply with Rule 405 and, after we become aware that the interactive data files fail to comply with Rule 405, we promptly amend the interactive data files.
56
|
Exhibit Number
|
Document Description
|
Form/
Schedule
|
Exhibit
|
Filing
Date
|
Filed
Herewith
|
|||||
|
2.01
|
Investment Agreement, dated as of October 4, 2006, by and among Toshiba, Toshiba Nuclear Energy Holdings Corporation (US) Inc., a Delaware corporation (the “US Company”), The Shaw Group Inc. (the “Company”) and Nuclear Energy Holdings, L.L.C. (“NEH”)
|
8-K
|
2.01
|
10/18/2006
|
||||||
|
2.02
|
Investment Agreement, dated as of October 4, 2006, by and among Toshiba, Toshiba Nuclear Energy Holdings (UK) Limited, a company registered in England with registered number 5929672 (the “UK Company”), the Company and NEH
|
8-K
|
2.02
|
10/18/2006
|
||||||
|
2.03
|
Transaction Agreement, dated as of July 30, 2012, by and among Chicago Bridge & Iron Company N.V., Crystal Acquisition Subsidiary Inc. and The Shaw Group Inc.
|
8-K
|
2.1
|
7/30/2012
|
||||||
|
3.01
|
Composite Articles of Incorporation of The Shaw Group Inc.
|
10-Q
|
3.01
|
7/10/2012
|
||||||
|
3.02
|
Amended and Restated By-Laws of The Shaw Group Inc. dated as of January 30, 2007
|
10-K/A-1
|
3.2
|
9/28/2007
|
||||||
|
4.01
|
Specimen Common Stock Certificate
|
10-K
|
4.1
|
12/6/2007
|
||||||
|
4.02
|
Rights Agreement, dated as of July 9, 2001, between the Company and First Union National Bank, as Rights Agent, including the Form of Articles of Amendment to the Restatement of the Articles of Incorporation of the Company as Exhibit A, the form of Rights Certificate as Exhibit B and the form of the Summary of Rights to Purchase Preferred Shares as Exhibit C (Exhibit A-1 and A-2)
|
8-A
|
99.1
|
7/30/2001
|
||||||
|
4.03
|
The Shaw Group Inc. hereby agrees to furnish copies of instruments defining the rights of holders of long-term debt of The Shaw Group Inc. and its consolidated subsidiaries to the Commission upon request.
|
|||||||||
|
*10.01
|
The Shaw Group Inc. Stone & Webster Acquisition Stock Option Plan
|
S-8
|
4.6
|
6/12/2001
|
||||||
|
*10.02
|
The Shaw Group Inc. 1993 Employee Stock Option Plan, amended and restated through October 8, 2001
|
10-K
|
10.1
|
11/29/2001
|
||||||
|
*10.03
|
The Shaw Group Inc. 401(k) Plan
|
S-8
|
4.6
|
5/4/2004
|
||||||
|
*10.04
|
The Shaw Group Inc. 401(k) Plan for Certain Hourly Employees
|
S-8
|
4.6
|
5/4/2004
|
||||||
|
*10.05
|
Flexible Perquisites Program for certain executive officers
|
8-K
|
11/1/2004
|
|||||||
|
*10.06
|
Trust Agreement, dated as of January 2, 2007 by and between the Company and Fidelity Management Trust Company for The Shaw Group Deferred Compensation Plan Trust
|
10-Q
|
10.6
|
9/28/2007
|
||||||
|
*10.07
|
Employee Indemnity Agreement dated as of July 12, 2007 between the Company and Brian K. Ferraioli
|
10-K
|
10.34
|
12/6/2007
|
||||||
|
*10.08
|
The Shaw Group Inc. 2005 Non-Employee Director Stock Incentive Plan, amended and restated through November 2, 2007
|
10-Q
|
10.5
|
1/9/2008
|
||||||
|
*10.09
|
Offer Letter dated as of August 31, 2007, by and between the Company and Michael J. Kershaw
|
8-K
|
10.1
|
12/21/2007
|
||||||
|
*10.10
|
Written description of the Company’s compensation policies and programs for non-employee directors
|
14A
|
12/24/2008
|
|||||||
|
*10.11
|
Amended and Restated Employment Agreement dated as of December 22, 2008 by and between the Company and Gary P. Graphia
|
8-K
|
10.1
|
12/24/2008
|
||||||
|
*10.12
|
Amended and Restated Employment Agreement dated as of December 31, 2008, by and between the Company and J.M. Bernhard, Jr.
|
8-K
|
10.1
|
1/7/2009
|
||||||
|
*10.13
|
Amended and Restated Employment Agreement dated as of December 31, 2008 between the Company and Brian K. Ferraioli
|
8-K
|
10.2
|
1/7/2009
|
||||||
|
*10.14
|
The Shaw Group Inc. 2008 Omnibus Incentive Plan
|
10-Q
|
10.8
|
4/9/2009
|
||||||
|
*10.15
|
Amended and Restated Employment Agreement dated as of December 31, 2008 by and between the Company and George P. Bevan
|
10-Q
|
10.13
|
4/9/2009
|
||||||
|
*10.16
|
Amended and Restated Employment Agreement dated as of December 31, 2008 by and between the Company and Lou Pucher
|
10-Q
|
10.16
|
4/9/2009
|
|
*10.17
|
The Shaw Group Deferred Compensation Plan
|
10-Q
|
10.1
|
4/9/2009
|
||||||
|
*10.18
|
The Shaw Group Deferred Compensation Plan Form of Adoption
|
10-Q
|
10.11
|
4/9/2009
|
||||||
|
*10.19
|
Form of Employee Incentive Stock Option Award under The Shaw Group Inc. 2008 Omnibus Incentive Plan
|
10-Q
|
10.67
|
1/6/2010
|
||||||
|
*10.20
|
Form of Employee Nonqualified Stock Option Award Agreement under The Shaw Group Inc. 2008 Omnibus Incentive Plan
|
10-Q
|
10.68
|
1/6/2010
|
||||||
|
*10.21
|
Form of Canadian Employee Incentive Stock Option Agreement under The Shaw Group Inc. 2008 Omnibus Incentive Plan
|
10-Q
|
10.70
|
1/6/2010
|
57
|
*10.22
|
Written description of the Company’s incentive compensation policies programs for executive officers, including performance targets for fiscal year end 2009
|
14A
|
12/17/2009
|
|||||||
|
*10.23
|
Form of Nonemployee Director Nonqualified Stock Option Award Agreement under The Shaw Group Inc. 2008 Omnibus Incentive Plan
|
10-Q
|
10.46
|
4/7/2010
|
||||||
|
*10.24
|
Form of Nonemployee Director Restricted Stock Unit Award Agreement under The Shaw Group Inc. 2008 Omnibus Incentive Plan
|
10-Q
|
10.47
|
4/7/2010
|
||||||
|
*10.25
|
Amendment to the Amended and Restated Employment Agreement dated December 31, 2008, by and between the Company and J.M. Bernhard, Jr.
|
10-Q
|
10.48
|
7/12/2010
|
||||||
|
*10.26
|
Second Amended and Restated Employment Agreement dated as of July 22, 2010 by and between the Company and John Donofrio
|
10-K
|
10.24
|
10/28/2010
|
||||||
|
*10.27
|
Amended and Restated Employment Agreement dated as of April 8, 2011 by and between the Company and David L. Chapman, Sr.
|
10-Q
|
10.3
|
4/11/2011
|
||||||
|
*10.28
|
Employment Agreement dated as of February 2, 2011 by and between the Company and Clarence Ray
|
10-Q
|
10.4
|
4/11/2011
|
||||||
|
*10.29
|
Second Amended and Restated Employment Agreement dated December 12, 2011, by and between the Company and J. M. Bernhard, Jr.
|
10-Q
|
10.1
|
12/21/2011
|
||||||
|
*10.30
|
Letter Agreement dated December 9, 2011, by and between the Company and Timothy J. Poché
|
8-K
|
10.1
|
1/26/2012
|
||||||
|
*10.31
|
Consulting Agreement dated May 23, 2012, by and between The Shaw Group Inc. and Gary P. Graphia
|
8-K
|
10.1
|
5/29/2012
|
||||||
|
*†10.32
|
Form of Employee Restricted Stock Unit Award Agreement under The Shaw Group Inc. 2008 Omnibus Incentive Plan
|
10-K
|
10.32
|
10/19/2012
|
||||||
|
*†10.33
|
Form of Employee Performance Cash Unit Award Agreement under The Shaw Group Inc. 2008 Omnibus Incentive Plan
|
10-K
|
10.33
|
10/19/2012
|
||||||
|
*†10.34
|
Form of Employee Cash Settled Restricted Stock Unit Award Agreement under The Shaw Group Inc. 2008 Omnibus Incentive Plan
|
10-K
|
10.34
|
10/19/2012
|
||||||
|
*†10.35
|
Form of Section 16 Officer Restricted Stock Unit Award Agreement under The Shaw Group Inc. 2008 Omnibus Incentive Plan
|
10-K
|
10.35
|
10/19/2012
|
||||||
|
*†10.36
|
Form of Section 16 Officer Performance Cash Unit Award Agreement under The Shaw Group Inc. 2008 Omnibus Incentive Plan
|
10-K
|
10.36
|
10/19/2012
|
||||||
|
*†10.37
|
Retention Bonus dated October 16, 2012 by and between the Company and Timothy Poché
|
10-K
|
10.37
|
10/19/2012
|
||||||
|
10.38
|
Asset Purchase Agreement, dated as of July 14, 2000, among Stone & Webster, Incorporated, certain subsidiaries of Stone & Webster, Incorporated and the Company
|
8-K
|
2.1
|
7/28/2000
|
|
10.39
|
Composite Asset Purchase Agreement, dated as of January 23, 2002, by and among the Company, The IT Group, Inc. and certain subsidiaries of The IT Group, Inc., including the following amendments:(i) Amendment No. 1, dated January 24, 2002, to Asset Purchase Agreement, (ii) Amendment No. 2, dated January 29, 2002, to Asset Purchase Agreement, and (iii) a letter agreement amending Section 8.04(a)(ii) of the Asset Purchase Agreement, dated as of April 30, 2002, between The IT Group, Inc. and the Company
|
8-K
|
2.1
|
5/16/2002
|
||||||
|
10.40
|
Amendment No. 3, dated May 2, 2002, to Asset Purchase Agreement by and among the Company, The IT Group, Inc. and certain subsidiaries of The IT Group, Inc.
|
8-K
|
2.2
|
5/16/2002
|
||||||
|
10.41
|
Amendment No. 4, dated May 3, 2002, to Asset Purchase Agreement by and among the Company, The IT Group, Inc. and certain subsidiaries of the IT Group, Inc.
|
8-K
|
2.3
|
5/16/2002
|
||||||
|
10.42
|
Put Option Agreement, dated as of October 13, 2006, between NEH and Toshiba related to shares in the US acquisition company
|
8-K
|
10.2
|
10/18/2006
|
||||||
|
10.43
|
Put Option Agreement, dated as of October 13, 2006, between NEH and Toshiba related to shares in the UK acquisition company
|
8-K
|
10.3
|
10/18/2006
|
||||||
|
10.44
|
Shareholders Agreement, dated as of October 4, 2006, by and among Toshiba, Toshiba Nuclear Energy Holdings (US) Inc. the US Company, NEH, TSB Nuclear Energy Investment US Inc., a Delaware corporation and a wholly owned subsidiary of Toshiba and Ishikawajima-Harima Heavy Industries Co., Ltd., a corporation organized under the laws of Japan (“IHI”)
|
8-K
|
10.4
|
10/18/2006
|
58
|
10.45
|
Shareholders Agreement, dated as of October 4, 2006, by and among Toshiba, Toshiba Nuclear Energy Holdings (UK) Inc., the UK Company, NEH, IHI and TSB Nuclear Energy Investment UK Limited, a company registered in England with registered number 5929658
|
8-K
|
10.5
|
10/18/2006
|
||||||
|
10.46
|
Bond Trust Deed, dated October 13, 2006, between NEH and The Bank of New York, as trustee
|
8-K
|
10.6
|
10/18/2006
|
||||||
|
10.47
|
Parent Pledge Agreement, dated October 13, 2006, between the Company and The Bank of New York
|
8-K
|
10.7
|
10/18/2006
|
||||||
|
10.48
|
Issuer Pledge Agreement, dated October 13, 2006, between NEH and The Bank of New York
|
8-K
|
10.8
|
10/18/2006
|
||||||
|
10.49
|
Deed of Charge, dated October 13, 2006, among NEH, The Bank of New York, as trustee, and Morgan Stanley Capital Services Inc., as swap counterparty
|
8-K
|
10.9
|
10/18/2006
|
||||||
|
10.50
|
Transferable Irrevocable Direct Pay Letter of Credit (Principal Letter of Credit) effective October 13, 2006 of Bank of America in favor of NEH
|
8-K
|
10.1
|
10/18/2006
|
||||||
|
10.51
|
Transferable Irrevocable Direct Pay Letter of Credit (Interest Letter of Credit) effective October 13, 2006 of Bank of America in favor of NEH
|
8-K
|
10.11
|
10/18/2006
|
||||||
|
10.52
|
Reimbursement Agreement dated as of October 13, 2006, between the Company and Toshiba
|
8-K
|
10.12
|
10/18/2006
|
||||||
|
#10.53
|
Credit Agreement between Nuclear Innovation North America LLC, Nina Investments Holdings LLC, Nuclear Innovation North America Investments Llc, Nina Texas 3 LLC and Nina Texas 4 LLC Dated November 29, 2010
|
10-Q
|
10.1
|
1/6/2011
|
||||||
|
#10.54
|
First Lien Intercreditor Agreement Dated As Of November 29, 2010, Among Nuclear Innovation North America LLC, Nina Investments Holdings LLC, Nuclear Innovation North America Investments LLC, Nina Texas 3 Llc and Nina Texas 4 LLC, The Other Grantors Party Hereto, Toshiba America Nuclear Energy Corporation, as Toshiba Collateral Agent, and The Shaw Group Inc., As Shaw Collateral Agent
|
10-Q
|
10.2
|
1/6/2011
|
|
#10.55
|
Second Amended and Restated Credit Agreement, dated as of June 15, 2011, among the Company, as borrower; the Company’s subsidiaries signatories thereto, as guarantors; BNP Paribas, as administrative agent; and the other agents and lenders signatory thereto.
|
8-K
|
10.1
|
6/21/2011
|
||||||
|
10.56
|
Agreement of Purchase and Sale dated May 21, 2012, by and between The Shaw Group Inc. and Technip, S.A.
|
8-K
|
2.1
|
5/22/2012
|
||||||
|
14.01
|
The Shaw Group Inc. Code of Corporate Conduct dated June 2006
|
10-K
|
14.1
|
12/6/2007
|
||||||
|
14.02
|
The Shaw Group Inc. Code of Ethics for Chief Executive Officer and Senior Financial Officers (adopted as of December 16, 2003)
|
10-K
|
14.2
|
12/6/2007
|
||||||
|
14.03
|
The Shaw Group Inc. Insider Trading Policy dated June 2006
|
10-K
|
14.3
|
12/6/2007
|
||||||
|
†21.01
|
Subsidiaries of The Shaw Group Inc.
|
10-K
|
21.01
|
10/19/2012
|
||||||
|
†23.01
|
Consent of KPMG LLP, independent registered public accounting firm of The Shaw Group Inc.
|
10-K
|
23.01
|
10/19/2012
|
||||||
|
†23.02
|
Consent of Ernst & Young LLP, independent registered public accounting firm of Toshiba Nuclear Energy Holdings (US), Inc. and Toshiba Nuclear Energy Holdings (UK) Ltd.
|
10-K
|
23.02
|
10/19/2012
|
||||||
|
31.1
|
Certification pursuant to Section 302 of the Sarbanes-Oxley Act of 2002
|
X
|
||||||||
|
31.2
|
Certification pursuant to Section 302 of the Sarbanes-Oxley Act of 2002
|
X
|
||||||||
|
††32.01
|
Certification pursuant to 18 U.S.C. Section 1350, as Adopted Pursuant to Section 906 of the Sarbanes-Oxley Act of 2002
|
10-K
|
32.01
|
10/19/2012
|
||||||
|
††32.02
|
Certification pursuant to 18 U.S.C. Section 1350, as Adopted Pursuant to Section 906 of the Sarbanes-Oxley Act of 2002
|
10-K
|
32.02
|
10/19/2012
|
||||||
|
††§101.INS
|
XBRL Instance Document.
|
10-K
|
10/19/2012
|
|||||||
|
††§101.SCH
|
XBRL Taxonomy Extension Schema Document
|
10-K
|
10/19/2012
|
|||||||
|
††§101.CAL
|
XBRL Taxonomy Extension Calculation Linkbase Document
|
10-K
|
10/19/2012
|
|||||||
|
††§101.LAB
|
XBRL Taxonomy Extension Label Linkbase Document
|
10-K
|
10/19/2012
|
|||||||
|
††§101.PRE
|
XBRL Taxonomy Extension Presentation Linkbase Document.
|
10-K
|
10/19/2012
|
|||||||
|
††§101.DEF
|
XBRL Taxonomy Extension Definition Linkbase Document
|
10-K
|
10/19/2012
|
59
SIGNATURES
Pursuant to the requirements of Section 13 or 15(d) of the Securities Exchange Act of 1934, the registrant has duly caused this report to be signed on its behalf by the undersigned, thereunto duly authorized.
|
THE SHAW GROUP INC.
|
|||
| /s/ J.M. Bernhard, Jr. | |||
| By: J. M. Bernhard, Jr. | |||
| Chief Executive Officer | |||
Date: December 21, 2012
Pursuant to the requirements of the Securities Exchange Act of 1934, this report has been signed below, by the following persons on behalf of the registrant and in the capacities and on the dates indicated.
| Signature | Title | Date | ||
| Chairman of the Board, President and
Chief Executive Officer and Director
|
December 21, 2012
|
|||
|
/s/ J. M. Bernhard, Jr.
|
(Principal Executive Officer)
|
|
||
| J. M. Bernhard, Jr. | ||||
| Executive Vice President
and Chief Financial Officer
|
December 21, 2012
|
|||
| /s/ Brian K. Ferraioli | (Principal Financial Officer) | |||
|
Brian K. Ferraioli
|
|
|||
|
Interim Vice President
and Chief Accounting Officer
|
December 21, 2012
|
|||
|
/s/ James C. Wilems
|
(Principal Accounting Officer)
|
|||
| James C. Wilems | ||||
| /s/ Albert D. McAlister | Director | December 21, 2012 | ||
|
Albert D. McAlister
|
||||
|
/s/ David W. Hoyle
|
Director
|
December 21, 2012
|
||
| David W. Hoyle | ||||
|
/s/ James F. Barker
|
Director
|
December 21, 2012
|
||
| James F. Barker | ||||
|
/s/ Daniel A. Hoffler
|
Director
|
December 21, 2012
|
||
| Daniel A. Hoffler | ||||
|
/s/ Michael J. Mancuso
|
Director
|
December 21, 2012
|
||
| Michael J. Mancuso | ||||
|
/s/ Thomas E. Capps
|
Director
|
December 21, 2012
|
||
| Thomas E. Capps | ||||
|
/s/ Stephen R. Tritch
|
Director
|
December 21, 2012
|
||
| Stephen R. Tritch |
60