Attached files
| file | filename |
|---|---|
| 8-K - FORM 8-K - American Realty Capital Trust, Inc. | v796101_8k.htm |

DECEMBER 2012 Creating the Top Net Lease REIT Acquisition of The Monthly Dividend Company ® NYSE: O

2 Additional Information and Where to Find It In connection with the proposed merger, the Company and Realty have filed a definitive proxy statement with the SEC on December 6 , 2012 and commenced mailing the definitive proxy statement and a form of proxy to the stockholders of the Company . BEFORE MAKING ANY VOTING DECISION, INVESTORS ARE URGED TO READ THE DEFINITIVE PROXY STATEMENT REGARDING THE PROPOSED MERGER CAREFULLY AND IN ITS ENTIRETY BECAUSE THE PROXY STATEMENT CONTAINS IMPORTANT INFORMATION ABOUT THE PROPOSED MERGER . Investors will be able to obtain, without charge, a copy of the definitive proxy statement and other relevant documents filed with the SEC from the SEC’s website at http : //www . sec . gov . Copies of the documents filed by the Company with the SEC are also available free of charge on the Company’s website at http : //ir . arctreit . com, and copies of the documents filed by Realty with the SEC are available free of charge on Realty’s website at http : //www . realtyincome . com . Participants in Solicitation The Company, Realty and their respective directors and executive officers may be deemed to be participants in the solicitation of proxies from the Company’s and Realty’s stockholders in respect of the proposed merger . Information regarding the Company’s directors and executive officers can be found in the Company’s definitive proxy statement filed with the SEC on May 21 , 2012 . Information regarding Realty’s directors and executive officers can be found in Realty’s definitive proxy statement filed with the SEC on March 30 , 2012 . Stockholders may obtain additional information regarding the interests of the Company and its directors and executive officers in the proposed merger, which may be different than those of the Company’s stockholders generally, by reading the definitive proxy statement filed in connection with the proposed merger with the SEC on December 6 , 2012 and other relevant documents regarding the proposed merger filed with the SEC . These documents are available free of charge on the SEC’s website and from the Company or Realty, as applicable, using the sources indicated above . Introductory Notes

3 Forward - Looking Statements Information set forth herein (including information included or incorporated by reference herein) contains “forward - looking statements” (as defined in Section 21 E of the Securities Exchange Act of 1934 , as amended), which reflect the Company’s and Realty’s expectations regarding future events . The forward - looking statements involve a number of risks, uncertainties and other factors that could cause actual results to differ materially from those contained in the forward - looking statements . Such forward - looking statements include, but are not limited to whether and when the transactions contemplated by the merger agreement will be consummated, the new combined company’s plans, market and other expectations, objectives, intentions and other statements that are not historical facts . The following additional factors, among others, could cause actual results to differ from those set forth in the forward - looking statements : the ability to obtain regulatory approvals for the transaction and the approval of the merger agreement by the stockholders of both parties ; unexpected costs or unexpected liabilities that may arise from the transaction, whether or not consummated ; the inability to retain key personnel ; continuation or deterioration of current market conditions ; future regulatory or legislative actions that could adversely affect the companies ; and the business plans of the customers of the respective parties . Additional factors that may affect future results are contained in the Company’s and Realty’s filings with the SEC, which are available at the SEC’s website at www . sec . gov . The Company and Realty disclaim any obligation to update and revise statements contained in these materials based on new information or otherwise . Introductory Notes (Continued)

4 A Compelling Transaction for ARCT’s Stockholders x Premium Valuation: Realty Income is valuing ARCT’s assets at a significantly higher price and lower cap rate than ARCT’s cost basis, which represents the lowest cap rate of similar net lease REIT transactions 1 – 5.9% cash cap rate / 6.1% GAAP cap rate vs. 8.2% weighted average cap rate basis – Cap rate is significantly lower than similar transactions, which range from 7.1% - 8.25% 1 – 15.7x forward EBITDA multiple represents second highest amongst similar REIT transactions 2 x Ideal Strategic Buyer: Realty Income represents the ideal strategic buyer given their business focus, size and scale, investment grade balance sheet / cost of capital and share liquidity x No Inquiries Received: Since announcement of the transaction, no third party has approached ARCT or its advisors with an alternative transaction or with a request for information despite low break fee of ~1.7% of transaction value 1 2 3 (1) See page 11 for similar transaction cap rates. (2) See page 12 for similar transaction forward EBITDA multiples.

5 A Compelling Transaction for ARCT’s Stockholders (Continued) x Alignment of Interests: Pro forma for the transaction, ARCT management will own ~$45 million of equity in Realty Income, including over $25 million of existing equity in ARCT – As part of the merger agreement, ARCT management agreed to reduce its total compensation and capped potential financial upside x Future Growth Opportunities and Value Creation: Realty Income’s experienced management team has a successful track record of driving dividend growth and producing enhanced stockholder returns x Favorable Analyst Reaction: The transaction has been reviewed favorably by the research analyst community 4 5 6

6 Transaction Summary

7 Transaction Summary • Transaction Value: Realty Income will acquire ARCT for approximately $2.95 billion in a 100% stock transaction at a fixed exchange ratio of 0.2874 shares of Realty Income for each share of ARCT • Implied Price Per Share: As of September 5, 2012, the day prior to the announcement date, Realty Income’s closing price implied a value of $12.21 per share for ARCT 1 , which was a 6.8% premium to ARCT’s average closing price for the 30 calendar days prior to announcement • Pro Forma Enterprise Value: Combined enterprise value is $11.4 2 billion, making Realty Income the largest net lease REIT and 18 th largest U.S. REIT • Ownership Structure: ARCT stockholders will own approximately 25.6% of the combined company’s common stock • Approvals and Timing: Transaction subject to approval of both companies’ stockholders at special meetings scheduled for January 16, 2013 Highly Compelling Offer Unanimously Approved by ARCT and Realty Income’s Boards As in the Best Interests of the Companies and Their Stockholders (1) Implied price per share of $12.21 based on 0.2874 exchange ratio applied to Realty Income’s closing share price of $42.48 on September 5, 2012. (2) As of September 5, 2012, one day prior to announcement date.

8 Ownership of Realty Income, the Best Performing Net Lease REIT Over the Past 40 Years • Merger will result in ARCT stockholders owning Realty Income, the best performing publicly traded net lease REIT • Realty Income has paid 508 consecutive monthly dividends since 1970 and has increased its monthly dividend 68 times since its listing on the New York Stock Exchange in 1994 • Realty Income has increased its annualized dividend 102%, from $0.90 per share in 1994 to $1.82 per share today; upon the closing of the transaction the dividend is expected to increase another 7% to $1.95 per share 1 • Since Realty Income’s listing, the compounded annual return to stockholders has been 17.7%, which is more than 670 bps higher than the Dow Jones Industrial Average, Standard & Poor’s 500, NASDAQ and FTSE NAREIT Index for the same time period 2 (1) Current annualized dividend based on December declared dividend of $0.1514 per share. Projected dividend increase assumes a March 2013 close based on 2013E AFFO. (2) Compounded annual returns per Bloomberg from Realty Income’s NYSE listing on October 18, 1994 through September 30, 2012. As sum es reinvestment of dividends, except for NASDAQ.

9 Compelling Growth Potential to Drive Future Stockholder Value • The combined company will be significantly larger and financially stronger than its competitors and will have one of the lowest cost of capital in a sector where low cost capital creates competitive advantage • The combined company’s cost of capital advantage positions it to grow earnings while increasing dividends • The combined company’s greater scale will facilitate the execution of large transactions through improved access to capital, further enhancing the company’s ability to realize value in the relatively fragmented net lease real estate sector As a Result of the Merger, ARCT Stockholders Stand to Benefit from Greater Risk Adjusted Returns Due to the Enhanced Stability and Diversity of the Combined Property Portfolio
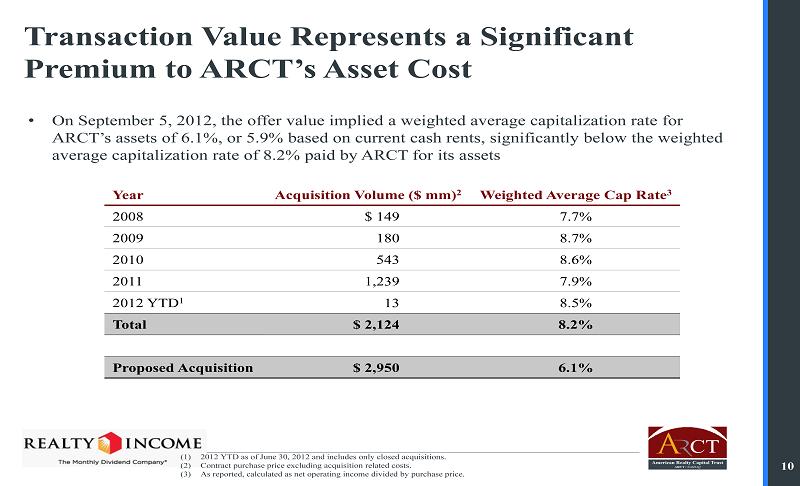
10 Transaction Value Represents a Significant Premium to ARCT’s Asset Cost • On September 5, 2012, the offer value implied a weighted average capitalization rate for ARCT’s assets of 6.1%, or 5.9% based on current cash rents, significantly below the weighted average capitalization rate of 8.2% paid by ARCT for its assets (1) 2012 YTD as of June 30, 2012 and includes only closed acquisitions. (2) Contract purchase price excluding acquisition related costs. (3) As reported, calculated as net operating income divided by purchase price. Year Acquisition Volume ($ mm) 2 Weighted Average Cap Rate 3 2008 $ 149 7.7% 2009 180 8.7% 2010 543 8.6% 2011 1,239 7.9% 2012 YTD 1 13 8.5% Total $ 2,124 8.2% Proposed Acquisition $ 2,950 6.1%

11 Cap Rate is the Lowest of Similar Public Net Lease REIT Transactions Implied Cap Rate Source: Company filings, Wall Street Research and Investor Presentations (1) Represents a 5.9% cash cap rate or 6.1% GAAP cap rate. 5.9% 7.10 - 8.25% 7.6% 7.5% 7.5% 7.4% 7.2% 0.0% 1.0% 2.0% 3.0% 4.0% 5.0% 6.0% 7.0% 8.0% 9.0% American Realty Capital Trust (1) / Realty Income (5 - Sep - 2012) American Financial Realty Trust / Gramercy Capital Corp. (5 - Nov - 2007) Newkirk Realty Trust / Lexington Realty Trust (23 - Jul - 2006) Government Properties Trust / Record Realty Trust (23 - Oct - 2006) Trustreet Properties / General Electric Capital Corporation (30 - Oct - 2006) Spirit Finance Corporation / Investor Group led by Macquarie Bank (13 - Mar - 2007) Capital Automotive REIT / DRA Advisors LLC (6 - Sep - 2005)

12 EBITDA Multiple at High End of Similar Public Net Lease REIT Transactions Implied Forward EBITDA Multipl e 1 (1) Based on announced transaction value and forward consensus median EBITDA estimates. (2) EBITDA estimate of $251.9 million as at 15 - Mar - 2007. As of the announcement date, the EBITDA estimate was $174.0 million implying a transaction multiple of 20.1x. 15.7 x 18.4 x 14.1 x 13.9 x 13.8 x 13.2 x 8.0 x 0.0 x 2.0 x 4.0 x 6.0 x 8.0 x 10.0 x 12.0 x 14.0 x 16.0 x 18.0 x 20.0 x American Realty Capital Trust / Realty Income (5 - Sep - 2012) American Financial Realty Trust / Gramercy Capital Corp. (5 - Nov - 2007) Government Properties Trust / Record Realty Trust (23 - Oct - 2006) Spirit Finance Corporation² / Investor Group led by Macquarie Bank (13 - Mar - 2007) Trustreet Properties / General Electric Capital Corporation (30 - Oct - 2006) Capital Automotive REIT / DRA Advisors LLC (6 - Sep - 2005) Newkirk Realty Trust / Lexington Realty Trust (23 - Jul - 2006) Source: Company filings, DataStream, SNL Financial
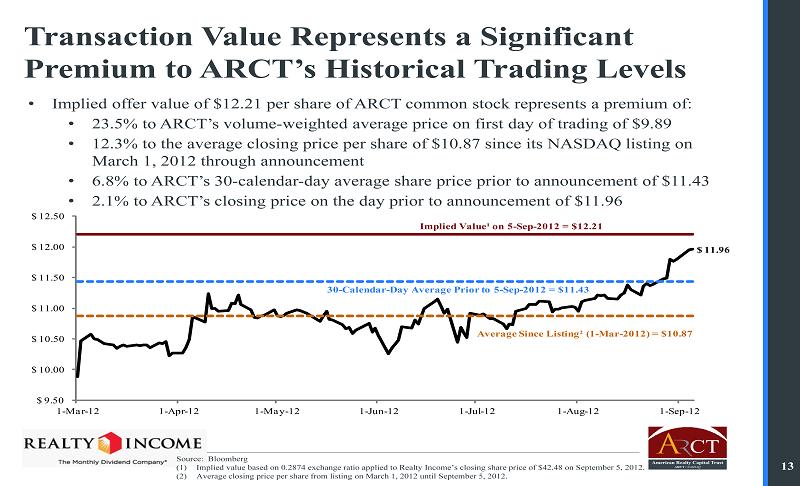
13 Transaction Value Represents a Significant Premium to ARCT’s Historical Trading Levels • Implied offer value of $12.21 per share of ARCT common stock represents a premium of: • 23.5% to ARCT’s volume - weighted average price on first day of trading of $9.89 • 12.3% to the average closing price per share of $10.87 since its NASDAQ listing on March 1, 2012 through announcement • 6.8% to ARCT’s 30 - calendar - day average share price prior to announcement of $11.43 • 2.1% to ARCT’s closing price on the day prior to announcement of $11.96 Source: Bloomberg (1) Implied value based on 0.2874 exchange ratio applied to Realty Income’s closing share price of $42.48 on September 5, 2012. (2) Average closing price per share from listing on March 1, 2012 until September 5, 2012. $ 11.96 $ 9.50 $ 10.00 $ 10.50 $ 11.00 $ 11.50 $ 12.00 $ 12.50 1 - Mar - 12 1 - Apr - 12 1 - May - 12 1 - Jun - 12 1 - Jul - 12 1 - Aug - 12 1 - Sep - 12 Implied Value¹ on 5 - Sep - 2012 = $12.21 Average Since Listing² (1 - Mar - 2012) = $10.87 30 - Calendar - Day Average Prior to 5 - Sep - 2012 = $11.43

14 After a Comprehensive Strategic Review Process the ARCT Board Concluded That the Realty Income Offer Was in the Best Interests of Stockholders Timeline Process Details May 2011 • ARCT filed 8 - K to announce it was evaluating strategic alternatives — Board hired Goldman, Sachs & Co. as financial advisor and Proskauer Rose LLP as external legal counsel Early June 2011 to September 2011 • Over 40 parties were contacted regarding interest in engaging in a potential acquisition of ARCT • 18 parties entered dataroom • 6 parties submitted non - binding indications of interest — No proposal was above ARCT’s initial public offering price of $10.00 per share — Several proposals only related to the acquisition of a portion of ARCT’s portfolio June 29, 2011 • Realty Income submitted a proposal to acquire ARCT’s real estate portfolio as of May 31, 2011 (350 properties) with consideration in the form of cash, restricted and unrestricted common stock and convertible preferred stock — Complex offer inadequate and difficult to value — Burdened stockholders with liquidity constraints February 21, 2012 • Realty Income submitted a new non - binding indicative proposal, at a price of $10.25 per share, composed of a fixed exchange ratio of 0.168 and $4.10 per share in cash March 1, 2012 • ARCT internalized its management services and listed on the NASDAQ

15 Transaction Results From Comprehensive Strategic Review Process (Continued) Timeline Process Details Early August 2012 • In August 2012, Realty Income contacted ARCT to indicate interest in revisiting a possible strategic transaction with ARCT August 16, 2012 • Realty Income proposed an exchange ratio of 0.2841 for 100% stock consideration that was rejected by ARCT as being insufficient August 17, 2012 • The exchange ratio was negotiated upward to 0.2874 August 2012 to Early September 2012 • ARCT’s board of directors met several times to review Realty Income’s proposals and discuss the merger agreement • The independent directors also met several times to discuss various aspects of the proposed merger September 5, 2012 • Realty Income’s board of directors unanimously approved the transaction September 6, 2012 • ARCT’s board of directors unanimously approved the transaction • Transaction was announced before market open through a joint press release issued by ARCT and Realty Income

16 Transaction Has Been Reviewed Favorably By the Research Analyst Community • “In our view, O’s deal for ARCT is an attractive one as it has the lowest capital costs in the public markets and we don’t se e better offers being out there for the enterprise.” - J.P. Morgan research report, “3Q a Penny Shy of Our Estimate on Lighter Revenue; Deal Volume as Expected” - October 25, 2012 1 • “Points for Solid Execution: Sure, commercial real estate values have gone up since ARCT bought most of its properties. But i f they have appreciated at the same pace as, say, the typical strip center owned by the REITs in our coverage universe, then th e weighted average cap rate at today’s values would be about 7.3%. The giant gap between that figure and the 5.9% cap rate ARCT management is selling the company for suggests great execution by them on behalf of their shareholders.” - Green Street Advisors research report, “A Rare Non - Traded REIT ‘Success’ Story” - September 11, 2012 1 • “In all, through both a major acquisition like ARCT and the consistent level of acquisition activity on a quarterly basis, Re alt y Income is poised for substantial growth in our view.” - RBC Capital Markets research report, “3Q Earnings Review: Operations, Acqs Strong; Raising 12/13 Est , Introducing ‘14” - October 29, 2012 1 • “For ARCT shareholders, the benefits include a decline in cost of and a greater access to capital, overhead savings, and partnering with the best in class management team with a track record of producing attractive shareholder returns and dividen d growth.” - JMP Securities research report, “Merger Overshadows 3Q Report; Maintain MP” - November 2, 2012 1 • “For shareholders in American Realty Capital Trust, yesterday’s announcement will be greeted with justifiable smiles and applause; especially given the negative news that has been flowing from the non - traded REIT space over the past year or so…Bottom line: AR Capital’s and ARCT management’s interests were aligned with those of rank - and - file investors, and ARCT definitely did the right thing.” - REIT Wrap publication - September 7, 2012 1 (1) Permission for quotation was neither sought nor obtained.
17 Overview of Realty Income

18 Overview of Realty Income • Realty Income (NYSE: O) is an $8.7 billion commercial real estate company with a Baa1/BBB/BBB+ (Moody’s/S&P/Fitch) credit rating • Founded in 1969 to provide monthly dividends to stockholders through the ownership of net lease real estate • 508 consecutive monthly dividends with 68 dividend increases since NYSE listing in 1994 • Monthly dividends supported by cash flow from long - term leases • Over 2,750 properties under long - term leases to commercial and retail tenants • Significant growth since NYSE listing in 1994 • Total capitalization increased from $402 million to $8.7 billion • Properties owned increased from 630 to 2,838 • Property square footage increased from 4.1 million to 34.3 million • Tenant industries increased from 5 to 44 • Share price increased from $8.00 to $40.17 • Dividend per share increased from $0.90 per share to $1.95 per share, pro forma for this transaction Note: Capitalization and share price as of December 5, 2012.

19 Realty Income’s Long - Term Goals • Moderate FFO growth • Moderate dividend growth • Maintain a conservative business strategy that does not take excessive risk in the pursuit of objectives • Maintain a conservative financial position for stockholders — Debt : Maximum 20 - 35% — Preferred: Maximum 10 - 15% — In terest Coverage Ratio: 3.0x or above — Fi xed Charge Ratio: 2.5x or above • Solid dividend coverage — Payout Ratio: At or below 85% Realty Income Delivers Consistent Earnings and Dividend Growth Using Conservative Operating and Balance Sheet Strategies

20 Proven Track Record of Consistent Dividend Growth • Realty Income has a consistent track record of generating dividend growth over its 18 years as a public company • Realty Income has increased its dividend 68 times since its 1994 NYSE listing and has had 508 consecutive monthly dividends • The dividend has increased every year since the listing 1 Source: Bloomberg (1) Annualized dividend amount reflects the December declared dividend rate per share multiplied by twelve. $0.90 $0.93 $0.95 $0.96 $1.02 $1.08 $1.11 $1.14 $1.17 $1.20 $1.32 $1.40 $1.52 $1.64 $1.70 $1.72 $1.73 $1.75 $1.82 $1.95 1994 1995 1996 1997 1998 1999 2000 2001 2002 2003 2004 2005 2006 2007 2008 2009 2010 2011 2012 Pro Forma

21 Realty Income Has Achieved Outsized Returns Relative to Major Indices Including the S&P 500 (1) Calculated as the difference between closing stock price as of period end, less the closing stock price as of previous perio d. (2) Per NAREIT website and Factset . Includes reinvestment of dividends. (3) Price only index, does not include dividends. Source: Factset . Bank of America Merrill Lynch $40.00 HOLD Janney Montgomery $44.00 HOLD RBC Capital Markets $43.00 HOLD Robert W. Baird & Co. $48.00 STRONG BUY UBS $42.00 HOLD Compounded Annual Return 17.7% 11.0% 9.6% 8.5% 8.3% Realty Income¹ FTSE NAREIT Equity Index² Dow Jones Industrial Average¹ S&P 500¹ NASDAQ³ Source: Bloomberg. Note: All of these compounded average annual total return rates are calculated in the same manner: from Realty Income’s NYSE listing on October 18, 1994 through September 30, 2012 and assuming reinvestment of dividends, except for NASDAQ. Past performance does not guarantee future performance. Realty Income presents this data only for informational purposes and makes no representation about its future performance or how it will compare in performance to other indices in the future.

22 Combined Company Highlights
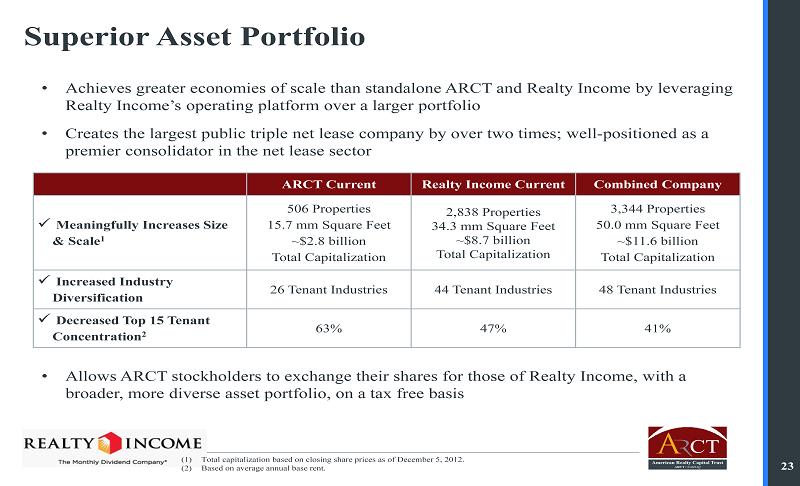
23 Superior Asset Portfolio • Achieves greater economies of scale than standalone ARCT and Realty Income by leveraging Realty Income’s operating platform over a larger portfolio • Creates the largest public triple net lease company by over two times; well - positioned as a premier consolidator in the net lease sector ARCT Current Realty Income Current Combined Company x Meaningfully Increases Size & Scale 1 506 Properties 15.7 mm Square Feet ~$2.8 billion Total Capitalization 2,838 Properties 34.3 mm Square Feet ~$8.7 billion Total Capitalization 3,344 Properties 50.0 mm Square Feet ~$11.6 billion Total Capitalization x Increased Industry Diversification 26 Tenant Industries 44 Tenant Industries 48 Tenant Industries x Decreased Top 15 Tenant Concentration 2 63% 47% 41% (1) Total capitalization based on closing share prices as of December 5, 2012. (2) Based on average annual base rent. • Allows ARCT stockholders to exchange their shares for those of Realty Income, with a broader, more diverse asset portfolio, on a tax free basis

24 Consolidation Opportunity • Estimated $1.5 to $2.0 trillion of U.S. real estate is held by corporate owners / users • Highly fragmented market without a dominant type of investor • Sector is underpenetrated by public companies • Limited competition from investors due to constricted bank lending market • Increased transaction volume signifies more inventory from sellers to transact Source: Public filings and Real Capital Analytics. Represents total market value of real estate owned by O, NNN, EPR, ARCT, LXP, SIR, GTY and LSE. Fragmented Net Lease Market Provides Ample Opportunity for Realty Income to Continue to Grow Estimated Ownership Profile $39.3 $9.3 $21.3 Aug. 2007 Sep. 2009 Mar. 2012 TTM Transaction Volume ($ in billions) Publicly Owned (<5 %) (1) Not Publicly Owned (>95%) Realty Income Can Drive Higher Earnings and Earnings Growth than Any of its Public Comparables Due to Significant Cost of Capital Advantage

25 Size is a Competitive Advantage and Drives Value Source: Bloomberg (1) Average total return of the top 20 largest REITs by equity market capitalization at the end of each year, per NAREIT. Total Return The Largest REITs Consistently Outperform The Broader REIT Market • Average annual outperformance of 4.5% 5.7% 39.8% 36.8% 15.7% 42.8% (13.6)% (21.3)% 31.6% 29.6% 10.8% 16.9% 3.6% 36.7% 31.5% 12.1% 35.9% (16.8)% (38.0)% 28.6% 28.5% 8.7% 14.9% 2002 2003 2004 2005 2006 2009 2010 2011 2012 Top 20 Largest REITs¹ MSCI U.S. REIT Index 2007 2008

26 $681 $505 $335 $332 $256 $176 O (PF) O NNN LXP EPR ARCT Combined Company Increased Size and Scale • Largest public triple net lease company by over two times • 18 th largest public U.S. REIT • Cost of capital, operational and economies of scale advantages • Increased float and liquidity • Pro forma real estate revenue to be approximately 35% higher • Realty Income positioned as the premier consolidator in the net lease sector • Realty Income’s acquisition volume through 3Q 2012 far exceeds that of ARCT’s — Realty Income has acquired properties at the rate of approximately $80 million per month while ARCT has acquired approximately $5 million per month Note: $ in millions. Stock price as of December 5, 2012 used to calculate Total Market Capitalization. Rental revenues and deb t plus preferred per 3Q 2012 Company filings. 7,205 5,361 3,831 1,893 2,161 1,860 4,352 3,305 1,473 2,037 1,696 959 $11,556 $8,665 $5,304 $3,930 $3,857 $2,820 O (PF) O NNN LXP EPR ARCT Total Market Capitalization Annual Rental Revenues Equity Value Total Debt + Preferred
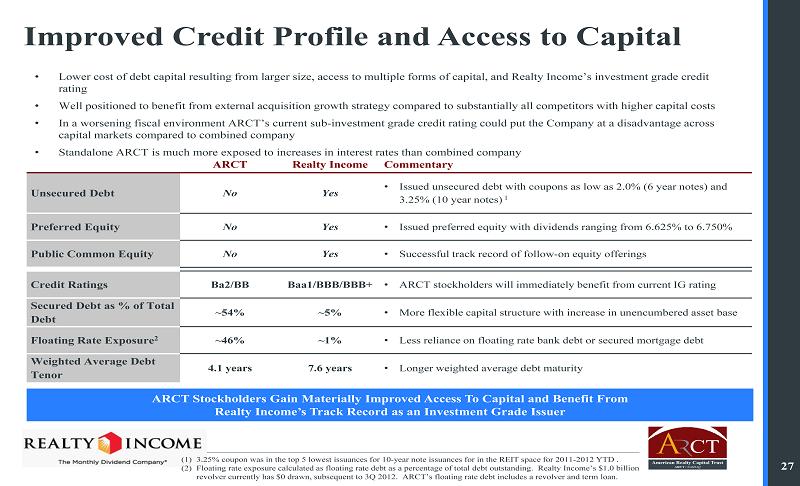
27 Improved Credit Profile and Access to Capital • Lower cost of debt capital resulting from larger size, access to multiple forms of capital, and Realty Income’s investment gr ade credit rating • Well positioned to benefit from external acquisition growth strategy compared to substantially all competitors with higher ca pit al costs • In a worsening fiscal environment ARCT’s current sub - investment grade credit rating could put the Company at a disadvantage acro ss capital markets compared to combined company • Standalone ARCT is much more exposed to increases in interest rates than combined company ARCT Realty Income Commentary Unsecured Debt No Yes • Issued unsecured debt with coupons as low as 2.0% (6 year notes) and 3.25% (10 year notes) 1 Preferred Equity No Yes • Issued preferred equity with dividends ranging from 6.625% to 6.750% Public Common Equity No Yes • Successful track record of follow - on equity offerings Credit Ratings Ba2/BB Baa1/BBB/BBB+ • ARCT stockholders will immediately benefit from current IG rating Secured Debt as % of Total Debt ~54% ~5% • More flexible capital structure with increase in unencumbered asset base Floating Rate Exposure 2 ~46% ~1% • Less reliance on floating rate bank debt or secured mortgage debt Weighted Average Debt Tenor 4.1 years 7.6 years • Longer weighted average debt maturity ARCT Stockholders Gain Materially Improved Access To Capital and Benefit From Realty Income’s Track Record as an Investment Grade Issuer (1) 3.25% coupon was in the top 5 lowest issuances f or 10 - year note issuances for in the REIT space for 2011 - 2012 YTD . (2) Floating rate exposure calculated as floating rate debt as a percentage of total debt outstanding. Realty Income’s $1.0 bill ion revolver currently has $0 drawn, subsequent to 3Q 2012. ARCT’s floating rate debt includes a revolver and term loan.

28 ARCT’s Long Term Balance Sheet Goals Met Immediately • ARCT Balance Sheet Goal: ARCT’s long term balance sheet goal is to reduce levels of secured and floating rate debt and increase weighted average debt maturity in pursuit of an investment grade corporate credit rating • ARCT Balance Sheet Risks: On a standalone basis, ARCT’s goal to reduce the use of floating rate debt and increase debt duration in order to improve its Ba2/BB credit ratings is subject to significant timing and execution risks • Impact on ARCT of Interest Rate Increase: The table below illustrates how ARCT’s standalone AFFO per share, and ability to cover its current dividend (“payout ratio”), could be negatively affected by potential increases in interest rates 1 • Realty Income’s Balance Sheet Advantage: Realty Income’s debt is primarily fixed rate and long term and its investment grade balance sheet and proven access to the unsecured bond markets allow immediate recapitalization of ARCT’s variable rate debt o n highly favorable terms • Combined Balance Sheet Benefits: Pro forma for the transaction, the combined company will be rated Baa1/BBB/BBB+ and will enjoy a much longer weighted average debt maturity than ARCT standalone (7.8 years vs. 4.1 years), further solidifying t he viability of distributable cash flows and dividends Access to Realty Income’s Long - Term, Fixed - Rate Debt Meets All of ARCT’s Balance Sheet Goals Immediately, Significantly Reducing ARCT’s Floating Rate Interest Exposure and Debt Recapitalization Risk (1) $387 million of floating rate debt outstanding as of September 30, 2012 at a weighted average interest rate of 2.55%. (2) Illustrative interest rate increase multiplied by $387 million floating rate debt outstanding. (3) Illustrative increase in interest expense divided by 159 million diluted shares outstanding as of 3Q 2012. (4) 3Q 2012 announced AFFO per share of $0.19, annualized, less illustrative decrease in AFFO per share. (5) Illustrative pro forma payout ratio assumes constant annualized dividend of $0.715 per share. Illustrative Interest Rate Increase in Floating Rate Debt Illustrative Annual Interest Expense Increase² ($ in millions) Illustrative Annual Decrease in AFFO Per Share³ ($) Illustrative Pro Forma Annual AFFO Per Share4 Illustrative Pro Forma AFFO Per Share Decrease (%) Illustrative Pro Forma Payout Ratio5 (%) 0bps $0.0 $0.00 $0.76 0.0% 94.1% 50bps 1.9 (0.01) 0.75 (1.6)% 95.6% 100bps 3.9 (0.02) 0.74 (3.2)% 97.2% 150bps 5.8 (0.04) 0.72 (4.8)% 98.8% 200bps 7.7 (0.05) 0.71 (6.4)% 100.5% 250bps 9.7 (0.06) 0.70 (8.0)% 102.3% 300bps 11.6 (0.07) 0.69 (9.6)% 104.1%

29 Investment Grade Debt Profile • The combined company will have few near - term debt maturities and well - laddered maturities after 2017 • Weighted average debt duration increases from 4.1 years for ARCT to 7.8 years combined • Secured debt as a percentage of total debt decreases from 54% for ARCT to 17% combined • Variable rate debt as a percentage of total debt decreases from 46% for ARCT to 1% combined Note: Based on company 3Q 2012 filings. 26.9 111.4 252.9 23.0 178.0 100.0 150.0 275.0 175.0 2,365.6 $126.9 $44.6 $261.4 $527.9 $198.0 $2,543.6 2013 2014 2015 2016 2017 Thereafter Mortgage Debt Senior Unsecured Notes

30 Conclusion

31 A Compelling Transaction for ARCT’s Stockholders x Premium Valuation: Realty Income is valuing ARCT’s assets at a significantly higher price and lower cap rate than ARCT’s cost basis, which represents the lowest cap rate of similar net lease REIT transactions 1 – 5.9% cash cap rate / 6.1% GAAP cap rate vs. 8.2% weighted average cap rate basis – Cap rate is significantly lower than similar transactions, which range from 7.1% - 8.25% 1 – 15.7x forward EBITDA multiple represents second highest amongst similar REIT transactions 2 x Ideal Strategic Buyer: Realty Income represents the ideal strategic buyer given their business focus, size and scale, investment grade balance sheet / cost of capital and share liquidity x No Inquiries Received: Since announcement of the transaction, no third party has approached ARCT or its advisors with an alternative transaction or with a request for information despite low break fee of ~1.7% of transaction value 1 2 3 (1) See page 11 for similar transaction cap rates. (2) See page 12 for similar transaction forward EBITDA multiples.

32 A Compelling Transaction for ARCT’s Stockholders (Continued) x Alignment of Interests: Pro forma for the transaction, ARCT management will own ~$45 million of equity in Realty Income, including over $25 million of existing equity in ARCT – As part of the merger agreement, ARCT management agreed to reduce its total compensation and capped potential financial upside x Future Growth Opportunities and Value Creation: Realty Income’s experienced management team has a successful track record of driving dividend growth and producing enhanced stockholder returns x Favorable Analyst Reaction: The transaction has been reviewed favorably by the research analyst community 4 5 6

33 Appendix

34 Break Fee Represents One of the Lowest Break Fees in Similar REIT Transactions Break Fee Represents ~1.7% of Transaction Value Source: SNL Financial Buyer Seller Date Announced Reported Breakup Fee ($ 000) Reported Deal Value ($ mm) Breakup Fees As % of Deal Value Buyer Seller Date Announced Reported Breakup Fee ($ 000) Reported Deal Value ($ mm) Breakup Fees As % of Deal Value SL Green Realty Corp. Reckson Associates 8/3/2006 $ 99,800 $ 3,720.3 2.68% Apollo Investment Corp. Innkeepers USA Trust 4/15/2007 $ 17,000 $ 871.0 1.95% Developers Diversified Realty Inland Retail REIT 10/20/2006 80,000 3,708.0 2.16% ProLogis Meridian Industrial Trust 11/16/1998 40,000 852.3 4.69% ProLogis Catellus Development Corp. 6/5/2005 90,000 3,599.2 2.50% Eaton Vance-ProLogis Ptnshp Keystone Property Trust 5/3/2004 27,000 847.7 3.18% Simon Property Group Inc. Chelsea Property Group Inc. 6/20/2004 110,000 3,554.1 3.10% Duke Realty Investments Inc. Weeks Corp. 2/28/1999 50,000 825.0 6.06% Morgan Stanley CNL Hotels & Resorts 1/18/2007 145,000 3,217.9 4.51% Security Capital Group Inc. Storage USA Inc. 12/5/2001 22,500 816.5 2.76% General Electric Co. Arden Realty Inc. 12/21/2005 100,000 3,141.9 3.18% Colonial Properties Trust Cornerstone Realty Income Trst 10/25/2004 17,000 749.0 2.27% Public Storage Inc. Shurgard Storage Centers Inc. 3/6/2006 125,000 3,106.0 4.02% Olympus Real Estate Corp Walden Residential Properties 9/24/1999 26,750 748.0 3.58% Georgia-Pacific Corp. Plum Creek Timber Co. 7/18/2000 100,000 2,986.0 3.35% Metropolitan Partners LLC Tower Realty Trust Inc. 12/8/1998 16,750 739.4 2.27% Blackstone Group L.P. CarrAmerica Realty Corp. 3/5/2006 70,000 2,899.2 2.41% U.S. Restaurant Properties CNL Restaurant Properties Inc. 8/9/2004 20,000 710.7 2.81% Morgan Stanley Crescent Real Estate Equities 5/22/2007 64,200 2,885.2 2.23% Inland American Real Estate Apple Hospitality Five Inc. 7/25/2007 15,000 678.3 2.21% Equity Office Properties Trust Cornerstone Properties Inc. 2/11/2000 100,000 2,725.7 3.67% Equity Residential Properties Evans Withycombe Residential 8/27/1997 14,000 663.6 2.11% DRA Advisors Capital Automotive REIT 9/2/2005 40,000 2,236.2 1.79% Heritage Property Investment Bradley Real Estate Inc. 5/15/2000 15,000 596.4 2.51% Archstone Communities Trust Charles E. Smith Residential 5/3/2001 95,000 1,842.5 5.16% General Growth Properties Inc. JP Realty Inc. 3/3/2002 21,000 525.3 4.00% Centro Watt Heritage Property Investment 7/9/2006 65,000 1,787.0 3.64% Kimco Realty Corp. Price REIT Inc. 1/13/1998 12,500 521.1 2.40% Starwood Financial Trust TriNet Corporate Realty Trust 6/15/1999 50,000 1,690.5 2.96% Health Care Property Investors American Health Properties Inc 8/4/1999 18,700 504.3 3.71% Investor group Spirit Finance Corp. 3/12/2007 31,000 1,583.6 1.96% Equity Residential Properties Wellsford Residential Property 1/16/1997 14,000 489.0 2.86% Simon Property Group Inc. DeBartolo Realty Corp. 3/26/1996 35,000 1,462.4 2.39% ING Groep NV Apple Hospitality Two Inc. 2/15/2007 18,694 467.3 4.00% General Electric Co. Franchise Finance Corp. 3/30/2001 60,000 1,411.1 4.25% Inland American REIT Inc. Winston Hotels Inc. 4/2/2007 11,000 460.8 2.39% Goldman Sachs Group Inc. Equity Inns Inc. 6/20/2007 38,000 1,287.2 2.95% US Retail Partners, LLC First Washington Realty Trust 9/27/2000 18,000 458.5 3.93% Bay Apartment Communities Avalon Properties Inc. 3/9/1998 10,000 1,255.6 0.80% Health Care REIT Inc. Windrose Medical Properties 9/12/2006 20,300 447.0 4.54% J.E. Robert Company Inc. Highland Hospitality Corp. 4/24/2007 50,000 1,209.9 4.13% Liberty Property Trust Republic Property Trust 7/23/2007 16,000 435.0 3.68% Morgan Stanley AMLI Residential Properties 10/23/2005 40,000 1,191.7 3.36% LBA Realty LLC Bedford Property Investors 2/10/2006 16,000 434.9 3.68% General Electric Co. Trustreet Properties Inc. 10/30/2006 42,000 1,151.6 3.65% Westbrook/Sunstone Mgmt Sunstone Hotel Investors Inc. 7/12/1999 25,000 388.0 6.44% Blackstone Group L.P. MeriStar Hospitality 2/20/2006 21,000 1,129.3 1.86% Developers Diversified Realty JDN Realty Corp. 10/4/2002 16,000 386.5 4.14% Gramercy Capital Corp. American Financial Realty Tr. 11/2/2007 32,000 1,120.3 2.86% CNL Hospitality Properties RFS Hotel Investors Inc. 5/8/2003 15,000 382.3 3.92% Camden Property Trust Summit Properties Inc. 10/4/2004 50,000 1,111.0 4.50% Pennsylvania REIT Crown American Realty Trust 5/13/2003 20,000 381.5 5.24% CalWest Industrial Properties Cabot Industrial Trust 10/28/2001 35,000 1,071.8 3.27% Public Storage Inc. Storage Trust Realty 11/12/1998 12,000 377.3 3.18% Hometown America LLC Chateau Communities Inc. 5/29/2003 40,000 1,028.5 3.89% Post Properties Inc. Columbus Realty Trust 8/1/1997 10,000 377.0 2.65% JV of Morgan Stanley / Onex Town & Country Trust 12/19/2005 28,000 930.5 3.01% GEO Group Inc. CentraCore Properties Trust 9/19/2006 9,000 355.8 2.53% Morgan Stanley Glenborough Realty Trust Inc. 8/20/2006 27,750 926.0 3.00% Camden Property Trust Paragon Group Inc. 12/16/1996 10,000 342.8 2.92% DRA Advisors CRT Properties Inc. 6/17/2005 40,000 902.7 4.43% Morguard Corp. Sizeler Property Investors 8/7/2006 NA 325.3 N/A Average Break Fee 3.28% n220

35 You May Contact Us At Brian Jones Chief Financial Officer O FFICE (646) 937 - 6903 E MAIL bjones@arctreit.com Heather Gentry Vice President of Investor Relations O FFICE (646) 937 - 6904 E MAIL hgentry@arctreit.com Tere H. Miller Vice President Corporate Communications E MAIL IR @realtyincome.com Realty Income 600 La Terraza Blvd., Escondido, CA 92025 www.realtyincome.com American Realty Capital Trust 405 Park Avenue, New York, NY 10022 www.arctreit.com