Attached files
| file | filename |
|---|---|
| 8-K - FORM 8-K - UNITED COMMUNITY FINANCIAL CORP | d455266d8k.htm |
Exhibit 99
| 2012 Annual MeetingDecember 2012 |

| Patrick W. Bevack President and Chief Executive Officer |
| Forward-Looking Statement Disclosure 3 When used in this presentation the words or phrases "will likely result," "are expected to," "will continue," "is anticipated," "estimate," "project" or similar expressions are intended to identify "forward-looking statements" within the meaning of the Private Securities Litigation Reform Act of 1995. Such statements are subject to certain risks and uncertainties, including changes in economic conditions in United Community's market area, changes in policies by regulatory agencies, fluctuations in interest rates, demand for loans in Home Savings' market area, and competition, that could cause actual results to differ materially from results presently anticipated or projected. United Community cautions readers not to place undue reliance on any such forward-looking statements, which speak only as of the date made. United Community advises readers that the factors listed above could affect United Community's financial performance and could cause United Community's actual results for future periods to differ materially from any opinions or statements expressed with respect to future periods in any current statements. United Community undertakes no obligation to update any forward-looking statement to reflect events or circumstances after the date on which the statement is made. Actual results may differ materially from our statements due to a number of risks and uncertainties, including those described in the Company's Form 10-K for the year ended December 31, 2011 and subsequent filings. Please refer to these SEC documents for a complete list of risk factors. |
| Non-GAAP Financial Measures 4 This presentation contains financial information determined by methods other than those prescribed by accounting principles generally accepted in the United States of America ("GAAP"). Management uses these non-GAAP financial measures because it believes that they are useful for evaluating our operations and performance over periods of time, as well as in managing and evaluating our business and in discussions about our operations and performance. Management believes these non-GAAP financial measures provide users of our financial information with meaningful measures for assessing our financial results, as well as a comparison to financial results for prior periods. These non-GAAP financial measures should not be considered as a substitute for financial measures determined in accordance with GAAP and may not be comparable to other similarly titled financial measures used by other companies. A reconciliation of the differences between our non-GAAP financial measures and the most comparable GAAP measures accompanies the use of such non- GAAP financial measures within the body of this presentation. |
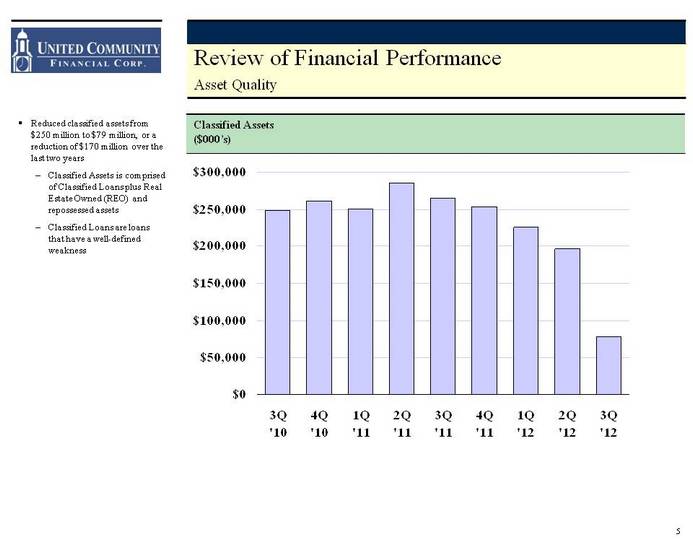
| Review of Financial Performance Asset Quality 3Q '10 4Q '10 1Q '11 2Q '11 3Q '11 4Q '11 1Q '12 2Q '12 3Q '12 East 249046 261708 251002 285532 264712 253914 225112 196617 78579 Classified Assets($000's) 5 Reduced classified assets from $250 million to $79 million, or a reduction of $170 million over the last two yearsClassified Assets is comprised of Classified Loans plus Real Estate Owned (REO) and repossessed assetsClassified Loans are loans that have a well-defined weakness |
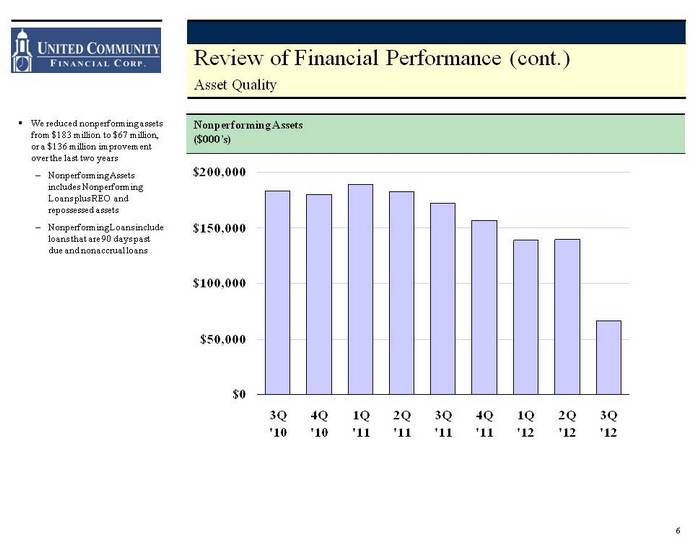
| Review of Financial Performance (cont.) Asset Quality 3Q '10 4Q '10 1Q '11 2Q '11 3Q '11 4Q '11 1Q '12 2Q '12 3Q '12 East 183010 179867 188729 182774 172398 156581 138965 139307 66763 Nonperforming Assets($000's) 6 We reduced nonperforming assets from $183 million to $67 million, or a $136 million improvement over the last two yearsNonperforming Assets includes Nonperforming Loans plus REO and repossessed assetsNonperforming Loans include loans that are 90 days past due and nonaccrual loans |
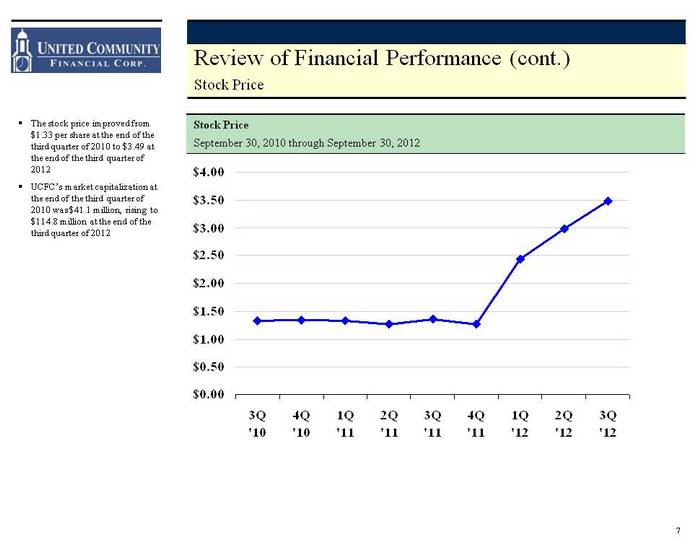
| Review of Financial Performance (cont.) Stock Price 3Q '10 4Q '10 1Q '11 2Q '11 3Q '11 4Q '11 1Q '12 2Q '12 3Q '12 East 1.33 1.34 1.33 1.27 1.35 1.27 2.44 2.98 3.49 Stock PriceSeptember 30, 2010 through September 30, 2012 7 The stock price improved from $1.33 per share at the end of the third quarter of 2010 to $3.49 at the end of the third quarter of 2012UCFC's market capitalization at the end of the third quarter of 2010 was $41.1 million, rising to $114.8 million at the end of the third quarter of 2012 |
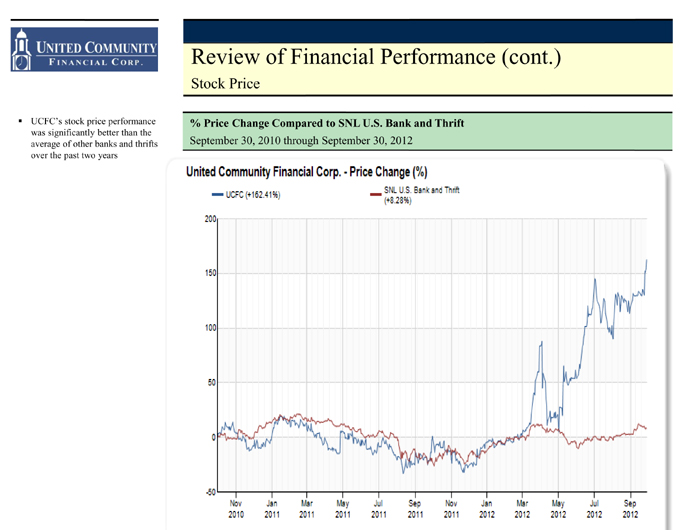
| Review of Financial Performance (cont.) Stock Price % Price Change Compared to SNL U.S. Bank and Thrift September 30, 2010 through September 30, 2012 UCFC's stock price performance was significantly better than the average of other banks and thrifts over the past two years |
| James R. Reske Chief Financial Officer and Treasurer |
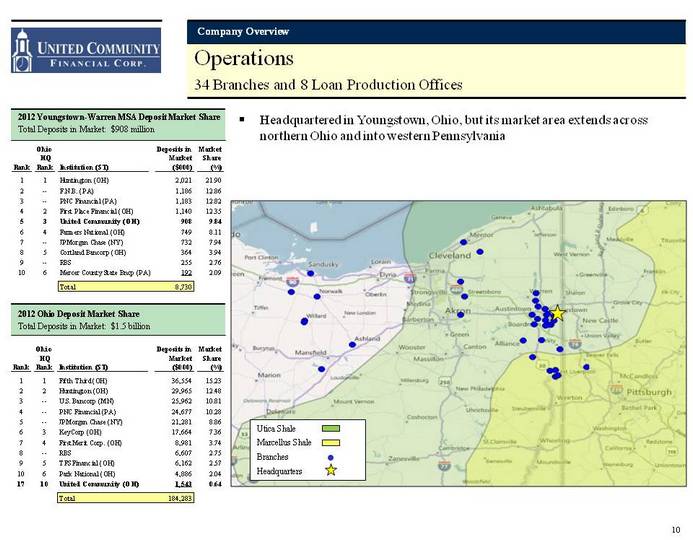
| Operations 34 Branches and 8 Loan Production Offices Headquartered in Youngstown, Ohio, but its market area extends across northern Ohio and into western Pennsylvania Company Overview Utica Shale Marcellus Shale BranchesHeadquarters 2012 Ohio Deposit Market Share Total Deposits in Market: $1.5 billion 2012 Youngstown-Warren MSA Deposit Market ShareTotal Deposits in Market: $908 million 10 |
| Bulk Loan Sale Third Quarter 2012 11 In the first half of 2012, the Company reduced classified assets by $57.3 million Home Savings successfully completed a bulk sale of a substantial amount of the Bank's troubled loans, along with other assets, to an unrelated party on September 21, 2012As a result of the transaction, the Bank has now exceeded the asset quality targets set forth in its recent Consent OrderThe bulk sale lifted $92.7 million of classified assets off the booksThe Consent Order required the Bank to reduce total adversely classified assets to a level at or below:$219.2 million by September 30, 2012 $146.0 million by March 31, 2013Post sale, classified assets were approximately $78.6 million at September 30, 2012 compared to their peak of $291.5 million at May 31, 2011The Company recorded a $29.4 million loss in the third quarter, along with other transaction related expensesThe Bank's tier 1 leverage ratio remains over 8%, despite the loss Major Accomplishments in 2012 |
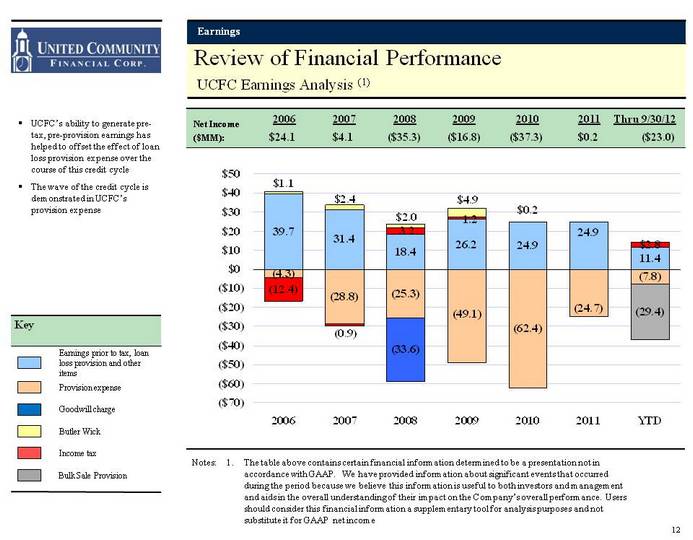
| Review of Financial Performance UCFC Earnings Analysis (1) Earnings prior to tax, loan loss provision and other items Provision expense Goodwill charge Key Income tax UCFC's ability to generate pre- tax, pre-provision earnings has helped to offset the effect of loan loss provision expense over the course of this credit cycleThe wave of the credit cycle is demonstrated in UCFC's provision expense Butler Wick Earnings Notes: 1. The table above contains certain financial information determined to be a presentation not in accordance with GAAP. We have provided information about significant events that occurred during the period because we believe this information is useful to both investors and management and aids in the overall understanding of their impact on the Company's overall performance. Users should consider this financial information a supplementary tool for analysis purposes and not substitute it for GAAP net income 12 ($MM): $24.1 $4.1 ($35.3) ($16.8) ($37.3) $0.2 ($23.0) 2006 2007 2008 Net Income 2009 2010 2011 Thru 9/30/12 Bulk Sale Provision 2006 2007 2008 2009 2010 2011 YTD MSR -25.3 -49.1 -62.4 -24.7 -7.8 Securities charge Goodwill -33.6 -29.4 Provision expense -4.3 -28.8 HSL income prior to tax, provision and extraordinary items 39.7 31.4 18.4 26.2 24.9 24.9 11.4 Tax -12.4 -0.9 3.2 0.2 2.8 1.2 |
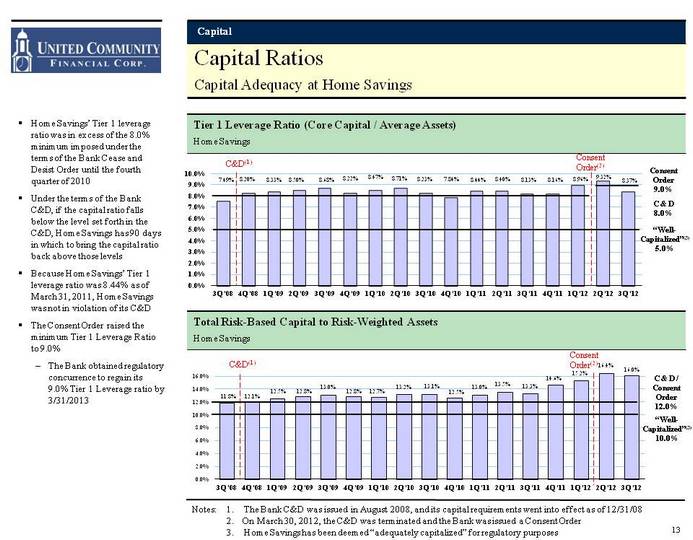
| Capital Ratios Capital Adequacy at Home Savings (CHART) C & D 8.0% "Well- Capitalized"(3)5.0% Tier 1 Leverage Ratio (Core Capital / Average Assets)Home Savings Home Savings' Tier 1 leverage ratio was in excess of the 8.0% minimum imposed under the terms of the Bank Cease and Desist Order until the fourth quarter of 2010Under the terms of the Bank C&D, if the capital ratio falls below the level set forth in the C&D, Home Savings has 90 days in which to bring the capital ratio back above those levelsBecause Home Savings' Tier 1 leverage ratio was 8.44% as of March 31, 2011, Home Savings was not in violation of its C&DThe Consent Order raised the minimum Tier 1 Leverage Ratio to 9.0%The Bank obtained regulatory concurrence to regain its 9.0% Tier 1 Leverage ratio by 3/31/2013 Notes: 1. The Bank C&D was issued in August 2008, and its capital requirements went into effect as of 12/31/08 2. On March 30, 2012, the C&D was terminated and the Bank was issued a Consent Order 3. Home Savings has been deemed "adequately capitalized" for regulatory purposes C&D(1) Total Risk-Based Capital to Risk-Weighted AssetsHome Savings (CHART) C & D / Consent Order 12.0% "Well- Capitalized"(3)10.0% C&D(1) 13 Capital Consent Order(2) Consent Order 9.0% Consent Order(2) |
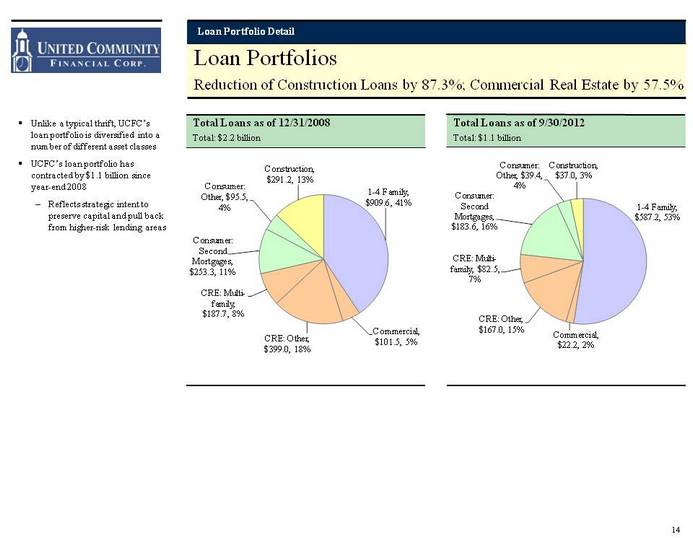
| Loan Portfolios Reduction of Construction Loans by 87.3%; Commercial Real Estate by 57.5% Unlike a typical thrift, UCFC's loan portfolio is diversified into a number of different asset classesUCFC's loan portfolio has contracted by $1.1 billion since year-end 2008Reflects strategic intent to preserve capital and pull back from higher-risk lending areas Loan Portfolio Detail Total Loans as of 9/30/2012Total: $1.1 billion 14 Total Loans as of 12/31/2008Total: $2.2 billion |
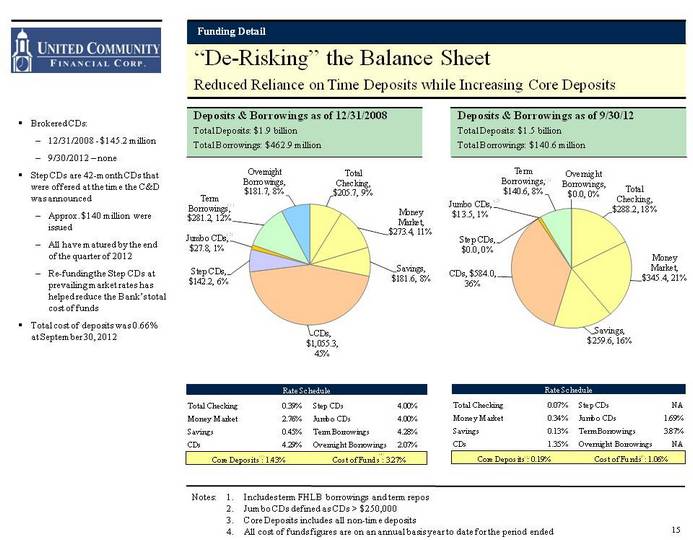
| Brokered CDs:12/31/2008 - $145.2 million9/30/2012 - noneStep CDs are 42-month CDs that were offered at the time the C&D was announcedApprox. $140 million were issuedAll have matured by the end of the quarter of 2012Re-funding the Step CDs at prevailing market rates has helped reduce the Bank's total cost of fundsTotal cost of deposits was 0.66% at September 30, 2012 Deposits & Borrowings as of 12/31/2008 Total Deposits: $1.9 billion Total Borrowings: $462.9 million Deposits & Borrowings as of 9/30/12Total Deposits: $1.5 billionTotal Borrowings: $140.6 million Funding Detail (3) (3) (4) (4) Notes: 1. Includes term FHLB borrowings and term repos 2. Jumbo CDs defined as CDs > $250,000 3. Core Deposits includes all non-time deposits 4. All cost of funds figures are on an annual basis year to date for the period ended 15 "De-Risking" the Balance Sheet Reduced Reliance on Time Deposits while Increasing Core Deposits |

| Going Forward |
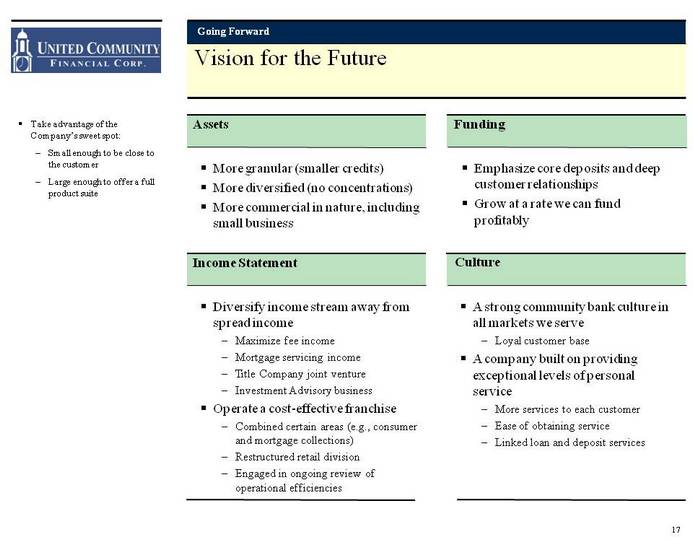
| Diversify income stream away from spread incomeMaximize fee incomeMortgage servicing incomeTitle Company joint ventureInvestment Advisory businessOperate a cost-effective franchiseCombined certain areas (e.g., consumer and mortgage collections)Restructured retail divisionEngaged in ongoing review of operational efficiencies Vision for the Future Assets More granular (smaller credits)More diversified (no concentrations)More commercial in nature, including small business Funding Take advantage of the Company's sweet spot: Small enough to be close to the customerLarge enough to offer a full product suite Emphasize core deposits and deep customer relationshipsGrow at a rate we can fund profitably Income Statement Culture A strong community bank culture in all markets we serveLoyal customer baseA company built on providing exceptional levels of personal serviceMore services to each customerEase of obtaining serviceLinked loan and deposit services Going Forward 17 |
| United Community Financial Corp.NASDAQ: UCFCwww.UCFCONLINE.comwww.HOMESAVINGS.comHeadquarters275 West Federal StreetYoungstown, Ohio 44503 18 Questions |
| Appendix |
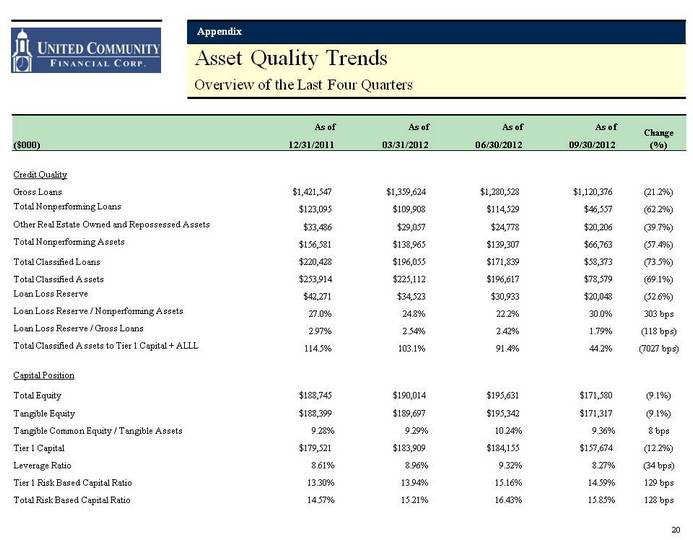
| Asset Quality Trends Overview of the Last Four Quarters 20 Appendix |
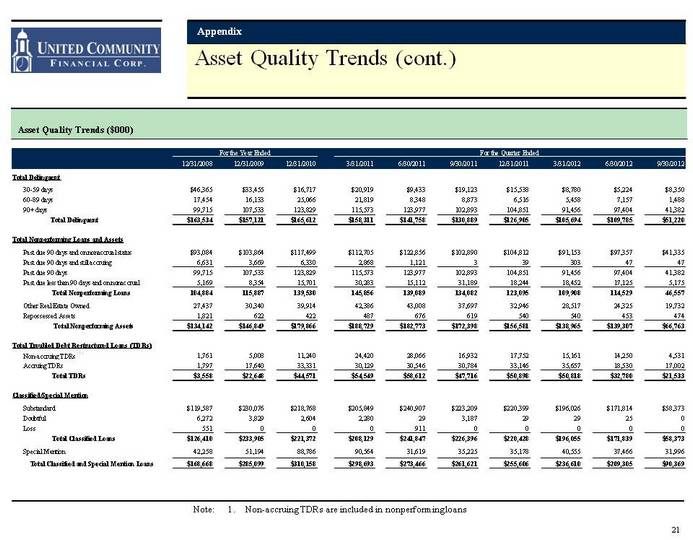
| Asset Quality Trends ($000) Asset Quality Trends (cont.) Appendix 21 Note: 1. Non-accruing TDRs are included in nonperforming loans |
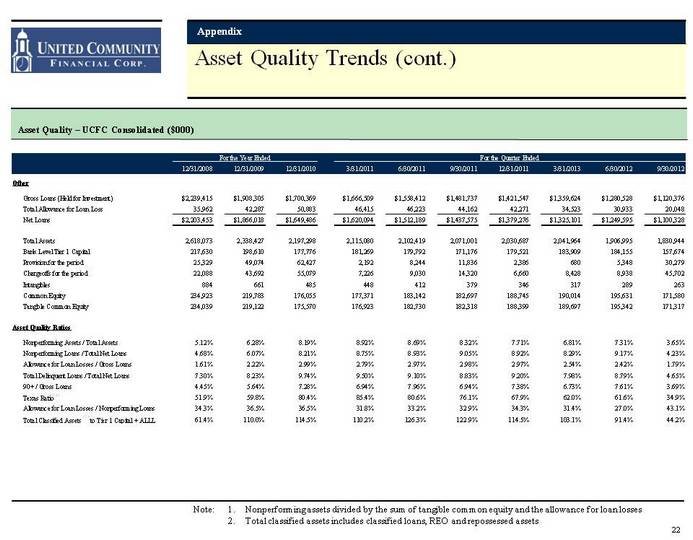
| Asset Quality Trends (cont.) Appendix Asset Quality - UCFC Consolidated ($000) 22 Note: 1. Nonperforming assets divided by the sum of tangible common equity and the allowance for loan losses 2. Total classified assets includes classified loans, REO and repossessed assets |
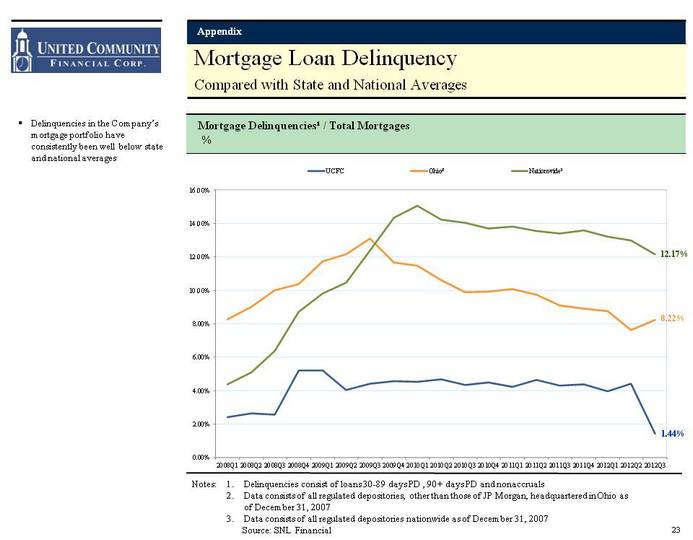
| Mortgage Loan Delinquency Compared with State and National Averages Appendix Mortgage Delinquencies1 / Total Mortgages% 23 Delinquencies in the Company's mortgage portfolio have consistently been well below state and national averages 1.44% 8.22% 12.17% Notes: 1. Delinquencies consist of loans 30-89 days PD , 90+ days PD and nonaccruals 2. Data consists of all regulated depositories, other than those of JP Morgan, headquartered in Ohio as of December 31, 2007 3. Data consists of all regulated depositories nationwide as of December 31, 2007 Source: SNL Financial |
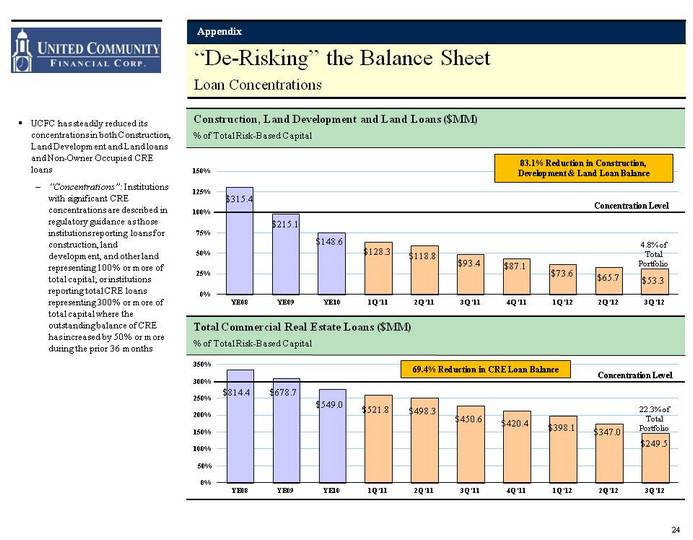
| "De-Risking" the Balance Sheet Loan Concentrations Loan Concentrations Loan Concentrations Total Commercial Real Estate Loans ($MM)% of Total Risk-Based Capital UCFC has steadily reduced its concentrations in both Construction, Land Development and Land loans and Non-Owner Occupied CRE loans"Concentrations": Institutions with significant CRE concentrations are described in regulatory guidance as those institutions reporting loans for construction, land development, and other land representing 100% or more of total capital; or institutions reporting total CRE loans representing 300% or more of total capital where the outstanding balance of CRE has increased by 50% or more during the prior 36 months(CHART) Construction, Land Development and Land Loans ($MM)% of Total Risk-Based Capital Concentration Level Concentration Level Appendix $315.4 $215.1 $148.6 $128.3 $118.8 $93.4 $814.4 $678.7 $549.0 $521.8 $498.3 $450.6 24 69.4% Reduction in CRE Loan Balance 83.1% Reduction in Construction, Development & Land Loan Balance 4.8% of Total Portfolio 22.3% of Total Portfolio $87.1 $420.4 $73.6 $398.1 $65.7 $347.0 $53.3 $249.5 |
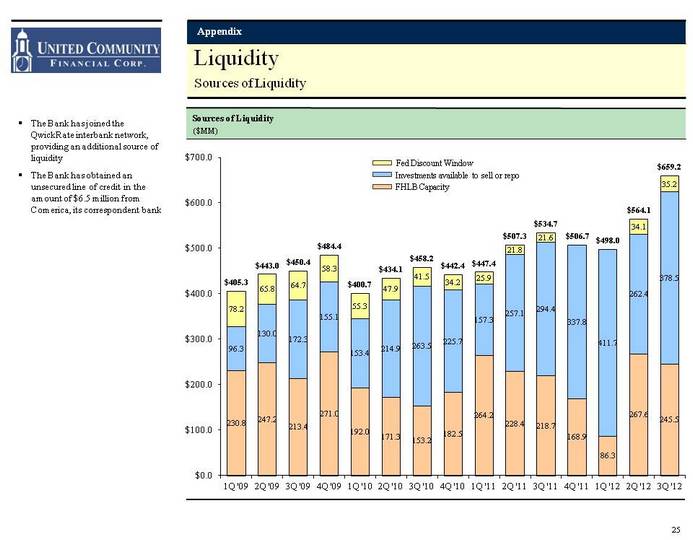
| Liquidity Sources of Liquidity Sources of Liquidity Sources of Liquidity Sources of Liquidity Fed Discount Window Investments available to sell or repo FHLB Capacity The Bank has joined the QwickRate interbank network, providing an additional source of liquidityThe Bank has obtained an unsecured line of credit in the amount of $6.5 million from Comerica, its correspondent bank Appendix 25 ($MM) |
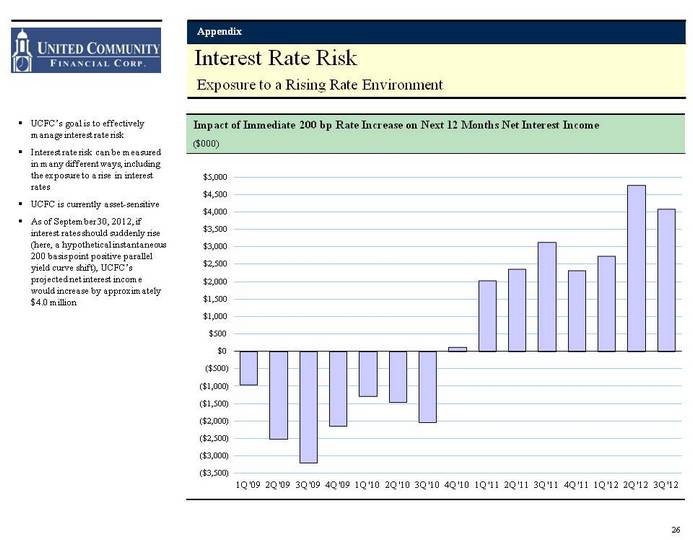
| Interest Rate Risk Exposure to a Rising Rate Environment Exposure to a Rising Rate Environment Exposure to a Rising Rate Environment Impact of Immediate 200 bp Rate Increase on Next 12 Months Net Interest Income UCFC's goal is to effectively manage interest rate riskInterest rate risk can be measured in many different ways, including the exposure to a rise in interest rates UCFC is currently asset-sensitiveAs of September 30, 2012, if interest rates should suddenly rise (here, a hypothetical instantaneous 200 basis point positive parallel yield curve shift), UCFC's projected net interest income would increase by approximately $4.0 million Appendix 26 ($000) |
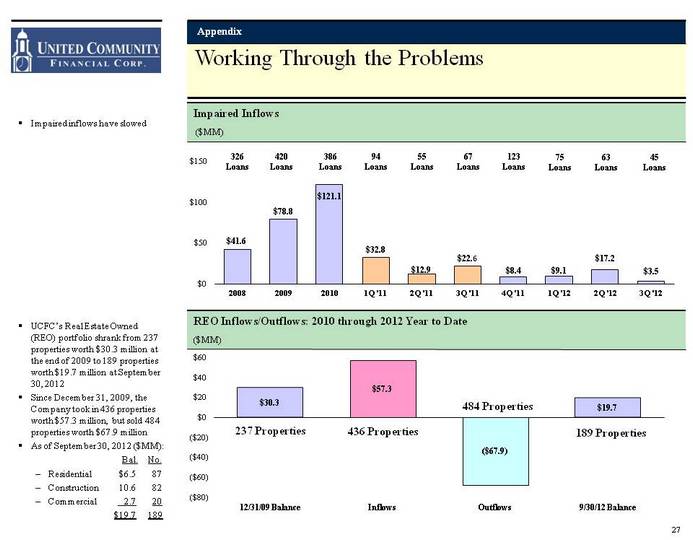
| Working Through the Problems REO Inflows/Outflows: 2010 through 2012 Year to Date ($MM) UCFC's Real Estate Owned (REO) portfolio shrank from 237 properties worth $30.3 million at the end of 2009 to 189 properties worth $19.7 million at September 30, 2012Since December 31, 2009, the Company took in 436 properties worth $57.3 million, but sold 484 properties worth $67.9 millionAs of September 30, 2012 ($MM): Bal. No.Residential $6.5 87Construction 10.6 82Commercial 2.7 20 $19.7 189 Appendix Impaired Inflows ($MM) (CHART) Impaired inflows have slowed 27 326Loans 420Loans 386Loans 94Loans 55Loans 67Loans 484 Properties 436 Properties 189 Properties 237 Properties 123Loans 75Loans 63Loans 45Loans |