Attached files
| file | filename |
|---|---|
| 8-K - FORM 8-K - Nielsen CO B.V. | d456510d8k.htm |
| EX-2.1 - AGREEMENT AND PLAN OF MERGER - Nielsen CO B.V. | d456510dex21.htm |
| EX-99.1 - JOINT PRESS RELEASE ISSUED BY ARBITRON INC. AND NIELSEN HOLDINGS N.V. - Nielsen CO B.V. | d456510dex991.htm |
 Nielsen Announces Agreement to Acquire Arbitron
December 18, 2012
Measuring More Media Together
Exhibit 99.2 |
 Copyright ©
2012 Nielsen Holdings N.V.
Nielsen and Arbitron Conference Call
December 18, 2012 2
Forward Looking Statements and Other Information
This written communication includes information that could constitute forward-looking statements
made pursuant to the safe harbor provision of the Private Securities Litigation Reform Act of
1995. These statements may be identified by words such as “will”, “expect”,
“should”, “could”, “shall” and similar expressions. These statements are subject to risks and uncertainties concerning
Nielsen's proposed acquisition of Arbitron, Arbitron's expected financial performance, as well as
Arbitron's strategic and operational plans and actual results and events could differ
materially from what presently is expected. The potential risks and uncertainties include
the possibility that the transaction will not close or that the closing may be delayed; the possibility that Arbitron may be unable
to obtain stockholder approval as required for the transaction or that the other conditions to the
closing of the transaction may not be satisfied; the transaction may involve unexpected costs,
liabilities or delays; the outcome of any legal proceedings related to the transaction; the
occurrence of any event, change or other circumstances that could give rise to the termination of the transaction
agreement; general economic conditions; conditions in the markets Nielsen and Arbitron are engaged in;
behavior of customers, suppliers and competitors (including their reaction to the transaction);
technological developments; as well as legal and regulatory rules affecting Nielsen’s and
Arbitron’s business and specific risk factors discussed in other releases and public filings made by
Nielsen and Arbitron (including the their respective filings with the Securities and Exchange
Commission (the “SEC”)). This list of factors is not intended to be
exhaustive. Such forward-looking statements only speak as of the date of this written communication,
and we assume no obligation to update any written or oral forward-looking statement made by us or
on our behalf as a result of new information, future events, or other factors.
Forward
Looking
Statements:
Additional
Information
and
Where
to
Find
It:
Arbitron and its directors and executive officers and other members of management and employees are
potential participants in the solicitation of proxies from Arbitron’s stockholders in
respect of the proposed transaction. Information regarding Arbitron’s directors and executive officers is available in Arbitron’s
proxy statement for its 2012 annual meeting of stockholders, filed with the SEC on April 12,
2012. Additional information regarding the interests of such potential participants in
the proposed transaction will be included in the proxy statement to be filed with the SEC in
connection with the proposed transaction.
In
connection
with
the
proposed
acquisition
by
Nielsen
of
Arbitron
pursuant
to
the
terms
of
an
Agreement
and
Plan
of
Merger
by
and
among
Arbitron,
Nielsen,
and
a
wholly-owned
subsidiary
of
Nielsen,
Arbitron
will
file
a
proxy
statement
with
the SEC. Investors are urged to read the proxy statement (including all amendments and supplements
to it) because it will contain
important
information.
Investors
may
obtain
free
copies
of
the
proxy
statement
when
it
becomes
available,
as
well
as other
filings containing information about Arbitron, without charge, at the SEC’s Internet site
(www.sec.gov). These documents may also
be
obtained
for
free
from
Arbitron’s
Investor
Relations
web
site
(http://www.Arbitron.com/investors)
or
by
directing
a
request
to
Arbitron
at:
Arbitron,
9705
Patuxent
Woods
Drive,
Columbia,
Maryland
21046. |
 Copyright ©
2012 Nielsen Holdings N.V.
Nielsen and Arbitron Conference Call
December 18, 2012 3
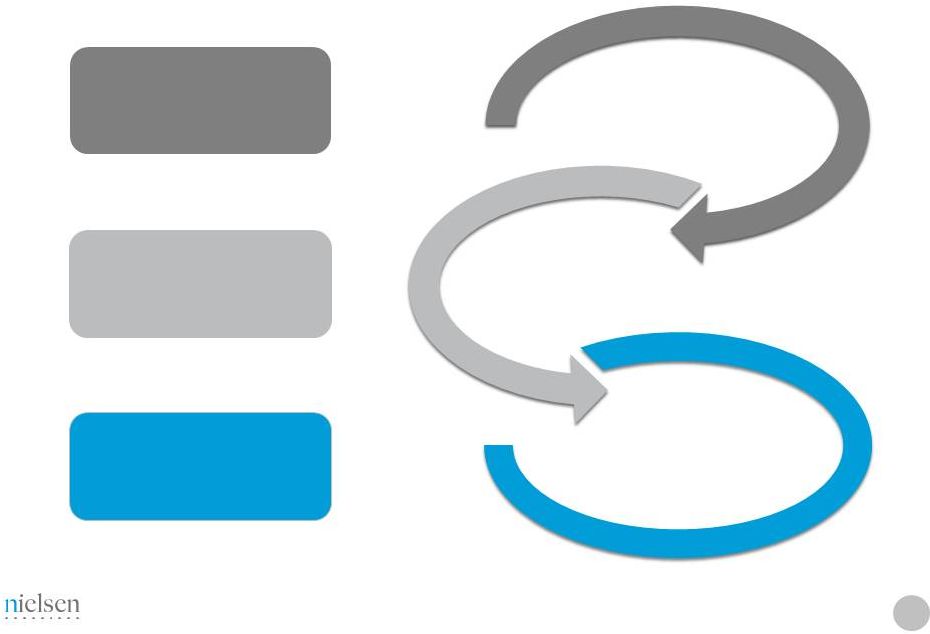
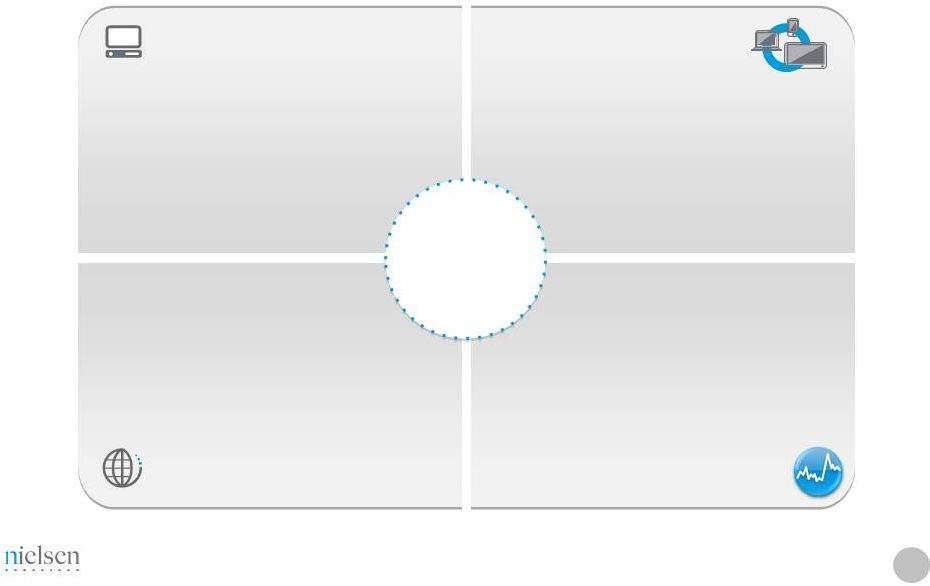
Nielsen Strategy
WATCH
BUY
BUY + WATCH
Measure more ways
that consumers spend
time with media
Expand coverage of
consumer purchase
behavior globally
Understand how media
consumption relates to
purchase behavior |
 Copyright ©
2012 Nielsen Holdings N.V.
Nielsen and Arbitron Conference Call
December 18, 2012 4
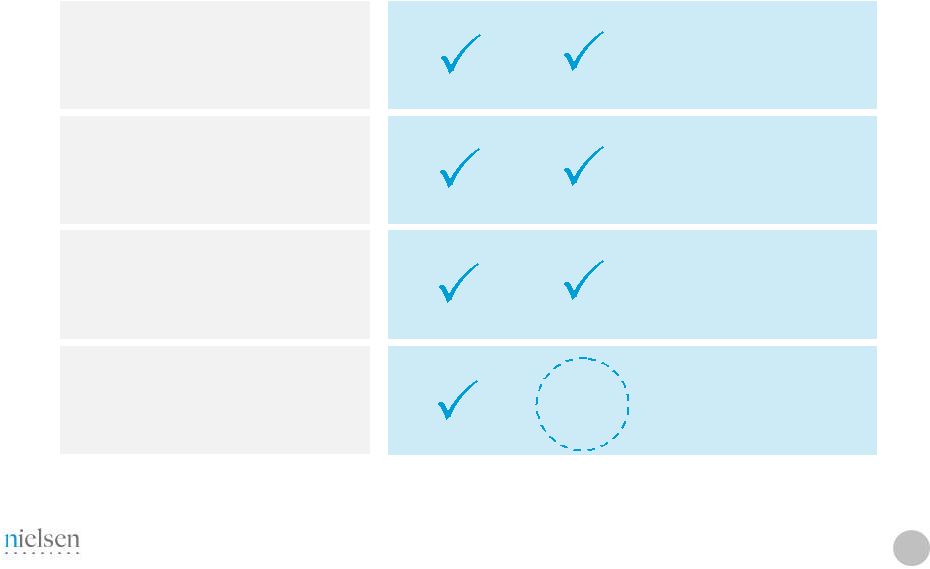
Different markets and distinct capabilities
supporting syndicated measurement
Complementary
Assets and Scale
Provides local clients linkage to retail and
purchasing impact to improve ROI
Addresses unmeasured areas: streaming
audio, out-of-home, multicultural audiences
Advertising
Effectiveness
Digital and
Representative
Measurement
Expands global measurement of consumer
behavior
Broader
Platform
Long-term opportunity to measure listening
audiences in non-U.S. markets
Global
Expansion
Transaction Rationale |
 Copyright ©
2012 Nielsen Holdings N.V.
Nielsen and Arbitron Conference Call
December 18, 2012 5
Expanded Measurement of Global Consumers
Broader
Measurement
Platform
TV/Video
Digital/Social
Radio/Music
What
consumers
watch
Retail
E-commerce
What
consumers
buy
(1)
Nielsen
Cross-Platform
Report:
Based
on
Total
US
Population,
Persons
2+
for
TV
and
Online,
(Home
and
Work)
13+
for
Mobile;
2 Qtr
2012;
Arbitron
Radio
Today,
2012
Measuring More Media
Consumption
TV
Radio
Total
Average Time Spent per Person per Day
1
~5 hrs
7 hrs
~2 hrs
nd |
 Copyright ©
2012 Nielsen Holdings N.V.
Nielsen and Arbitron Conference Call
December 18, 2012 6
Complementary Businesses with Great Histories
and Future Opportunities
Nielsen
•
Global leader in measurement and analytics
for what consumers buy and watch
•
Founded by Arthur C. Nielsen Sr. in 1923
•
Retail sales and market share in 100+
countries; TV, digital audience and
cross-platform measurement
•
Advertising effectiveness solutions for
TV/video/digital/social
Arbitron
•
Leader in measurement of listening
audiences at home, at work, out of home
•
Founded by Jim Seiler in 1949
•
Local radio ratings, network and national
radio audience measurement plus
consumer information and software services
•
Innovator in measurement technologies |
 Copyright ©
2012 Nielsen Holdings N.V.
Nielsen and Arbitron Conference Call
December 18, 2012 7
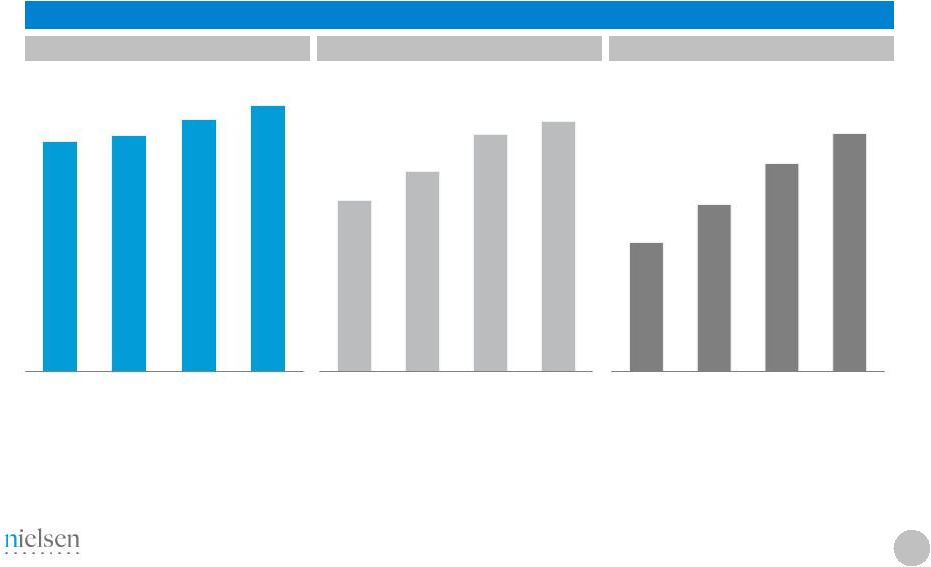
Arbitron Financial Summary
Financial summary ($millions)
Cash Flow
(1)
As reported in Arbitron Inc. public filings
(2)
Defined as EBITDA less Capex
Revenue
Revenue Growth
High Margin
Strong Cash Flow
$385
$395
$422
$445
2009
2010
2011
LTM 9/30/12
$86
$100
$119
$126
2009
2010
2011
LTM 9/30/12
$54
$70
$87
$100
2009
2010
2011
LTM 9/30/12
EBITDA
1
1
2 |
 Copyright ©
2012 Nielsen Holdings N.V.
Nielsen and Arbitron Conference Call
December 18, 2012 8
Robust and scalable integrated
technology platform
Strong cash flow enables
investments for growth
Measuring more media
consumption
More ways to understand and
monetize audiences
•
Streaming audio
•
Out-of-home
•
Deeper measurement of
U.S. multicultural audiences
Complementary products,
cultures and market fit
Bridging different markets
Expertise in providing clients with
consumer measurement and insights
Global footprint
Links media consumption to retail
and purchasing impact ROI
Enables broader music industry
insights
Benefits of scale
Improving local
advertising effectiveness
Transaction Benefits Both Radio and TV Clients
and Their Respective Advertisers
Client
Benefits |
 Copyright ©
2012 Nielsen Holdings N.V.
Nielsen and Arbitron Conference Call
December 18, 2012 9
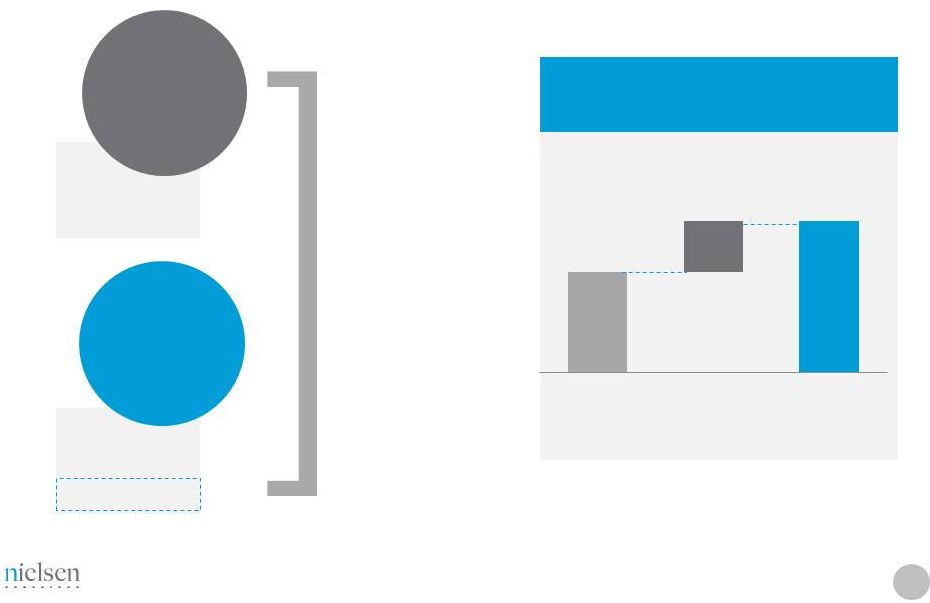
Complementary Business Fundamentals
Embedded in daily
client operations
Mission-critical
measurement
and analytics
Enabling
client growth
Unique consumer
information and insights
Industry-strength,
scalable solutions
Syndicated services
Opportunity for
global growth
Global footprint
Nielsen
Arbitron |
 Copyright ©
2012 Nielsen Holdings N.V.
Nielsen and Arbitron Conference Call
December 18, 2012 10
Transaction Highlights
Purchase
Price
$48 per share: $1.3 billion equity value
26% premium to 12/17/12 close
Consideration
100% cash consideration with committed financing
Pro Forma
Financials
1
Pro Forma Revenue: $6.0 billion
Pro Forma Adj. EBITDA: $1.7 billion
EPS Impact
2
Expect $0.13 accretive impact to Adj. EPS 12 months after
close, $0.19 accretive impact to Adj. EPS 24 months after close
Synergies
Expected annualized savings of at least $20MM
Transaction
Close
Transaction close subject to customary closing conditions and
regulatory review
(1)
Pro forma is sum of Nielsen and Arbitron financials for last twelve months as of 9/30/12, adjusted
for joint venture consolidation. Pro forma figures exclude transaction costs, estimates for
purchase accounting adjustments and synergy benefits. See Appendix for reconciliation to GAAP financial measures
(2)
Excludes transaction costs and estimates for purchase accounting adjustments
|
 Copyright ©
2012 Nielsen Holdings N.V.
Nielsen and Arbitron Conference Call
December 18, 2012 11
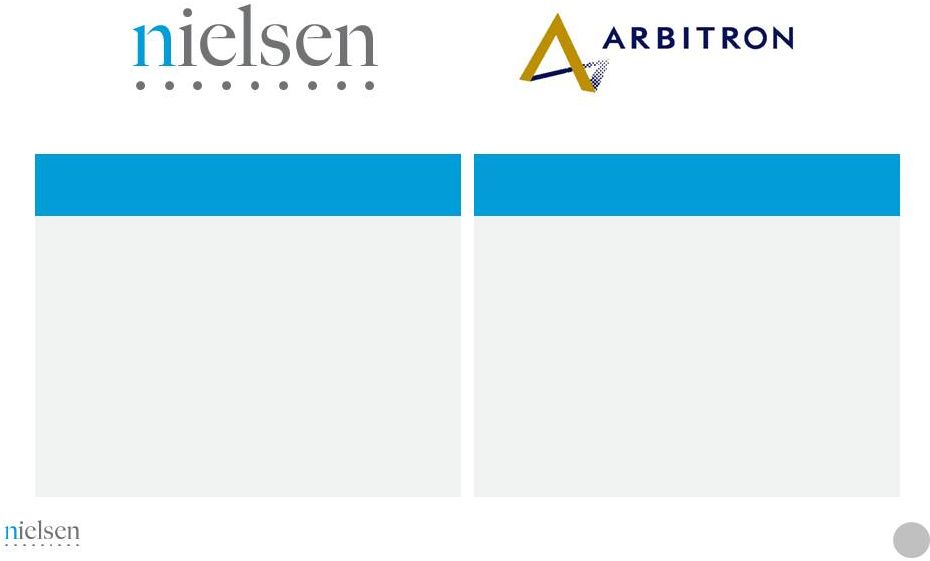
Similar Financial Models
Mid-single digit
compounding growth
Consistent growth
Majority of revenues
under contract
Recurring revenue
Syndicated volume
drives margin expansion
Operating leverage
Scale benefits with
low capital intensity
Strong free cash flow
conversion
Nielsen
Arbitron |
 Copyright ©
2012 Nielsen Holdings N.V.
Nielsen and Arbitron Conference Call
December 18, 2012 12
Pro Forma
1
Financials for Last Twelve Months
ended 9/30/12
($ millions)
LTM Revenue
LTM
Adj.
EBITDA
NLSN
ARB
Pro Forma
LTM Cash Flow
(EBITDA –
CAPEX)
Growth
Rate
NLSN
ARB
(1)
Pro forma is sum of Nielsen and Arbitron financials for last twelve months as of
9/30/12, adjusted for pro forma impact of interest, tax and joint venture
consolidation. Pro forma figures exclude transaction costs, estimates for purchase
accounting adjustments and synergy benefits (2)
See Appendix for reconciliation to GAAP financial measures
(3)
Based on constant currency growth
6.7%
4.2%
7.7%
4.5%
6.4%
9.2%
$5,569
$445
$6,043
$1,577
$131
$1,723
Pro Forma
NLSN
ARB
$1,198
$105
$1,318
Pro Forma
2.8%
16.7%
3.9%
2
3 |
 Copyright ©
2012 Nielsen Holdings N.V.
Nielsen and Arbitron Conference Call
December 18, 2012 13
Financial Impact for Nielsen
Key Considerations
•
Modest increase to leverage
•
Accretive to Adj. EPS
1
$0.13
to
Adj.
EPS
in
12
months
$0.19
to
Adj.
EPS
in
24
months
•
Financing commitment supports
$1.3B purchase amount
•
Enhances plan for future return
of capital strategy
(1)
Pro forma figures exclude transaction costs and estimates for purchase accounting
adjustments See Appendix for reconciliation to GAAP financial measures
|
 Copyright ©
2012 Nielsen Holdings N.V.
Nielsen and Arbitron Conference Call
December 18, 2012 14
Transaction Advances Our Long-Term Objectives
Robust platforms supporting global solutions
Global scale
Enable greater marketing efficiency
Broader measurement of rapidly changing
consumer behavior
Advertising
ROI
Expanding
coverage |
 15
Q&A |
 Copyright ©
2012 Nielsen Holdings N.V.
Nielsen and Arbitron Conference Call
December 18, 2012 Appendix |
 Copyright ©
2012 Nielsen Holdings N.V.
Nielsen and Arbitron Conference Call
December 18, 2012 17
2011 Financials
1
ADJ. EBITDA
$1,546 MM
ADJ. EPS
$1.61
YTD 9/30/12
revenue growth
2
4.1%
Snapshot of Nielsen’s Business
Value proposition
Providing
independent third-party measurement and market share to consumer packaged
goods and media industries globally
Delivering
critical
media
and
marketing
information,
analytics
and
industry
expertise
about
what
consumers watch and what consumers buy on a global and local basis
Clients
Consumer packaged goods manufacturers and
retailers, media content providers and
distributors, digital players and online publishers,
ad agencies
Key Facts
Clients and operations in 100 countries
~70% of business in long-term contracts
CAGR
2
(‘09-’11) 5.8%
REVENUE
$5,532 MM
$4,808
$5,126
$5,532
$5,569
($ millions)
(1)
See Nielsen reconciliation to GAAP financial
measures (2)
Based on constant currency growth
9/30/12
2009
2010
2011
LTM |
 Copyright ©
2012 Nielsen Holdings N.V.
Nielsen and Arbitron Conference Call
December 18, 2012 18
2011 Financials
1
Snapshot of Arbitron’s Business
Clients
Media, mobile, advertising agencies and
advertisers
Key Facts
Primarily U.S.-based business
77% revenues from local ratings services
EBITDA
$119 MM
EPS
$1.93
YTD 9/30/12
revenue growth
7.6%
CAGR
(‘09-’11) 4.7%
Value proposition
Serving
the
media—primarily
radio
Measuring
network
and
local
market
radio
audiences
in
U.S.;
retail,
media
and
product
patterns
of U.S. consumers; mobile audience measurement and analytics; software
services REVENUE
$422 MM
($ millions)
(1)
As reported in Arbitron Inc. public filings
$385
$395
$422
$445
9/30/12 |
| Copyright ©
2012 Nielsen Holdings N.V.
Nielsen and Arbitron Conference Call
December 18, 2012 19
Certain Non-GAAP measures
Overview of Non-GAAP Presentations
Nielsen consistently uses the below non-GAAP financial measures to evaluate the
results of our operations. We believe that the presentation of these
non-GAAP measures provides useful information to investors regarding
financial and business trends related to our results of operations and that when
this non-GAAP financial information is viewed with our GAAP financial
information, investors are provided with a more meaningful understanding of our
ongoing operating performance. None of the non-GAAP measures presented should
be considered as an alternative to net income or loss, operating income or
loss, cash flows from operating activities or any other performance measures
of operating performance or liquidity derived in accordance with GAAP. These non-GAAP
measures have important limitations as analytical tools and should not be
considered in isolation or as substitutes for an analysis of our results as
reported under GAAP. Constant Currency Presentation
We
evaluate
our
results
of
operations
on
both
an
as
reported
and
a
constant
currency
basis.
The
constant
currency
presentation, which is a non-GAAP measure, excludes the impact of fluctuations
in foreign currency exchange rates. We believe providing constant currency
information provides valuable supplemental information regarding our results
of operations, consistent with how we evaluate our performance. We calculate constant currency
percentages
by
converting
our
prior-period
local
currency
financial
results
using
the
current
period
exchange
rates
and comparing these adjusted amounts to our current period reported results.
Net Debt and Net Debt Leverage Ratio
The net debt leverage ratio is defined as net debt as of the balance sheet date
divided by Adjusted EBITDA for the twelve months then ended. Net debt and
the net debt leverage ratio are not presentations made in accordance with
GAAP, and our use of these terms may vary from the use of similarly-titled
measures by others in our industry due to the potential inconsistencies in
the method of calculation and differences due to items subject to interpretation. |
| Copyright ©
2012 Nielsen Holdings N.V.
Nielsen and Arbitron Conference Call
December 18, 2012 20
Certain Non-GAAP measures (cont’d)
Adjusted EBITDA
We define Adjusted EBITDA as net income or loss from our consolidated statements of
operations before interest income and
expense,
income
taxes,
depreciation
and
amortization,
restructuring
charges,
goodwill
and
intangible
asset
impairment charges, stock compensation expense and other non-operating items
from our consolidated statements of operations as well as certain other
items considered unusual or non-recurring in nature. Adjusted EBITDA is not a
presentation made in accordance with GAAP, and our use of the term Adjusted EBITDA
may vary from the use of similarly-titled measures by others in our
industry due to the potential inconsistencies in the method of calculation and
differences due to items subject to interpretation. We use Adjusted EBITDA to
consistently measure our performance from period to period both at the
consolidated level as well as within our operating segments, to evaluate and fund
incentive compensation programs and to compare our results to those of our
competitors. Adjusted Net Income
We define Adjusted Net Income as net income or loss from our consolidated
statements of operations before income taxes, depreciation and amortization
associated with acquired tangible and intangible assets, restructuring charges,
goodwill and intangible asset impairment charges, other non-operating items
from our consolidated statements of operations and certain other items
considered unusual or non-recurring in nature, reduced by cash paid for income
taxes. Also excluded from Adjusted Net Income is interest expense attributable to
the mandatory convertible subordinated bonds due 2013. We also describe
Adjusted Net Income per share as Adjusted EPS. Last Twelve Months
LTM refers to the last twelve months in the period ended September 30, 2012. For
example, Nielsen LTM ended September 30, 2012 revenue represents $5,532 for
the year ended December 31, 2011, less $4,111 for the nine months ended
September 30, 2011 plus $4,148 for the nine months ended September 30, 2012. All other financial information
presented for the LTM ended September 30, 2012 follows the same approach.
|
 Copyright ©
2012 Nielsen Holdings N.V.
Nielsen and Arbitron Conference Call
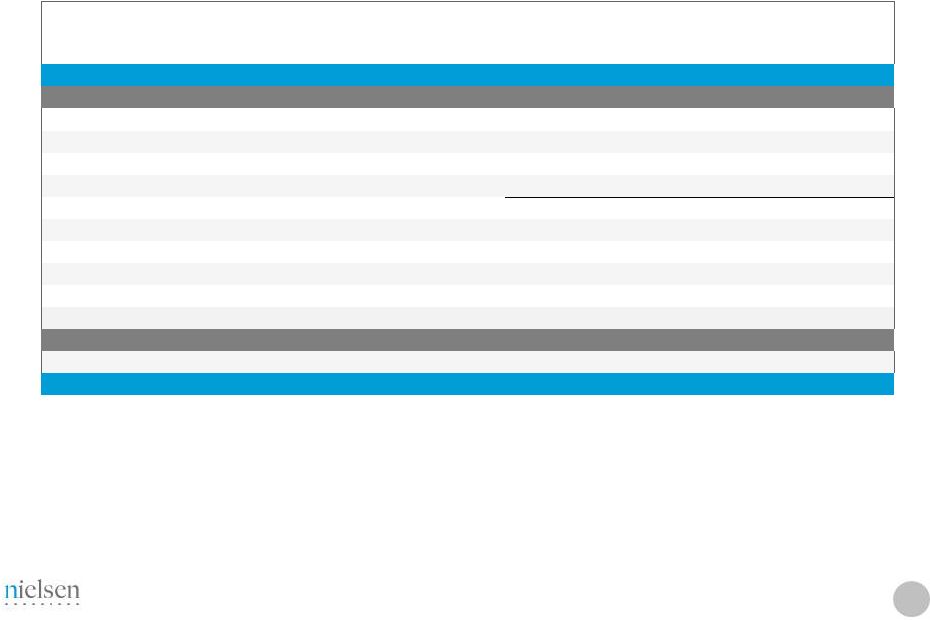
December 18, 2012 Pro Forma Reconciliation for LTM 9/30/12
Last Twelve Months ended 9/30/12
NLSN
ARB
Eliminations/
Adjustments
(a)
Total
Revenue
$ 5,569
$ 445
$ 29
$ 6,043
Net income / (loss)
$ 329
$ 58
$ (41)
$ 346
Income from discontinued operations, net
(2)
--
--
(2)
Interest expense, net
424
1
69
494
Provision / (Benefit) for income taxes
187
36
(28)
195
Depreciation and amortization
521
31
--
552
EBITDA
1,459
126
--
1,585
Equity in net (income) / loss of affiliates
(5)
(7)
15
3
Other non-operating (income) / expense, net
(1)
3
--
2
Restructuring charges
85
--
--
85
Stock-based compensation expense
33
9
--
42
Other items
(b)
6
--
--
6
Adjusted EBITDA
$ 1,577
$ 131
$ 15
$ 1,723
Capital Expenditures
(379)
(26)
--
(405)
Cash flow (EBITDA –
Capex)
$ 1,198
$ 105
$ 15
$ 1,318
($ in millions)
(a)
Eliminations
and
adjustments
made
to
reflect
pro
forma
interest,
tax
and
joint
venture
consolidation
impact
(b)
Other items for Nielsen primarily consist of deal related fees.
21 |
 Copyright ©
2012 Nielsen Holdings N.V.
Nielsen and Arbitron Conference Call
December 18, 2012 Nielsen Reconciliation to GAAP Financial Measures
(a) (b) (c) See footnotes on next page
Year ended
December 31
(Unaudited)
2011
Net income
$ 86
Income from discontinued operations, net
(1)
Interest expense, net
471
Provision for income taxes
22
Depreciation and amortization
529
EBITDA
1,107
Equity in net income of affiliates
(3)
Other
non-operating
expense,
net
(a)
219
Restructuring charges
84
Stock-based compensation expense
27
Other items
(b)
112
Adjusted EBITDA
$ 1,546
Interest expense, net
(471)
Depreciation and amortization
(529)
Depreciation and amortization of acquisition-related tangible and intangible
assets 182
Cash paid for income taxes
(132)
Stock-based compensation expense
(27)
Interest expense attributable to mandatory convertible bonds
21
Adjusted net income
$ 590
Adjusted
net
income
per
share
of
common
stock,
diluted
(c)
$1.61
($ in millions except per share amounts)
22 |
 Copyright ©
2012 Nielsen Holdings N.V.
Nielsen and Arbitron Conference Call
December 18, 2012 Nielsen Reconciliation to GAAP Financial Measures
cont’d
(a)
Non-operating expense for twelve months ended December 31, 2011 reflects debt
extinguishment/pre-payment charges of $231M.
(b)
Other items primarily consist of Sponsor Advisory Fees (including termination
payments of $102 million for the full year ended December 31, 2011), costs
related to our initial public offering and other deal related fees. (c)
Adjusted Net Income per share of common stock presented on a diluted basis
includes potential common shares associated with stock-based
compensation plans that may have been considered anti-dilutive in accordance with
GAAP. The amount also includes the weighted-average amount of shares of common
stock convertible associated with the mandatory convertible bonds based
upon the average price of our common stock during the period.
Weighted-average shares of common stock outstanding as of
year end December 31, 2011, basic
352,469,181
Dilutive shares of common stock from
stock compensation plans
5,032,773
Shares of common stock convertible associated
with the mandatory convertible bonds
9,531,994
Weighted-average shares of common stock outstanding,
diluted
367,033,948
23 |
 web
http://ir.nielsen.com
email
ir@nielsen.com
phone
+1.646.654.4602
@NielsenIR |