Attached files
| file | filename |
|---|---|
| 8-K - FORM 8-K - Unum Group | d456403d8k.htm |
 2013 Outlook Meeting
December 17, 2012
Exhibit 99.1 |
 2
Safe Harbor Statement
Certain
information
in
this
presentation
constitutes
"forward-looking
statements"
within
the
meaning
of
the
Private
Securities
Litigation
Reform Act of 1995. Forward-looking statements are those not based on historical
information, but rather relate to future operations, strategies, financial results, or
other developments and speak only as of the date made. These forward-looking statements are subject to
numerous assumptions, risks, and uncertainties, many of which are beyond our control.
The following factors, in addition to other factors mentioned from time to time, may
cause actual results to differ materially from those contemplated by the forward-looking statements: (1)
unfavorable economic or business conditions, both domestic and foreign; (2) legislative,
regulatory, or tax changes, both domestic and foreign, including the effect of
potential legislation and increased regulation in the current political environment; (3) sustained periods of low
interest rates; (4) changes in claim incidence, recovery rates, mortality rates, and offsets
due to, among other factors, the rate of unemployment and consumer confidence, the
emergence of new diseases, epidemics, or pandemics, new trends and developments in
medical treatments, the effectiveness of claims management operations, and changes in
government programs; (5) fluctuation in insurance reserve liabilities; (6) investment
results, including, but not limited to, realized investment losses resulting from defaults, contractual terms
of
derivative
contracts,
and
impairments
that
differ
from
our
assumptions
and
historical
experience;
(7)
the
lack
of
appropriate
investments
in the market which can be acquired to match our liability cash flows and duration; (8)
changes in interest rates, credit spreads, and securities prices; (9) increased
competition from other insurers and financial services companies due to industry
consolidation or other factors; (10) changes in demand for our products due to, among
other factors, changes in societal attitudes, the rate of unemployment, and consumer
confidence; (11) changes in accounting standards, practices, or policies; (12) changes in our financial strength and credit ratings;
(13) rating agency actions, state insurance department market conduct examinations and other
inquiries, other governmental investigations and
actions,
and
negative
media
attention;
(14)
effectiveness
in
managing
our
operating
risks
and
the
implementation
of
operational
improvements and strategic growth initiatives; (15) actual experience that deviates from our
assumptions used in pricing, underwriting, and reserving; (16) actual persistency
and/or sales growth that is higher or lower than projected; (17) effectiveness of our risk management
program; (18) the level and results of litigation; (19) currency
exchange rates; (20) ability of our subsidiaries to pay dividends as a result of
regulatory restrictions or changes in reserving or capital requirements; (21) ability and
willingness of reinsurers to meet their obligations; (22)
changes
in
assumptions
related
to
intangible
assets
such
as
deferred
acquisition
costs,
value
of
business
acquired,
and
goodwill;
(23)
ability to recover our systems and information in the event of a
disaster or unanticipated event and to protect our systems and information
from
unauthorized
access
and
deliberate
attacks;
and
(24)
events
or
consequences
relating
to
political
instability,
terrorism,
or
acts
of
war,
both domestic and foreign. For further information about risks and uncertainties which
could cause actual results to differ from those contained in the forward-looking
statements, see Part I, Item 1A of our annual report on Form 10-K for the year ended December 31, 2011
and
our
subsequently
filed
Forms
10-Q.
The
forward-looking
statements
in
this
presentation
are
being
made
as
of
the
date
of
this
presentation,
and
the
Company
expressly
disclaims
any
obligation
to
update
or
revise
any
forward-looking
statement
contained
herein,
even
if made available on our website or otherwise. |
 3
Today’s Participants
Kevin McCarthy
Executive Vice President and Chief Operating Officer
President and Chief Executive Officer
Executive Vice President and Chief Financial Officer
Tom Watjen
Rick McKenney |
 4
A Look at Our Performance
2012 Assessment
2013 Outlook
Closing Comments / Question & Answer
Agenda |
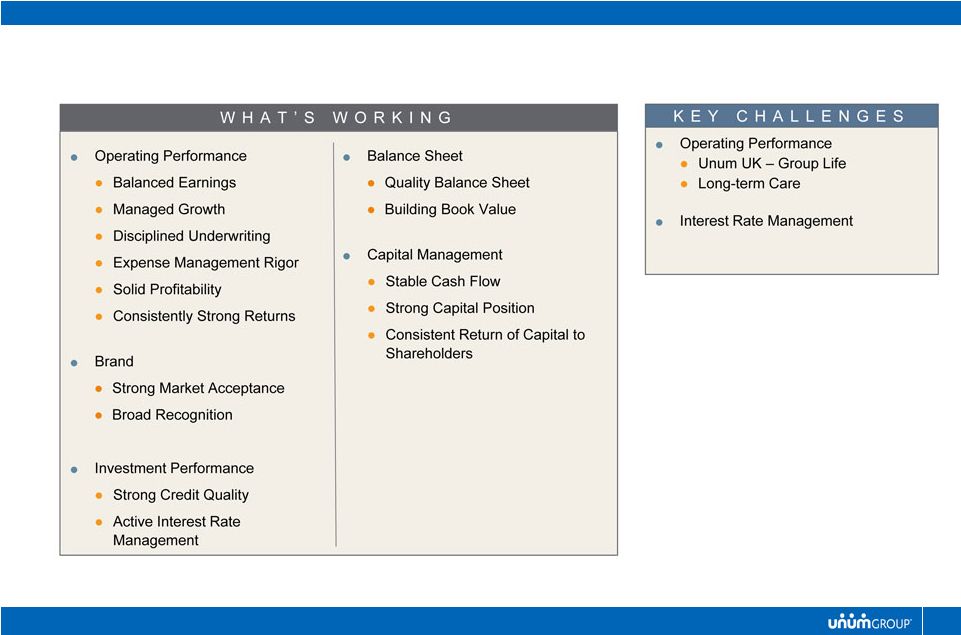
 What’s Working |
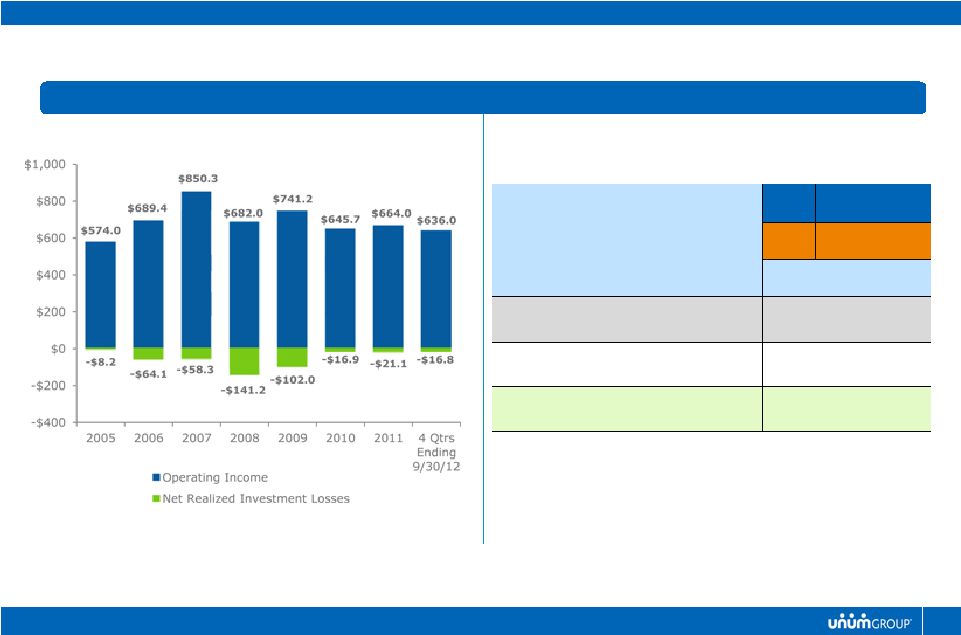
 6
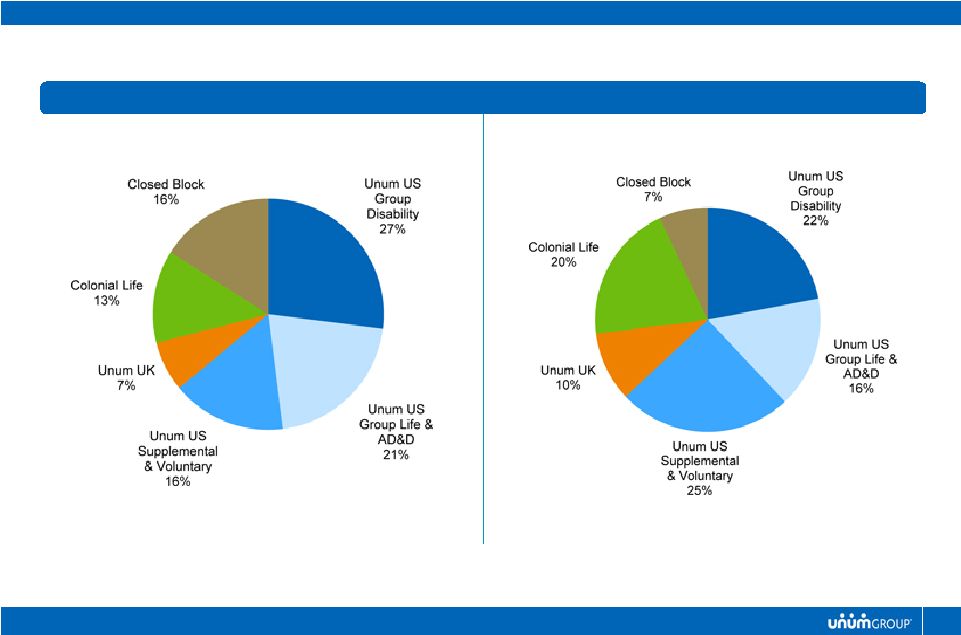
Full Year 2002
Before-tax Operating Earnings by Segment*
Operating Performance
BALANCED EARNINGS
*
Excludes Corporate Segment
9M2012
Does not reflect the impact of ASU 2010-26 or the segment reporting changes
implemented in 4Q2008 |
 7
Market Segmentation
Growth Trends in Premium Income
Operating Performance
MANAGED GROWTH IN OUR CORE BUSINESS SEGMENTS
2.6%
5.0%
($ millions)
Growth Markets
Unum US –
Core Market –
Employee Benefits
Colonial Life
Unum US –
Voluntary Benefits
Unum UK –
Group LTD
Opportunistic Markets
Unum US –
Large Case –
Employee Benefits
Unum US –
ID –
Recently Issued
Unum UK –
Group Life |
 8
Growth Trends in Premium Income
Operating Performance
MANAGED GROWTH IN OUR CORE BUSINESS SEGMENTS
Data –
Trailing 4 quarters |
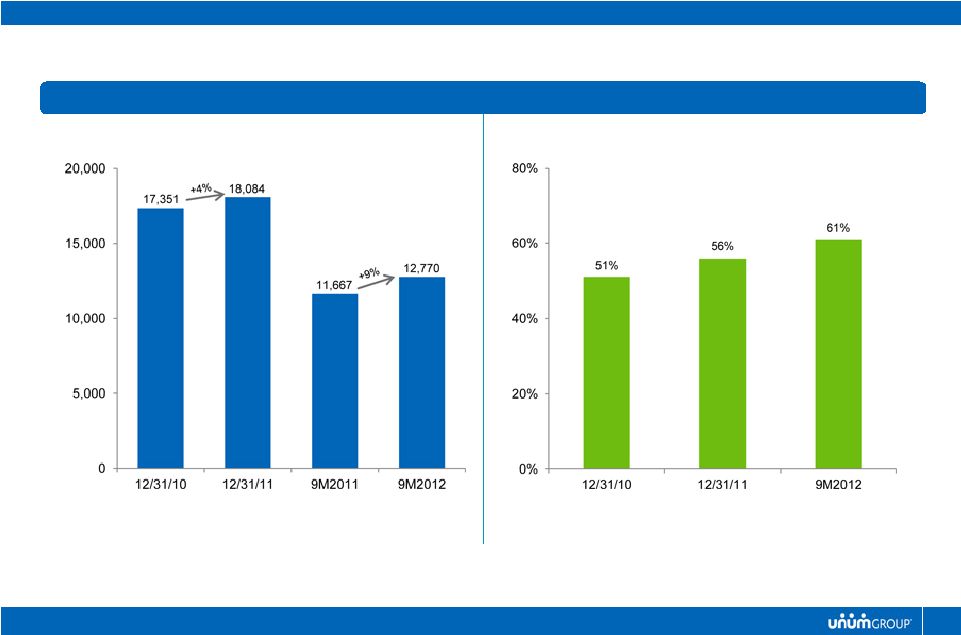 9
New Account Growth
% of Sales from Existing Relationships
Operating Performance
MANAGED GROWTH IN OUR CORE BUSINESS SEGMENTS |
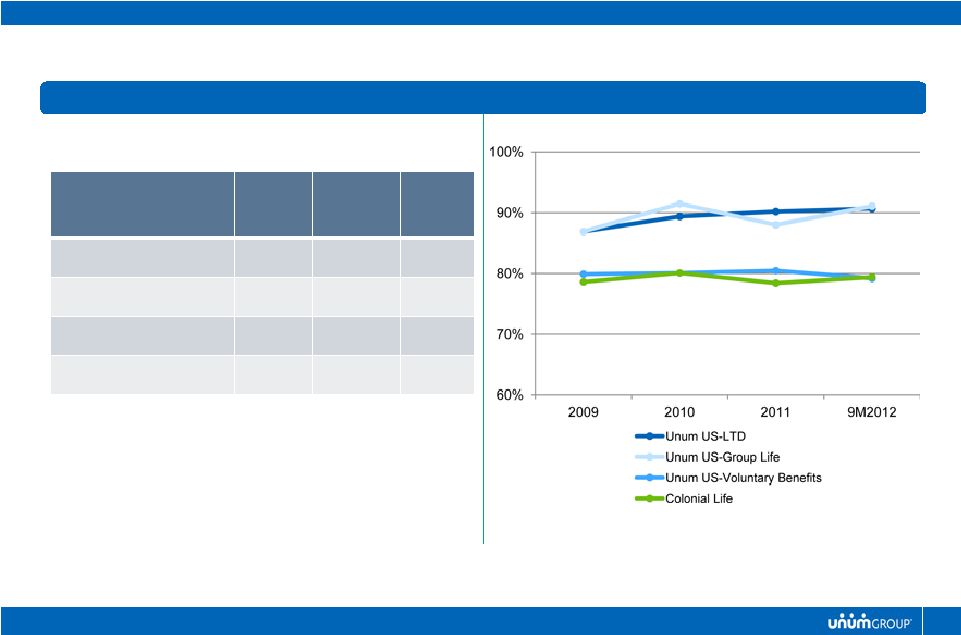
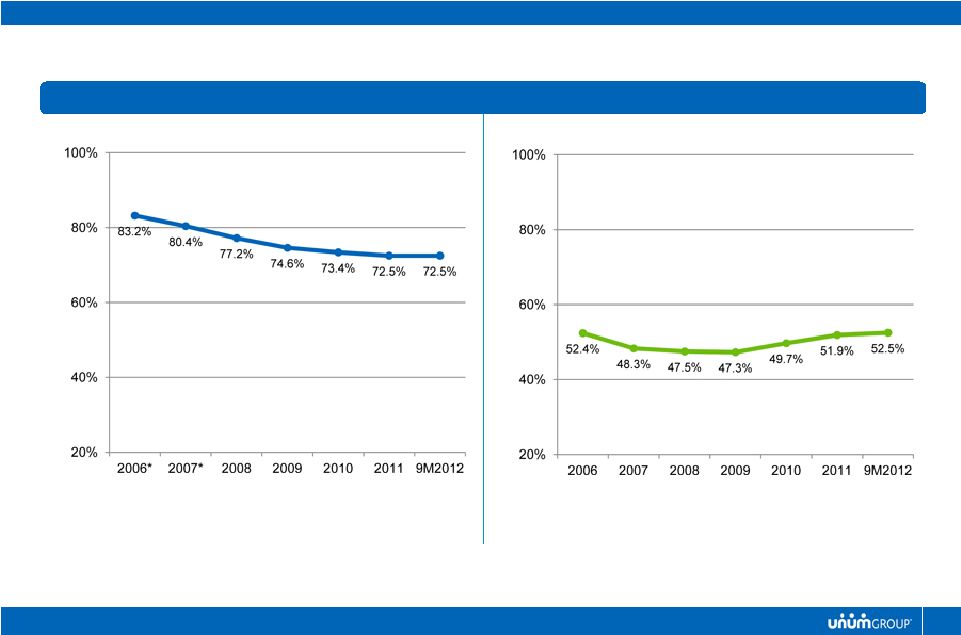 10
Colonial Life
Unum US
Benefit Ratios
Operating Performance
DISCIPLINED UNDERWRITING
*
Excludes special items |
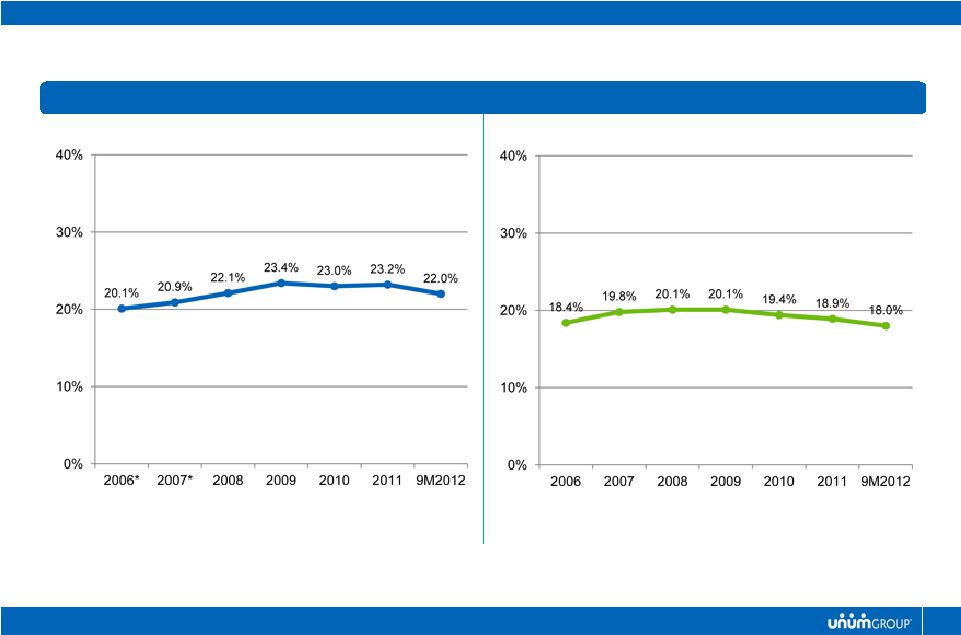 11
Colonial Life
Unum US
Other Expense Ratios
Operating Performance
EXPENSE MANAGEMENT RIGOR
*
Excludes special items |
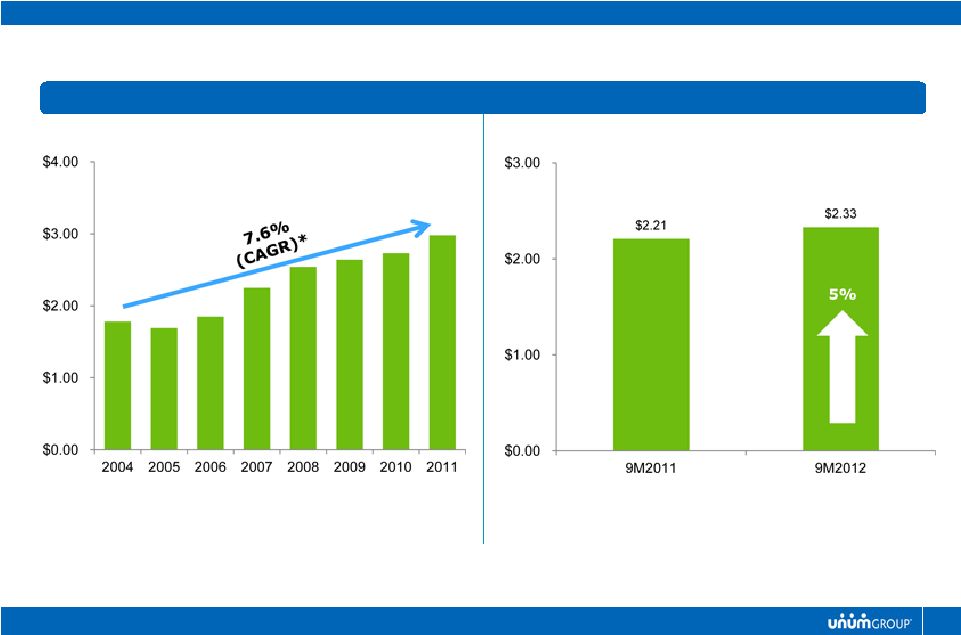 12
Operating Earnings Per Share
Operating Performance
SOLID PROFITABILITY
Years 2004-2008 do not reflect the impact of ASU 2010-26 and special
items * EPS Growth Rate |
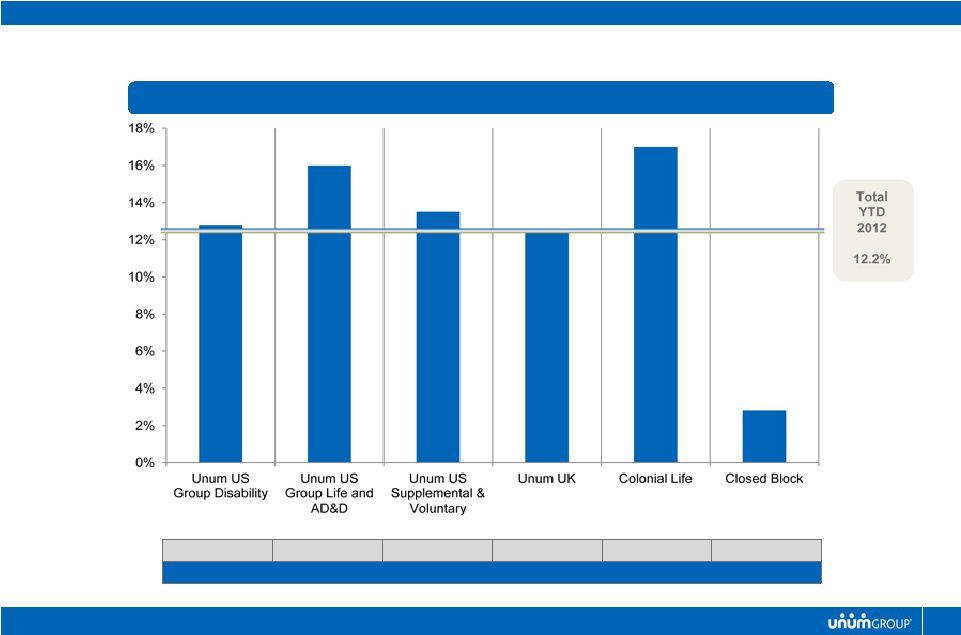 13
YTD 2012 Return on Equity
Operating Performance
19%
11%
20%
10%
13%
27%
YTD % AVERAGE CONSOLIDATED GAAP EQUITY*
CONSISTENTLY STRONG RETURNS
*
Excludes Corporate segment |
 14
Claimant Research
Persistency
Brand
STRONG MARKET ACCEPTANCE
% Satisfied
Unum
Industry
Average
Unum
Rank
Overall handling
91%
87%
#1
Clear explanation
88%
83%
#1
Quality of interaction
90%
86%
#1
Likely to recommend
90%
87%
#1
LTD Claimant Satisfaction
Source: 2011 GenRe Survey of LTD Claimants |
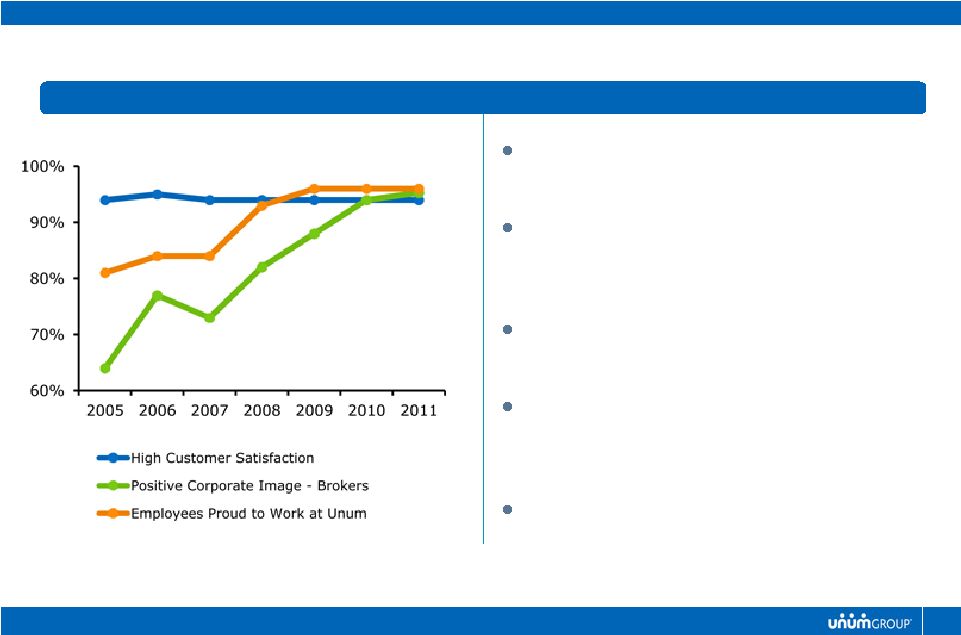 15
Image and Reputation
External Recognition
Brand
BROAD RECOGNITION
Source: Internal surveys of employees, brokers, and customers
Best Places to Work in Insurance
2009 –
2012
Best Places to Work in Maine,
Tennessee, and South Carolina
2006 –
2012
Forbes Magazine –
Top 150 Most
Reputable Companies
Center for Political Accountability –
Corporate Leader in Political Disclosure
and Accountability
Newsweek Magazine –
Green
Companies -
#34 |
 16
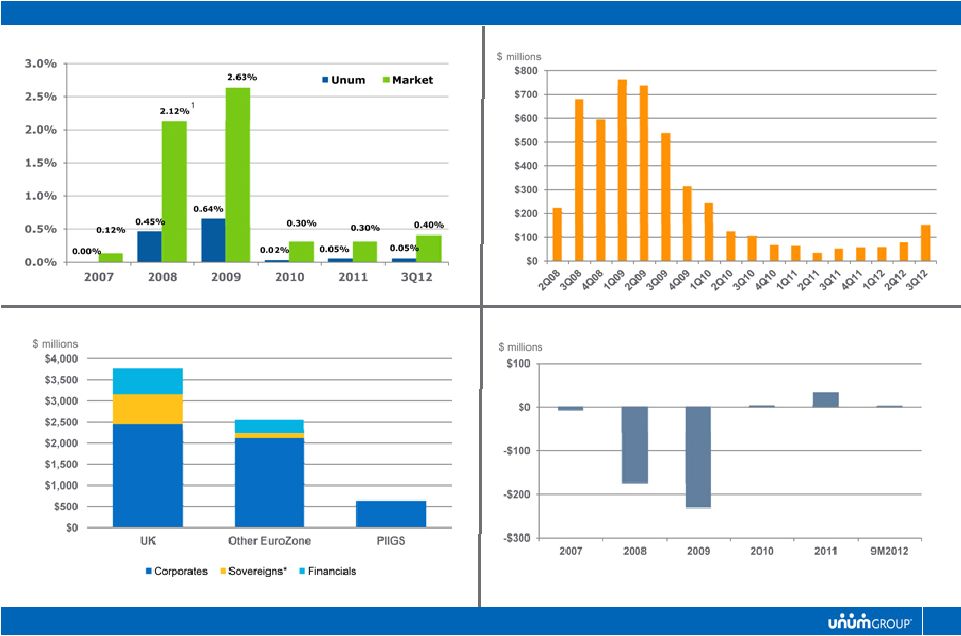
Investment Performance
STRONG CREDIT QUALITY
Default Experience
Watch List
Watch List
1
Formerly 5.12% due to Lehman, Moody’s has subsequently removed it
Sales and Write-downs of Investments
Sales and Write-downs of Investments
* Includes Supranationals
Breakdown of UK and EuroZone Exposure |
 17
2012 Results to Date:
$2.7 billion invested
New money yield of 4.88% (hedge-adjusted)
Overall portfolio yield down 13 bp to 6.54%
Current investment portfolio market value $51.8 billion
Interest Rate Impacts:
Investing new cash flows at lower rates
Decreases to reserve discount rates
Potential persistency impacts as result of price increases
Mitigating Factors:
Placement of premium rate increases
Measured reduction in interest reserve margins
Operating effectiveness (expense management and risk management)
Investment Performance
ACTIVE INTEREST RATE MANAGEMENT |
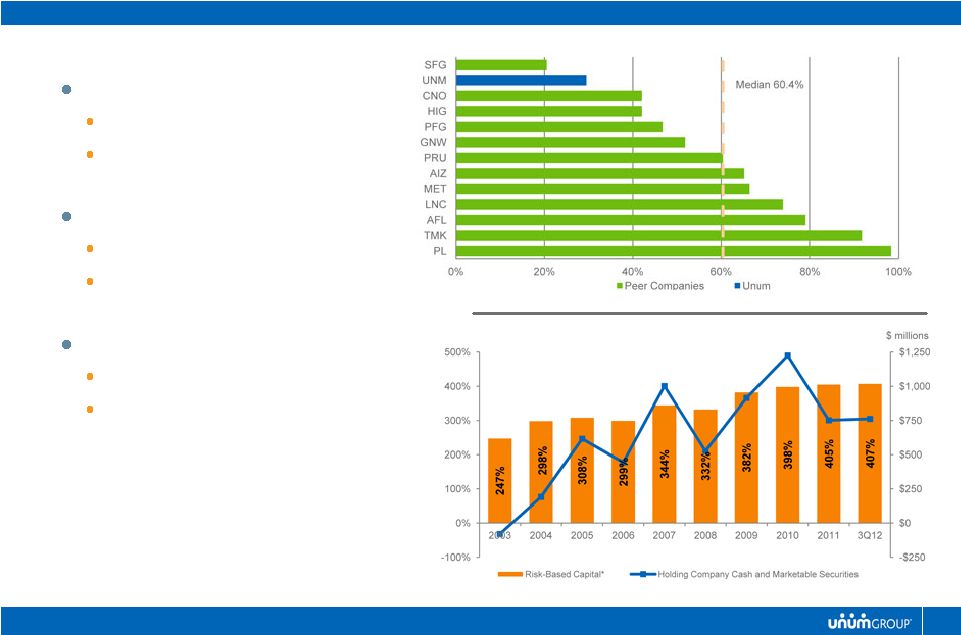 18
Balance Sheet
QUALITY BALANCE SHEET
Source: Moody’s Investor Service
Goodwill and Intangibles (% of Stockholders Equity)
* Weighted average RBC for traditional US Insurance Companies
Capital Management
Asset Quality
Low Level of Intangibles
Solid Investment Portfolio
Liabilities
Comfortable Leverage
Low Disintermediation Risk
Capital
Insurance Company Strength (RBC)
Holding Company Cash Levels |
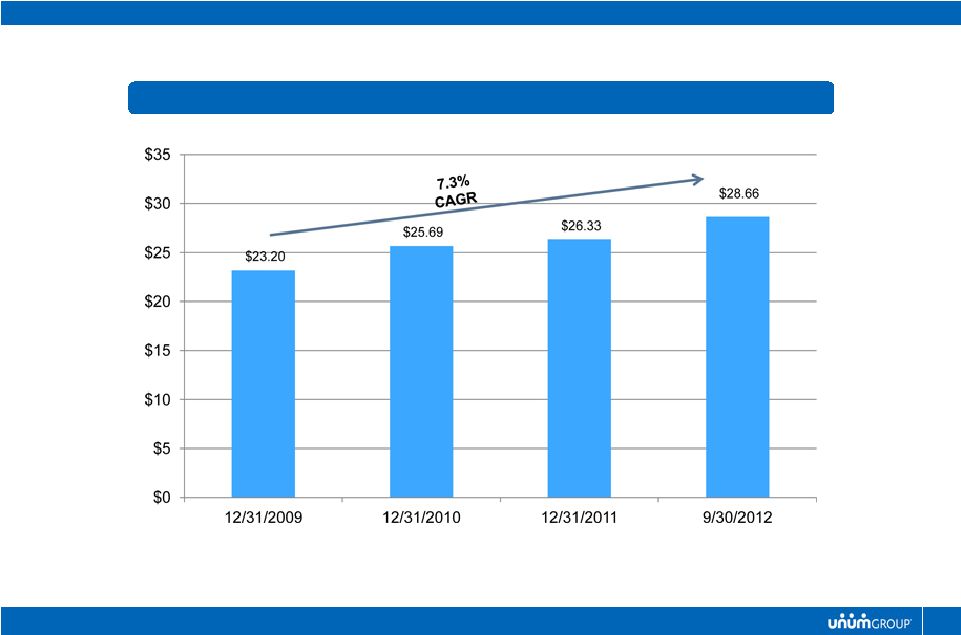 19
Book Value Per Share
Balance Sheet
BUILDING BOOK VALUE
(Excluding AOCI) |
 20
($ millions)
($ millions)
Combined Statutory Net Income*
Capital Generation Model
Capital Management
STABLE CASH FLOW
*
Statutory Net Income for traditional US Insurance Companies excluding special
items STATUTORY NET INCOME
U.S.
$600 -
$650
U.K.
$100 -
$150
$700 -
$800
CAPITAL REQUIRED TO
SUPPORT CURRENT GROWTH
+/-
$50
INTEREST EXPENSE
$150
EXCESS CAPITAL GENERATED
ANNUALLY BEFORE DIVIDENDS
$550 -
$650 |
 21
($ millions)
Risk-Based Capital
Holding Companies Cash and Marketable Securities
Capital Management
STRONG CAPITAL POSITION IN 2012
As of 9/30/2012 |
 22
Capital Management
CONSISTENT RETURN OF CAPITAL TO SHAREHOLDERS
Rating Agency Actions
S&P Upgrade
Share Repurchases
2008
2009
$700 million
---
Moody’s Upgrade
Fitch Upgrade
A.M. Best Upgrade
2010
2011
$356 million
$620 million
TOTAL
$2,176 million
*
Projection for 2012
Dividend Increase
---
+10%
+12%
+14%
$578 million
S&P Upgrade
Moody’s Upgrade
2012
$500 million *
+24% |
 Key Challenges |
 24
Operating Performance
Unum UK -
Group Life
Long-term Care
Interest Rate Management
Key Challenges |
 25
Key Messages
Operating Performance
UNUM UK –
GROUP LIFE
Our primary focus is to stabilize
profitability in 2013 and improve returns
and growth over the medium term.
Our segmented growth strategy and
focus on rate increases is expected to
improve profitability; however, pressure
on new sales and persistency is also
likely.
We are evaluating reinsurance
alternatives to reduce volatility.
We continue to remain focused on
operating effectiveness.
Operating Results |
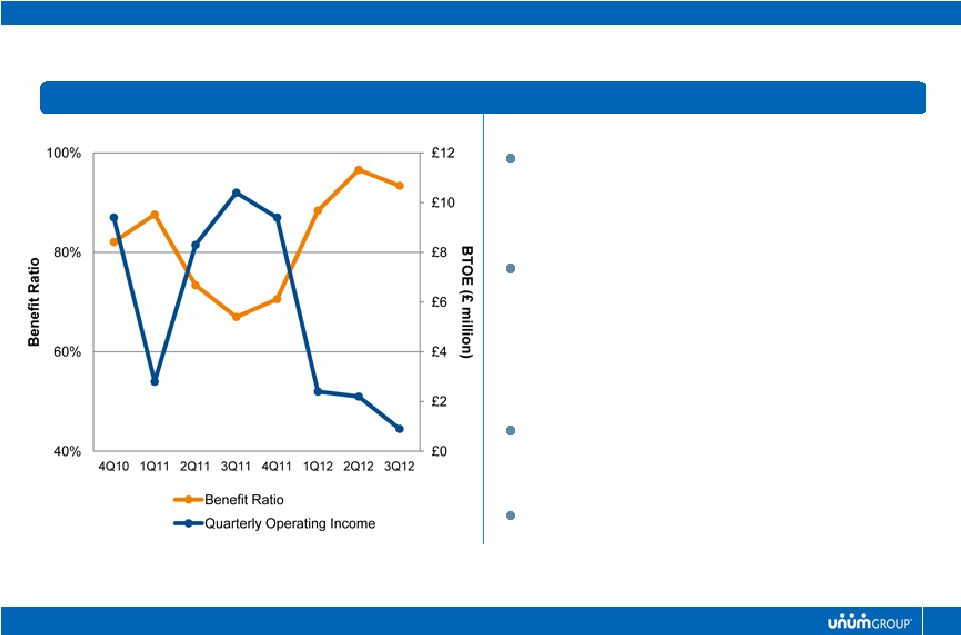
 26
Key Messages
Operating Performance
LONG-TERM CARE
•
Primary Risks:
•
Interest Rates –
we see 2 to 3 years of
sufficient margin for low interest rates.
•
Risk Experience –
claim volatility expected
given very young age of block; IALR
estimated
in
range
of
85%
to
90%
(+/-
5%).
•
Primary risk mitigating factor is our
ability to raise rates on in-force
business.
Interest Adjusted Loss Ratio
* Excludes $573.6 million reserve charge.
Including this charge, the IALR was 179.3%. |
 27
10-Year Single-A Bond Yields
Key Messages
Interest Rate Management
Limited amount of new cash flow to
invest relative to portfolio size
Strong interest margins
Hedges cover 20% of LTC cash flows for
2013
Pricing adjustments
Source: Bloomberg
Nov 2011 |
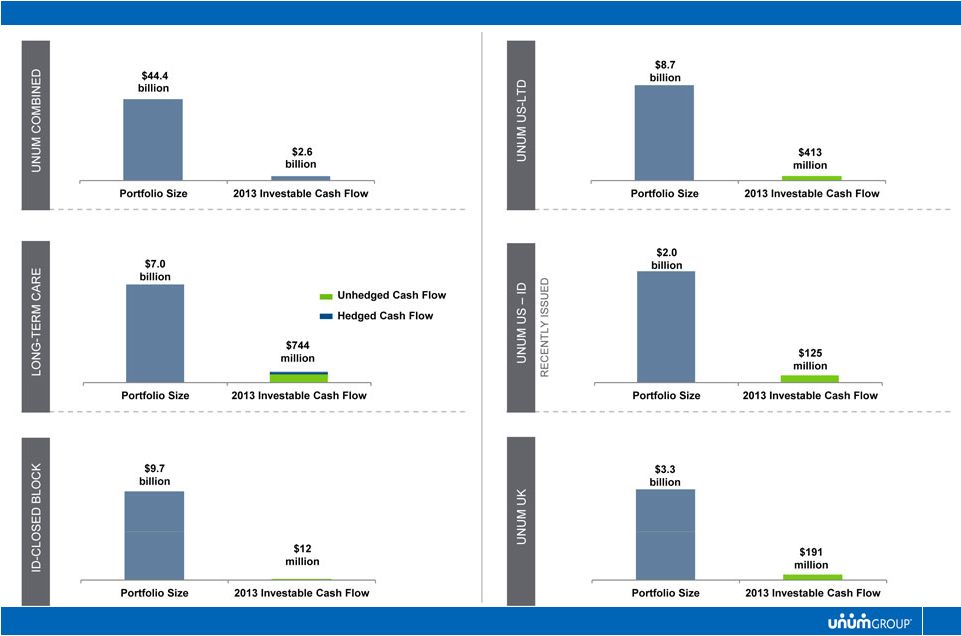 28
Interest Rate Management
2013 INVESTABLE CASH FLOW |
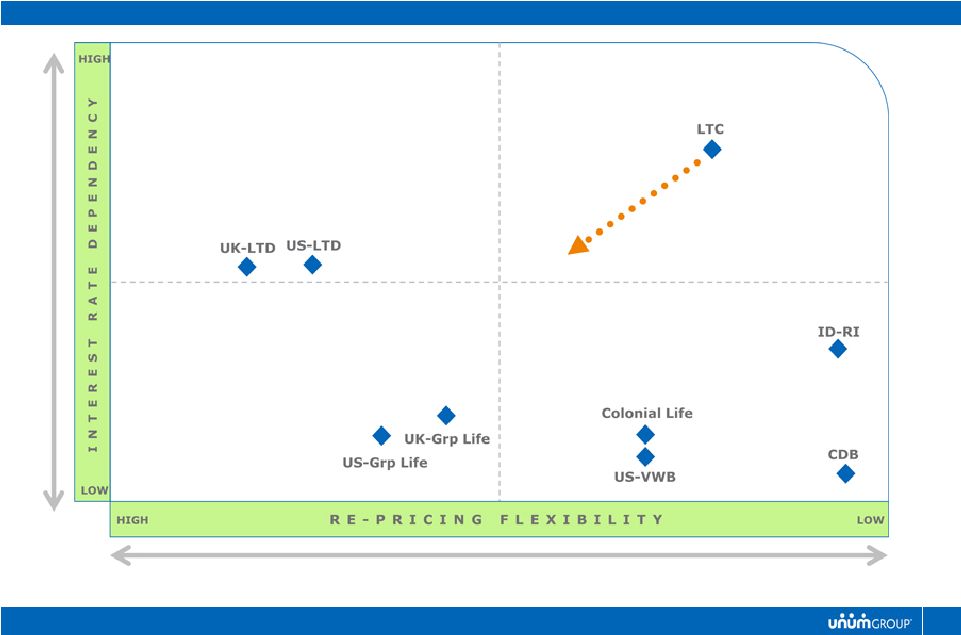 29
Interest Rate Management
PRODUCT LINE SENSITIVITIES |
 2012 Assessment |
 31
2012*
Annual Outlook
2012
9 Months Actual
Sales Growth
5 -
8%
6.1%
Premium Growth
0 -
2%
2.7%
Earnings Per Share Growth
6 -
12%
5.4%
Return on Equity
11 -
12%
12.2%
2012 Assessment
* Original outlook for 2012 as of November 16, 2011
|
 32
2012 Assessment
FACTORS THAT IMPACTED OUR 2012 OUTLOOK
* November 16, 2011 Annual Investor Meeting |
 2013 Outlook |
 34
We anticipate the general environment for 2013 to be similar to 2012.
Below average economic growth with limited employment growth
A continuation of today’s low interest rates
While the environment will remain challenging, the need for our products and
services remains strong.
We are taking the needed actions to protect our solid margins and returns.
The impact of our pricing and risk actions will build in 2014 and beyond
We expect to maintain our consistent plan of returning capital to
shareholders. $500 million of share repurchases and continued dividend
increases Maintain solid capital metrics and ratings
While we anticipate 2013 operating growth to be below our long-term targets, we
expect positive operating EPS growth in 2013.
Ninth consecutive year of operating EPS growth
2013 Outlook
KEY MESSAGES |
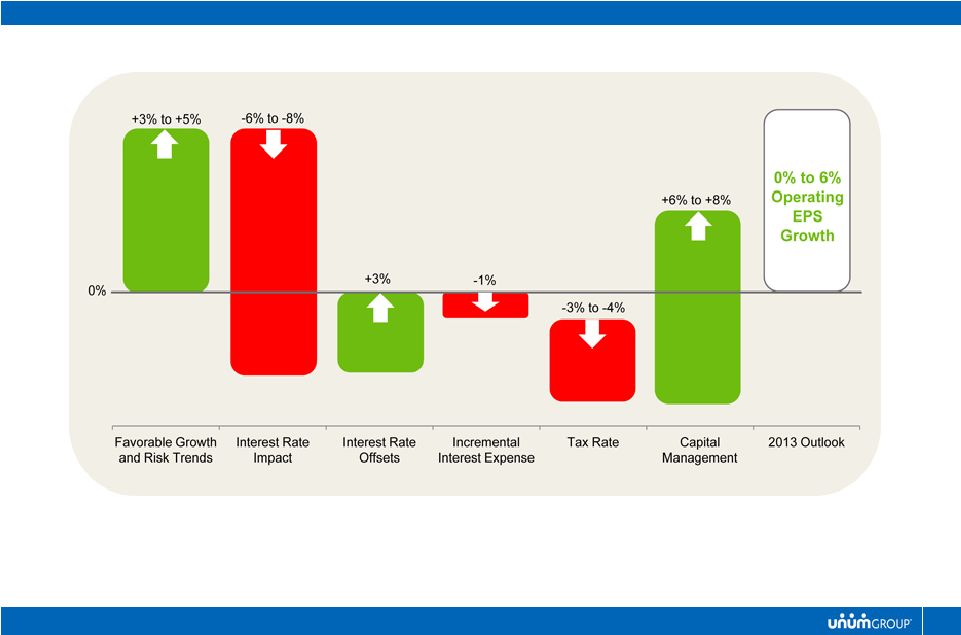 35
2013 Outlook
FACTORS IMPACTING OUR 2013 OUTLOOK |
 36
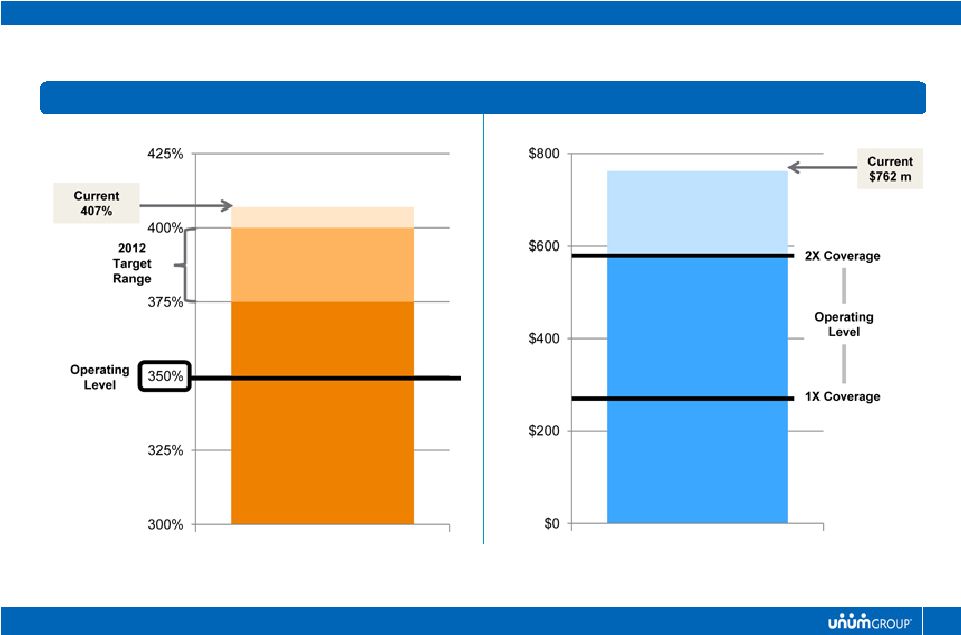
2013 Outlook
CAPITAL OUTLOOK
Capital Management Criteria
2012
Projection
September 30, 2012
Actual
2013
Projection
Risk-Based Capital Ratio for
Traditional U.S. Insurance Companies
375% -
400%
407%
375% -
400%
Leverage
22% -
23%
25%
24% -
25%
Holding Companies Cash and
Marketable Securities ($ millions)
$500 -
$800
$762
$500 -
$800 |
 37
2013 Outlook
Sales
Growth
Premium
Growth
Earnings
Growth
ROE
Unum US
3 -
6%
1 -
3%
0 -
2%
12 -
14%
Unum UK ($)
(15 -
20)%
(17 -
20)%
(1) -
1%
15 -
17%
Colonial Life
3 -
6%
3 -
5%
1 -
3%
15 -
17%
Core Operations
1 -
5%
0 -
2%
0 -
2%
13 -
15%
Closed Block
15 –
20%
2 -
4%
Total Operations*
(2 -
5)%
10 -
12%
Capital Management
6 -
8%
0 -
1%
Total
0 -
6%
11 -
12%
* Consolidated After-Tax Operating Earnings including Corporate
Segment |
 Closing Comments |
 39
Good businesses with positive long-term trends
We remain committed to disciplined growth
Not
tempted
to
“stretch”
in
these
uncertain
times
Our solid financial foundation and predictable cash flow remain an asset
Leading to a consistent capital deployment strategy
We have a realistic but cautious outlook for the environment
Confident we are taking the actions needed to build value
Closing Comments |
 40
Closing Comments
A Look At Our Performance |
 Question and Answer |
 Reconciliation of Non-GAAP Financial
Measures |
 43
Reconciliation of Non-GAAP Financial Measures
Year Ended
December 31
2002 *
(in millions)
Unum US
Group Disability
289.9
$
Group Life and Accidental Death and Dismemberment
224.1
Supplemental and Voluntary
165.9
Total Unum US
679.9
Unum UK
69.5
Colonial Life
137.5
Closed Block
170.4
Corporate
(155.0)
Total Operating Income by Segment
902.3
Net Realized Investment Loss
(309.1)
Income Tax
(196.3)
Income from Continuing Operations Before Cumulative Effect
of Accounting Principle Change
396.9
Income from Discontinued Operations, Net of Tax
11.4
Cumulative Effect of Accounting Principle Change, Net of Tax
(7.1)
Net Income
401.2
$
* Does not reflect the impact of ASU 2010-26 or the segment reporting changes implemented in Q4
2008. 2012
2011
Unum US
Group Disability
219.6
$
225.2
$
Group Life and Accidental Death and
Dismemberment 165.8
155.9
Supplemental and Voluntary
249.5
228.4
Total Unum US
634.9
609.5
Unum UK
96.3
138.8
Colonial Life
206.0
205.1
Closed Block
66.7
93.1
Corporate
(73.9)
(59.6)
Total Operating Income by
Segment 930.0
986.9
Net Realized Investment Gain (Loss)
31.6
(12.3)
Non-operating
Retirement-related Loss (34.8)
(24.0)
Income Tax
(266.3)
(297.4)
Net Income
660.5
$
653.2
$
(in millions)
Nine Months Ended September 30 |
 44
Reconciliation of Non-GAAP Financial Measures
(in millions)
benefit ratio
(in millions)
benefit ratio
Unum US
Premium Income
4,481.1
$
4,703.6
$
Benefits and Change in Reserves for Future Benefits
3,681.3
82.2%
4,263.4
90.6%
Regulatory Reassessment Charge
(76.5)
(349.2)
Benefits and Change in Reserves for Future Benefits, Excluding
Regulatory Reassessment Charge
3,604.8
80.4%
3,914.2
83.2%
2006
Year Ended December 31
2007
(in millions)
Other Expense Ratio
(in millions)
Other Expense Ratio
Unum US
Premium Income
4,481.1
$
4,703.6
$
Other Expenses
927.5
20.7%
958.5
20.4%
Regulatory Reassessment Charge
10.3
(15.0)
Other Expenses Excluding Regulatory Reassessment Charge
937.8
20.9%
943.5
20.1%
Year Ended December 31
2007
2006 |
 45
Reconciliation of Non-GAAP Financial Measures
2011
2010
2009
2008
2007**
2006**
2005**
2004**
After-tax Operating Income
2.98
$
2.73
$
2.64
$
2.54
$
2.25
$
1.85
$
1.69
$
1.78
$
Net Realized Investment Gain (Loss), Net of Tax
(0.01)
0.05
-
(0.89)
(0.12)
0.01
(0.02)
0.06
Non-operating Retirement-related Loss, Net of Tax
(0.07)
(0.06)
(0.09)
(0.03)
(0.04)
(0.05)
(0.05)
(0.04)
Deferred Acquisition Costs and Reserve Charges for
Closed Block, Net of Tax
(2.04)
-
-
-
-
-
-
(2.37)
Regulatory Reassessment Charges, Net of Tax
-
-
-
-
(0.10)
(0.79)
(0.16)
(0.29)
Special Tax Items and Debt Extinguishment Costs
0.08
(0.03)
-
-
(0.10)
0.23
0.14
0.17
Other, Net of Tax
-
-
-
-
-
(0.04)
0.01
0.01
Income (Loss) from Continuing Operations
0.94
2.69
2.55
1.62
1.89
1.21
1.61
(0.68)
Income (Loss) from Discontinued Operations
-
-
-
-
0.02
0.02
0.03
(0.18)
Net Income (Loss)
0.94
$
2.69
$
2.55
$
1.62
$
1.91
$
1.23
$
1.64
$
(0.86)
$
* Amounts per diluted common share.
** Does not reflect the impact of ASU 2010-26.
Year Ended December 31*
2012
2011
(in millions)
per share *
(in millions)
per share *
After-tax Operating Income
662.5
$
2.33
$
677.2
$
2.21
$
Net Realized Investment Gain (Loss), Net
of Tax 20.7
0.07
(8.4)
(0.03)
Non-operating
Retirement-related Loss, Net of Tax (22.7)
(0.08)
(15.6)
(0.05)
Net Income
660.5
$
2.32
$
653.2
$
2.13
$
* Amounts per diluted common share.
Nine Months Ended September 30 |
 46
Reconciliation of Non-GAAP Financial Measures
After-Tax
Average
Operating
Allocated
Annualized
Income (Loss)
Equity
Return
On Equity
Nine Months Ended September 30, 2012
Unum US
Group Disability
144.5
$
1,503.5
$
12.8%
Group Life and Accidental Death and Dismemberment
108.0
897.0
16.0%
Supplemental and Voluntary
163.7
1,618.5
13.5%
Total Unum US
416.2
4,019.0
13.8%
Unum UK
73.1
787.4
12.4%
Colonial Life
133.9
1,051.1
17.0%
Closed Block
43.8
2,121.5
2.8%
Corporate
(4.5)
(715.5)
Total
662.5
$
7,263.5
$
12.2%
Nine Months Ended September 30, 2011
Unum US
Group Disability
148.3
$
1,504.1
$
13.1%
Group Life and Accidental Death and Dismemberment
101.5
840.2
16.1%
Supplemental and Voluntary
149.7
1,527.2
13.1%
Total Unum US
399.5
3,871.5
13.8%
Unum UK
112.4
775.1
19.3%
Colonial Life
133.3
978.2
18.2%
Closed Block
57.7
2,388.4
3.2%
Corporate
(25.7)
(319.0)
Total
677.2
$
7,694.2
$
11.7%
(in millions) |
 47
Reconciliation of Non-GAAP Financial Measures
September 30
December 31
September 30
December 31
2012
2011
2011
2010
Total Stockholders' Equity, As Reported
8,673.3
$
8,169.7
$
8,995.8
$
8,484.9
$
Net Unrealized Gain on Securities
892.2
614.8
894.0
416.1
Net Gain on Cash Flow Hedges
400.3
408.7
421.1
361.0
Total Stockholders' Equity, As Adjusted
7,380.8
$
7,146.2
$
7,680.7
$
7,707.8
$
Average Equity, As Adjusted
7,263.5
$
7,694.2
$
September 30
2012
2011
2010
2009
Total Stockholders' Equity (Book Value)
31.53
$
27.91
$
26.80
$
24.25
$
Net Unrealized Gain on
Securities 3.24
2.11
1.31
1.16
Net Gain on Cash Flow Hedges
1.46
1.39
1.14
1.12
Subtotal
26.83
24.41
24.35
21.97
Foreign Currency Translation Adjustment
(0.29)
(0.41)
(0.34)
(0.23)
Subtotal
27.12
24.82
24.69
22.20
Unrecognized Pension and Postretirement Benefit Costs
(1.54)
(1.51)
(1.00)
(1.00)
Total Stockholders' Equity, Excluding Accumulated
Other Comprehensive Income
28.66
$
26.33
$
25.69
$
23.20
$
December 31
(per share)
(in millions)
September 30
2012
(in millions)
Debt, As Reported
3,239.8
$
Exclude Non-recourse Debt and Securities Lending Agreements
1,045.2
Debt, As Adjusted
2,194.6
$
Total Stockholders' Equity, As Reported
8,673.3
$
Exclude Net Unrealized Gain on Securities and
Net Gain on Cash Flow Hedges
1,292.5
Exclude Northwind and Tailwind Capital
855.7
6,525.1
Debt, As Adjusted
2,194.6
Total Capital, As Adjusted
8,719.7
$
Debt to Capital Ratio
25.2% |